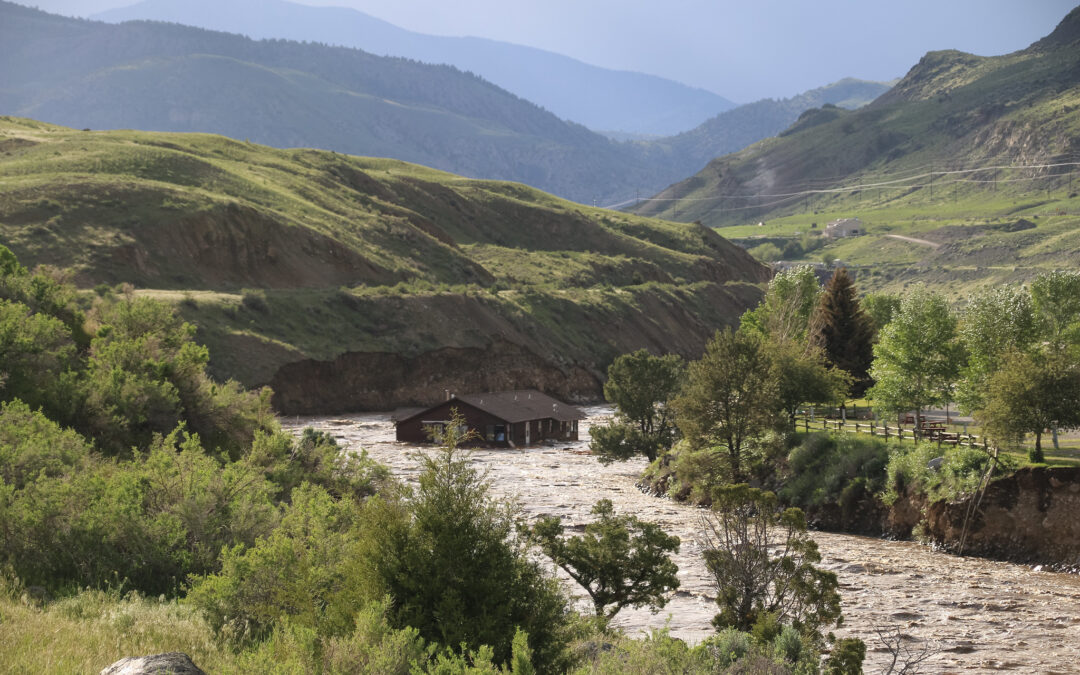
Over the course of three days this week, unprecedented rains and early snowmelt combined to close Yellowstone National Park and change its landscape forever. Rivers in Montana, Idaho, and Wyoming burst their banks.
The Park’s worst flood before those three days occurred in 1978. Experts called it a 1 in 100 years event. The US Geological Survey considered this month’s flooding to be a 1 in 500 years event.
Some forecasts see more precipitation in Yellowstone this weekend. Park administrators say they are watching the weather closely but park plans to rebuild ruined infrastructure are already underway. This time, however, they will take into account climate change.
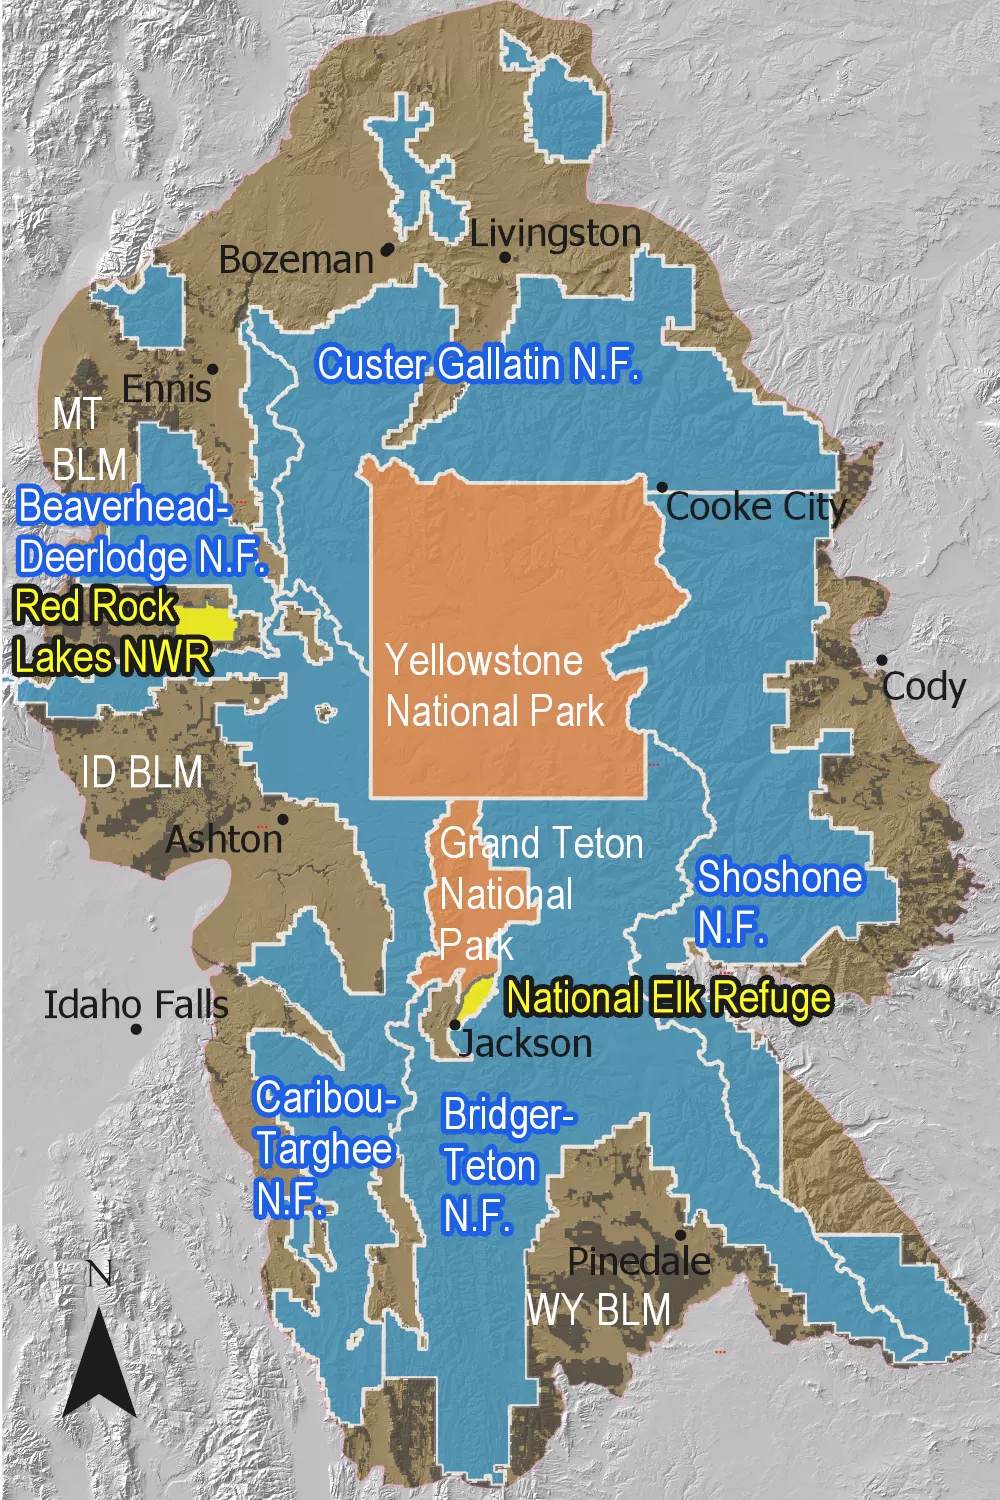
The National Park sits in the middle of the Greater Yellowstone ecosystem, which runs from the Canadian border to Wyoming. Source: National Park Service.
The Greater Yellowstone Area includes parts of six major rivers: the Missouri, Upper Yellowstone, Big Horn, Upper Green, Snake Headwaters, and Upper Snake. It is one of the few remaining large and nearly intact temperate ecosystems on Earth. As the 2021 Greater Yellowstone Climate Assessment (GYCA) noted, climate change impacts on the area often push the bounds of historical trends. What happens in this area also impacts agricultural areas in the Northern High Plains.
Yellowstone Faces Major Climate Challenges
The 2021 GYCA predicted significant changes in precipitation timing and type. More spring rain and less winter snow are foreseen. Precipitation for June 2022 is already over 400% of normal in parts of the Yellowstone area.
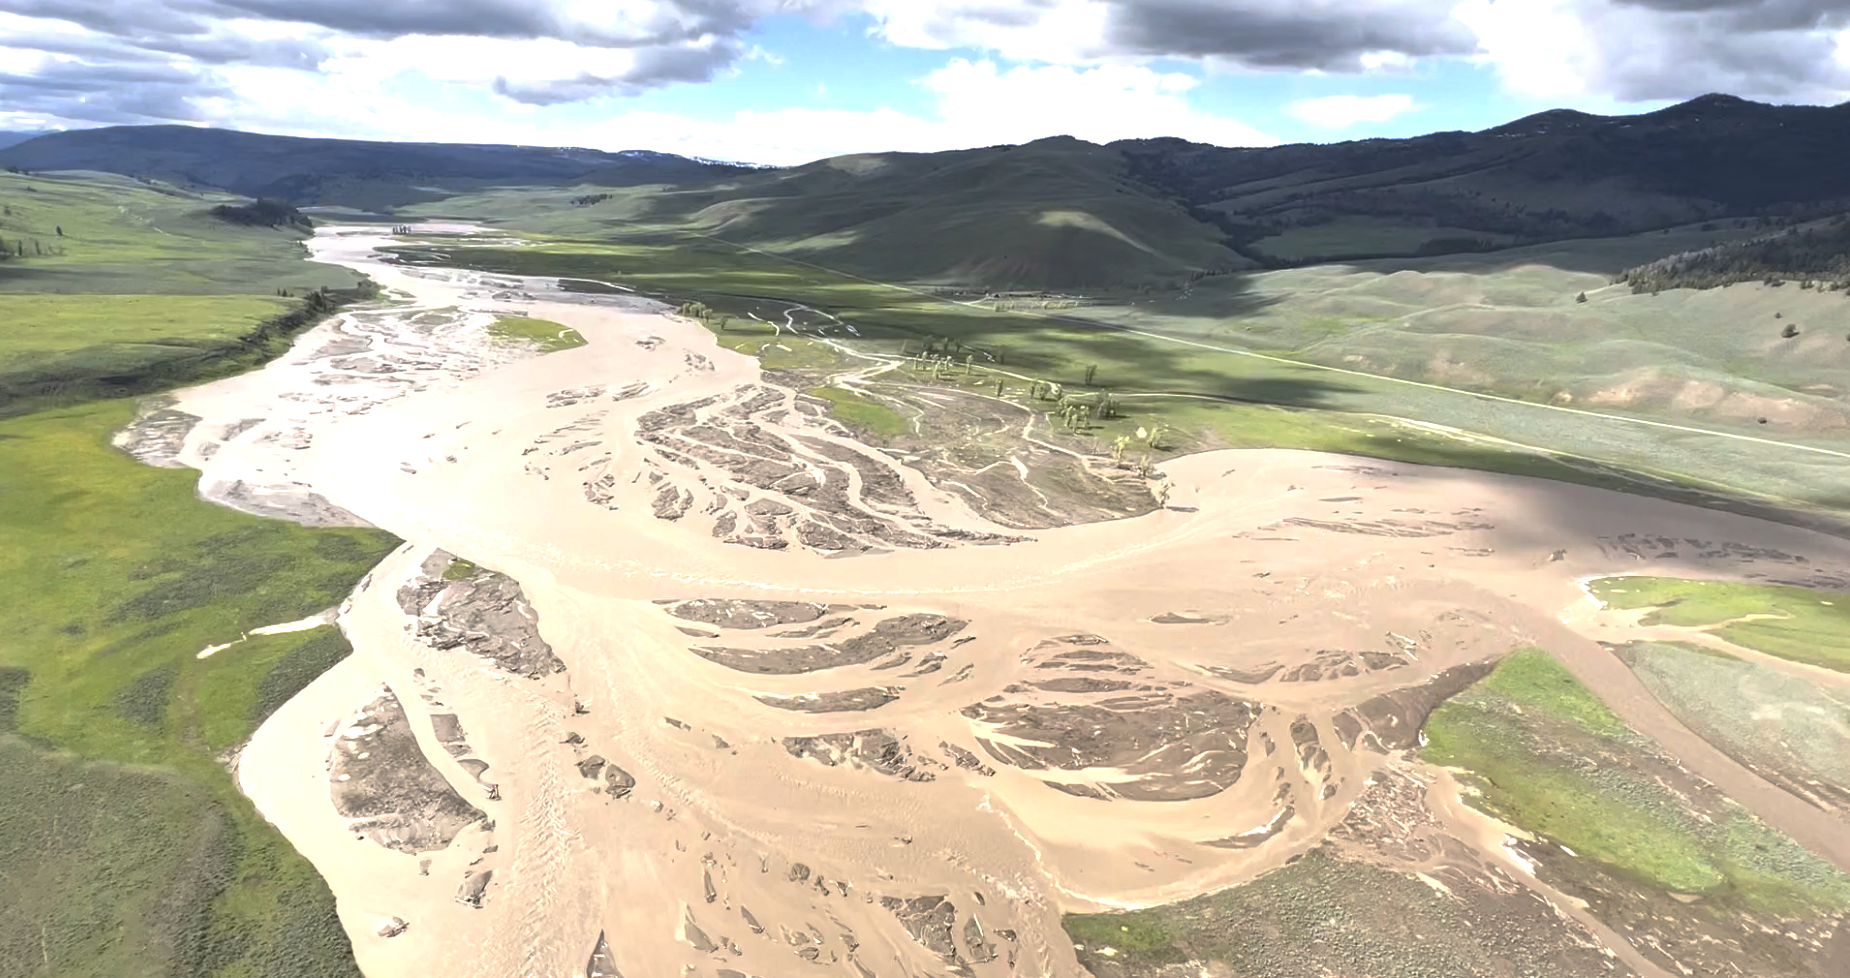
Flooded Lamar River in Yellowstone National Park. Source: National Park Service.
The timing of peak streamflows have already changed. Water amounts have not changed significantly in most of the area but there have been increases in the Yellowstone, Gallatin, and Madison rivers. All are tributaries of the Missouri River.
The GYCA showed peak flows have shifted 1 to 15 days earlier, lengthening the hot season when water is limited. In some areas, spring flows have increased by 30 to 80 percent. For other areas, minimum flows have declined by 10 to 40 percent in the summer and winter.
In the Greater Yellowstone Area, potential evapotranspiration is less than precipitation on an annual basis. At lower elevations in summer, the reverse is true. This brings an increasing seasonal water deficit.
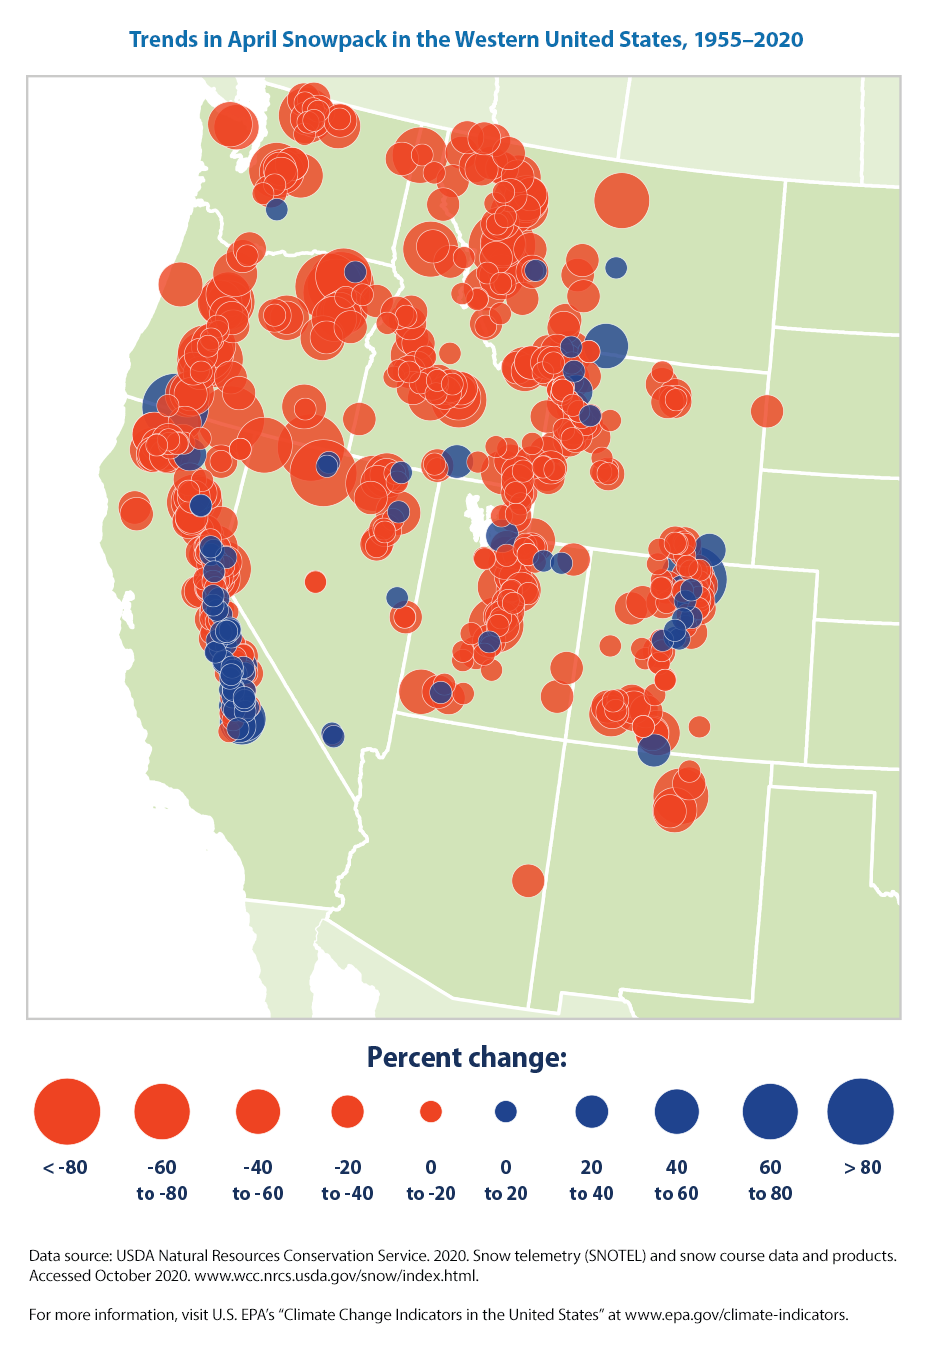
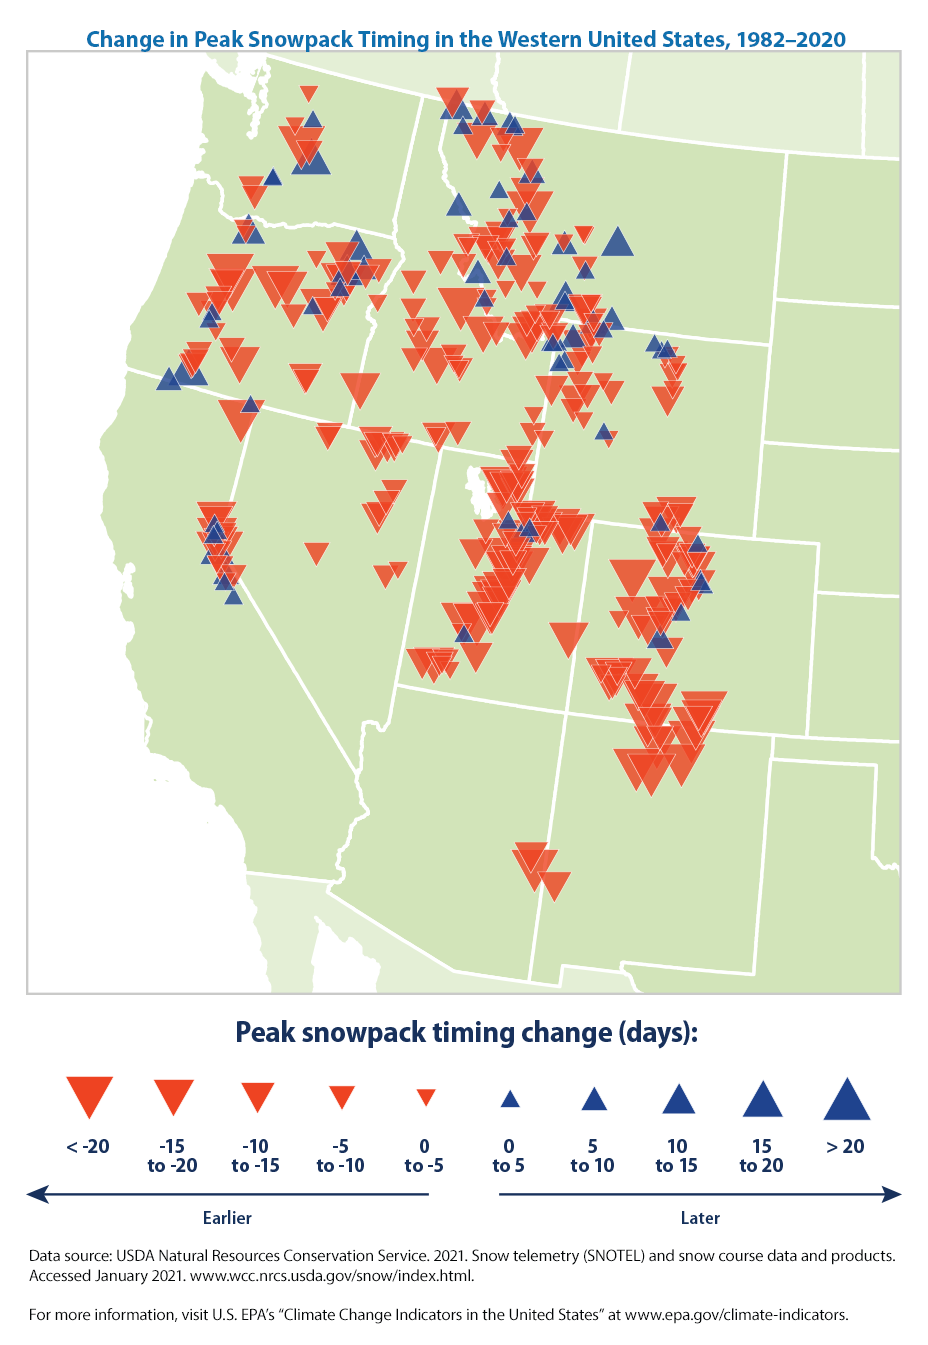
Snowpack Issues Are at the Heart of Water Flow Issues
Warming winters are bringing earlier snowmelt and a loss of snowpack across the West, including in Yellowstone. Warmer winters bring a longer growing season because of longer summers but reduce water availability. They also increase fire risks. Both snowpack and soil moisture impact stream flow. The amount of annual streamflow can vary by up to 300 percent between years because of all these factors.
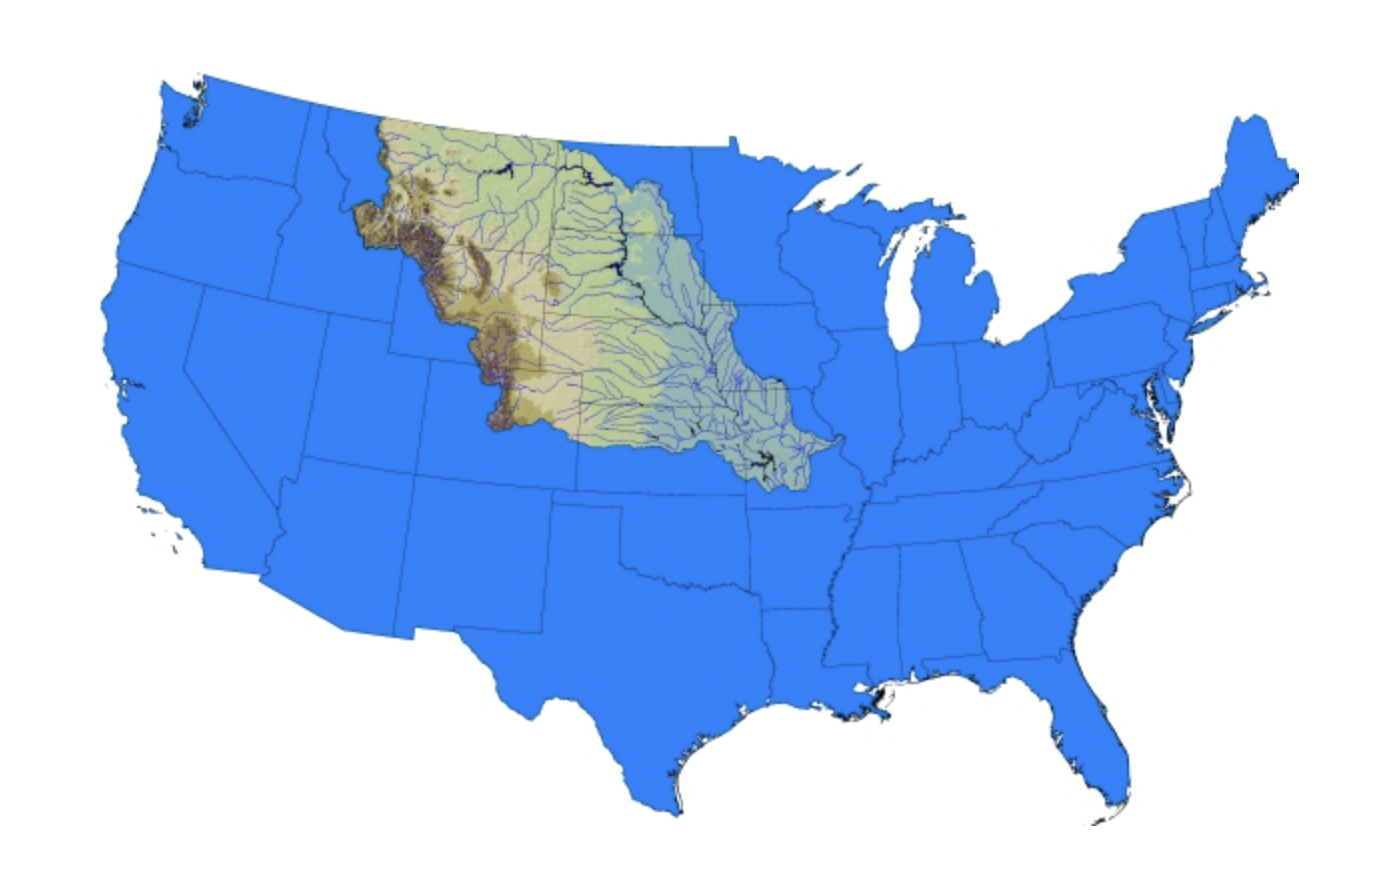
With Headwaters in Yellowstone, the Missouri River Feeds Plains Agriculture
Yellowstone area climate change impacts the Missouri River headwaters and its tributaries. Some studies indicate that rainfall and water access are already changing in the Northern Great Plains and Central Midwest due to agricultural intensification. Models in the Fourth National Climate Assessment saw annual decreases of 30 days or more in the number of days with temperatures under 28 degrees by 2050. This would have serious implications for the region’s snowpack, streamflow, and water use.
Missouri River basin. Source: Army Corps of Engineers.
Parts of the Northern Great Plains are among the most arid in the United States. Because they are far from the coasts, the Northern Great Plains’ climate is not modulated by the oceans. Extreme drought or extreme flooding tends to happen every ten years or so. With less than ten percent of regional precipitation reaching the Missouri River, large changes in flooding can be brought about by small changes in precipitation. A good example of the region’s unpredictable weather is the severe flooding of 2011. It was followed by a drought in 2012.
The Northern Great Plains
Northern Great Plains. Source: Fourth National Climate Assessment, U.S. Global Change Research Program.
Yellowstone’s Changes Has Similarities/Differences to Dust Bowl Weather
Changes in peak streamflow timing since 1970 look similar to the peak timing during the 1930s Dust Bowl drought but the difference is that a year-round decline in precipitation caused the Dust Bowl. As the Greater Yellowstone Climate Assessment points out, the recent change in peak streamflow times is caused by spring temperatures rising sooner. Earlier spring warmth causes earlier snow melting.
A Weak Start To The Indian Monsoon: Its Effect On Commodities
by Jim Roemer – Meteorologist – Commodity Trading Advisor – Principal, Best Weather Inc.
The image above is from Jim Roemer’s latest Weather Wealth Report. If you have not already done so, please feel free to request a two-week complimentary trial subscription here and learn how we use weather to trade futures, options, and ETFs from grains to soft commodities, natural gas, and more. You’ll also get more useful long-range weather forecasts.
Discussion about the Indian Monsoon
Why is the Indian Monsoon important?
India is the world’s biggest producer of sugar, cotton, and pulses (legumes) and the second-biggest producer of wheat and rice. The success of these crops is largely determined by the June-September monsoon, which delivers about 70% of the country’s annual rainfall.
Monsoon’s effects on Indian farmers
India is an agricultural economy, which means most of India’s GDP depends on farm growth and production. More than 50% of the Indian population earns their livelihood through agriculture. Monsoon is one of the most important seasons for farmers in a country so dependent on its agro-industry. Most of the Indian agricultural land is irrigated by the southwest monsoon. Crops such as wheat, rice, and pulses, are staples in Indian diets. They need heavy rainfalls to grow. Rubber trees in the southern region require heavy and regular rain with high temperatures.
Sources: Indian Institute of Tropical Meteorology (Chart) – Best Weather (Inserts)
A look at the history of floods vs. droughts in India
The above image shows total summer and autumn rainfall from 1970 to 2015 (I did not include the last six years of the Indian Monsoon). Notice, historically, that during La Niña events (blue stars) there is a much greater likelihood of some flooding than droughts in India. In contrast, during certain (not all) El Niño events, drought tends to be the rule.
One of the most significant market-impacting drought years that I experienced and can recall, was in the summer of 2009. Back then, flooding in Brazil, combined with a severe drought to sugar cane and some cotton helped sugar prices soar.
Regarding big flood years, the one that stands out most in my mind was the La Niña of 2010. The impact was actually greater on Pakistan’s cotton production than anywhere else. That year, there were droughts to global wheat areas in Russia and a historical move to over $2.00 in cotton on La Niña-related problems.
The Indian Dipole is going negative: What are the potential Indian Monsoon impacts given the present La Niña?
“Down the road” I will discuss more about the Indian Dipole and describe what it is. However, two potential analog years I am looking at that had a weak summer Indian Monsoon (below normal rainfall) were 1962 and 1996. These two years were the exception to the rule, as usually, La Niña means good Indian crops or some flooding, but not drought.
However, a negative Indian Dipole and La Niña can result in the Indian summer heat and some reduction in either cotton, sugar, or ground nut crops.
Notice, for example, one of my favorite analog years (1996) that resulted in the Plains wheat drought and explosion in wheat prices until harvest (late May and June–when prices began to collapse). This particular year had a weak Monsoon and a relatively dry Indian summer for more than 50% of their croplands.
June 1996 rainfall departures from normal (similar to the current La Niña event)
How the Indian Monsoon can influence Q4 gold demand
Amazingly, yes, how much rainfall hits India and affects millions of Indian farmers has a direct effect on gold prices prior to the “wedding season” which lasts from late October to mid-January. Gold plays a significant role in Indian weddings, which number 10 million per year. I will elaborate on this in a later article about how a great Monsoon gives millions of Indian farmers additional income to buy wedding-related gold items. Droughts, on the other hand, have the opposite effect.
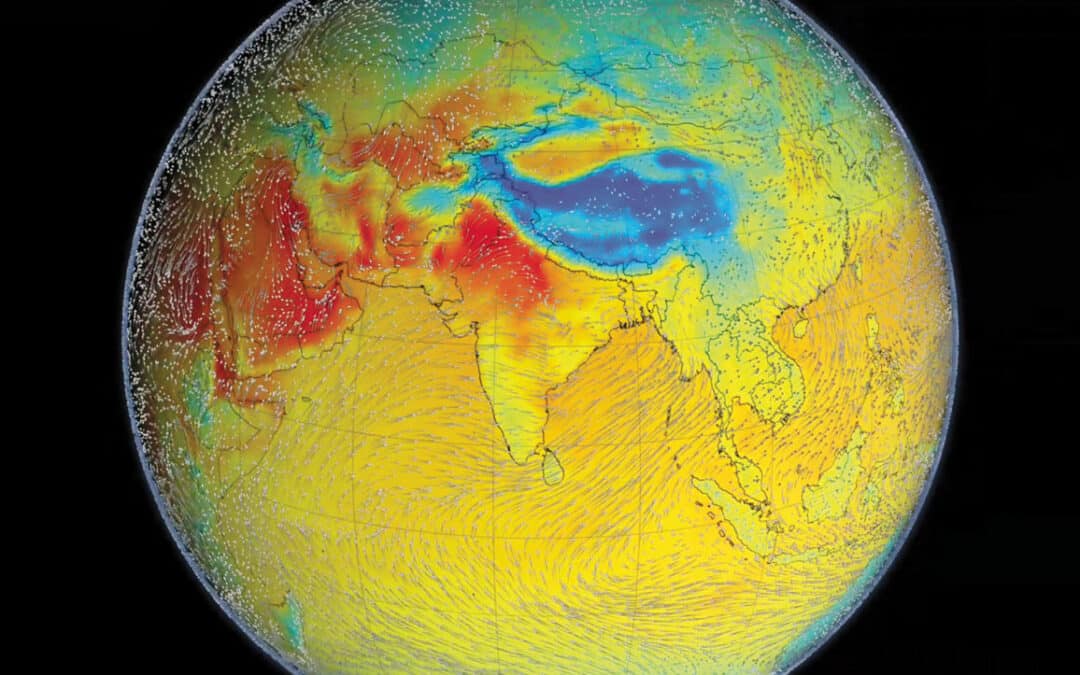
The image below is from my in-house long-range weather forecast application, Climate Predict. For free, readers can access this program at www.climatepredict.com The screenshot suggests the following rainfall trends for the rest of June. This is based on what we call an “east-based La Niña” and also the negative Indian Dipole as well as other phenomena.
Source: June Weather Forecast into early July by climatepredict.com
So, how does an investor (or a hedger) trade grains and soft commodities by incorporating the potential weak Indian Monsoon and global La Niña rainfall trends for June and into summer?
That is where we come in with our Weather Wealth newsletter.
Thanks for your interest in commodity weather!
Jim Roemer
Weather Wealth & Climatelligence
Mr. Roemer owns Best Weather Inc., offering weather-related blogs for commodity traders and farmers. The Weather Wealth blog, including short/long term forecasts and trading ideas, are accessed at https://www.bestweatherinc.com/
He also is co-founder of Climate Predict, a detailed long-range global weather forecast tool. As one of the first meteorologists to become an NFA registered Commodity Trading Advisor, he has worked with major hedge funds, Midwest farmers, and individual traders for over 35 years. With a special emphasis on interpreting market psychology, coupled with his short and long-term trend forecasting in grains, softs, and the energy markets, he established a unique standing among advisors in the commodity risk management industry.
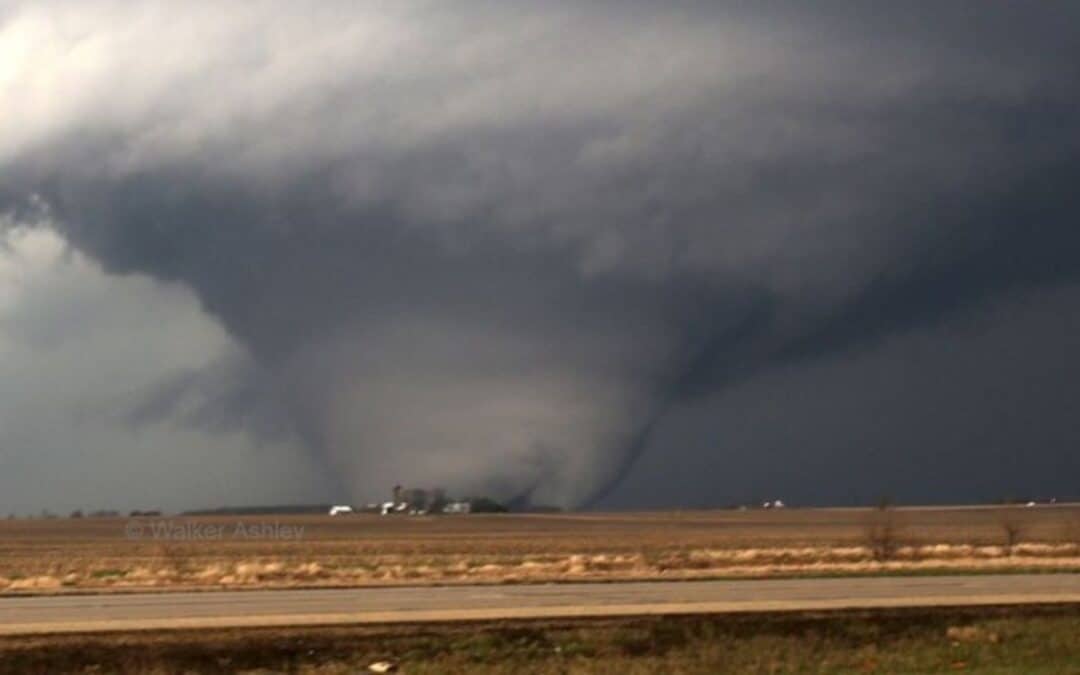
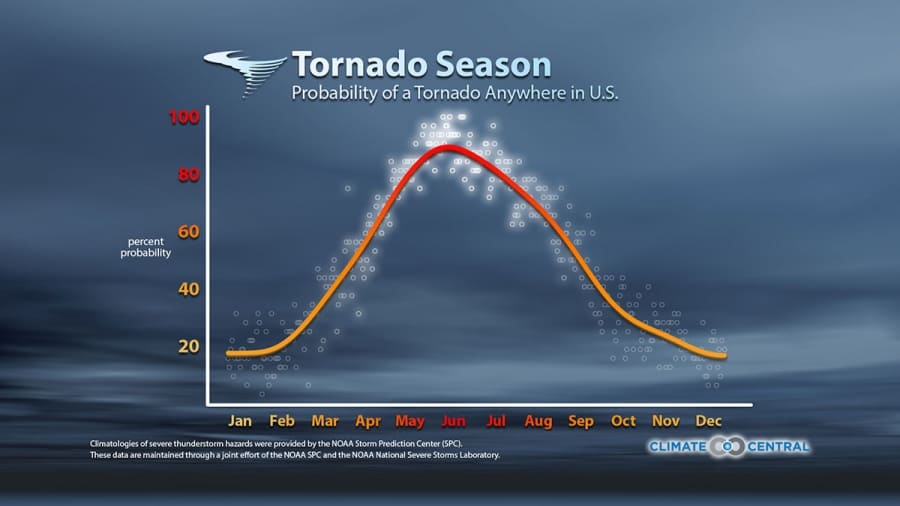
The 2022 tornado season is getting off to a devastating start. If my forecast is correct, the next few months could be some of the most devastating in recent memory. The tornado season often peaks by May and June (see below) and this season could be well above average.
Historically, Tornado Alley receives the brunt of spring storms. However, due to the historic western drought, most activity this winter has been further east. That trend may continue.
What Could Make Tornados Different This Year?
Why is this? When tornadoes develop, they are influenced by three different air masses: 1) Continental Polar (cool air from the north); 2) The subtropical jetstream (moisture from the Gulf of Mexico); 3) Dry air from the Rockies (This helps to create spin in the atmosphere). When all three converge in one location, this can produce tornado outbreaks.
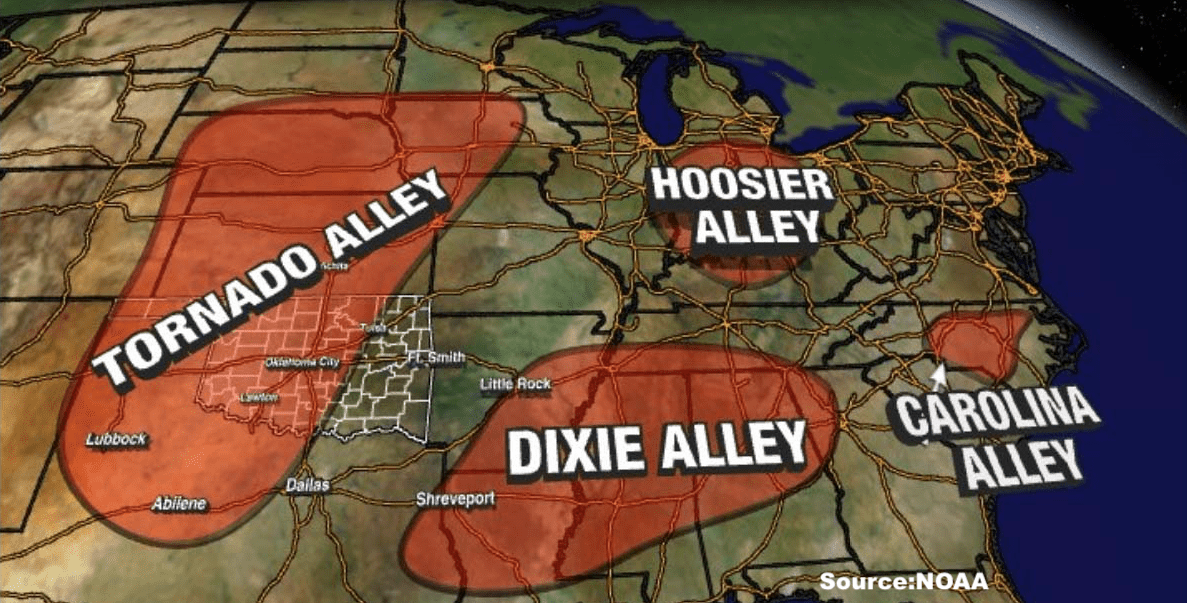
This year, that Gulf moisture may be cut off from tornado alley thanks to the Texas brush fires and drought. This suggests that storms this spring could be much further east into Dixie Alley, Hoosier Alley, and Carolina Alley. These three areas could see tornadic activity at least 150-200% of normal.
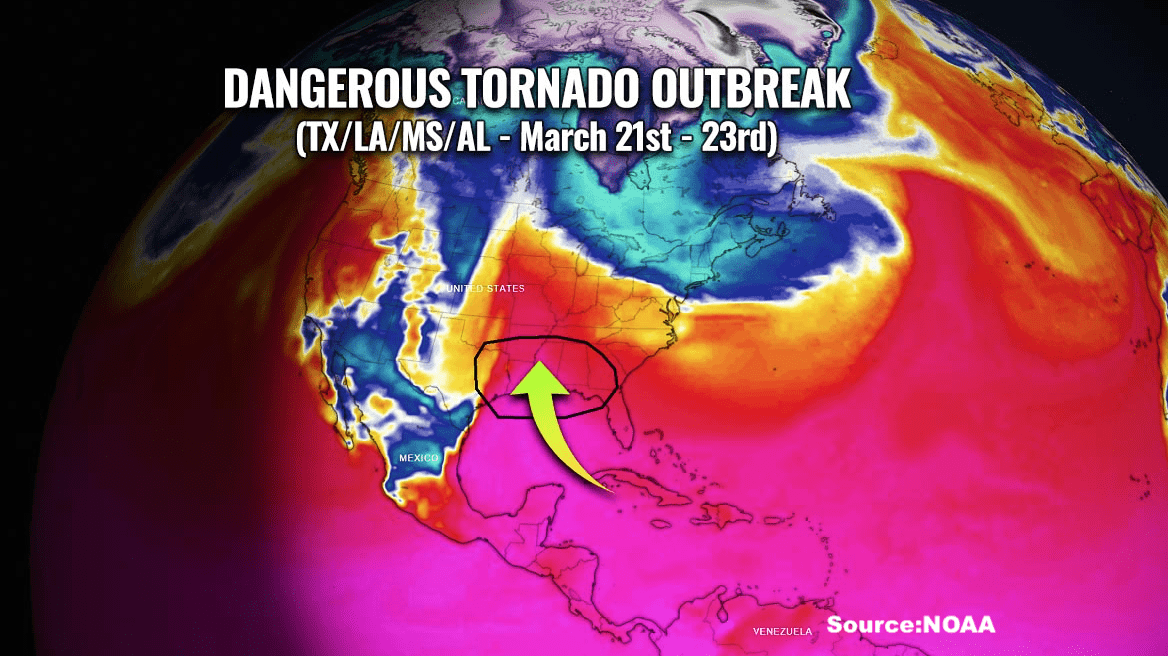
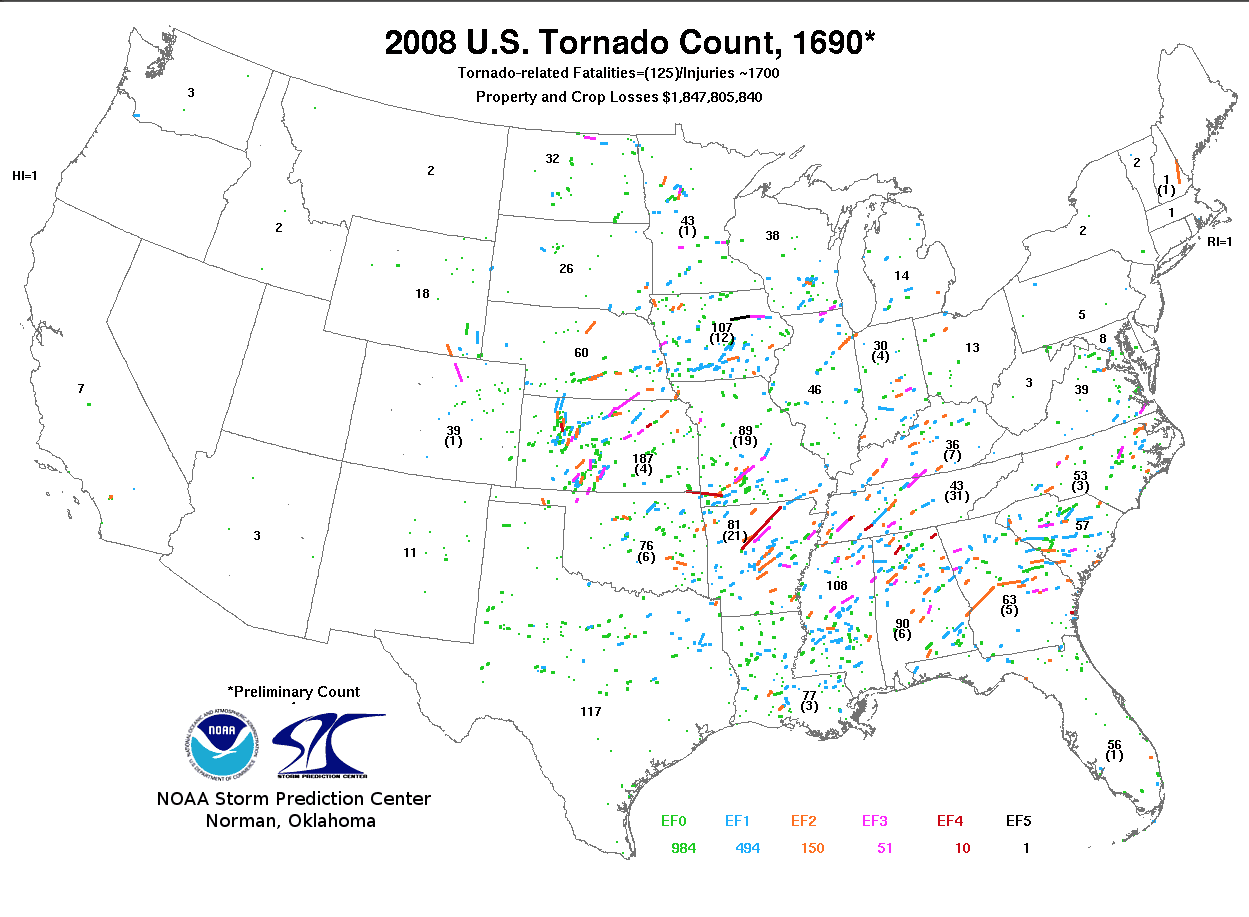
Notice, for example, the big outbreak that has been occurring this week.
This week’s tornado activity. Source: NOAA.
La Nina Could Make Things Worse
There are some weather firms that believe La Nina is going to weaken. However, my Climate Predict software— used by farmers, agribusinesses, and commodity traders around the world–shows a differnt picture. It portends that La Nina will be stronger than most feel until at least May or June.
Right now, my prediction is that this spring’s tornado season could be the worst since the 2008 La Nina.
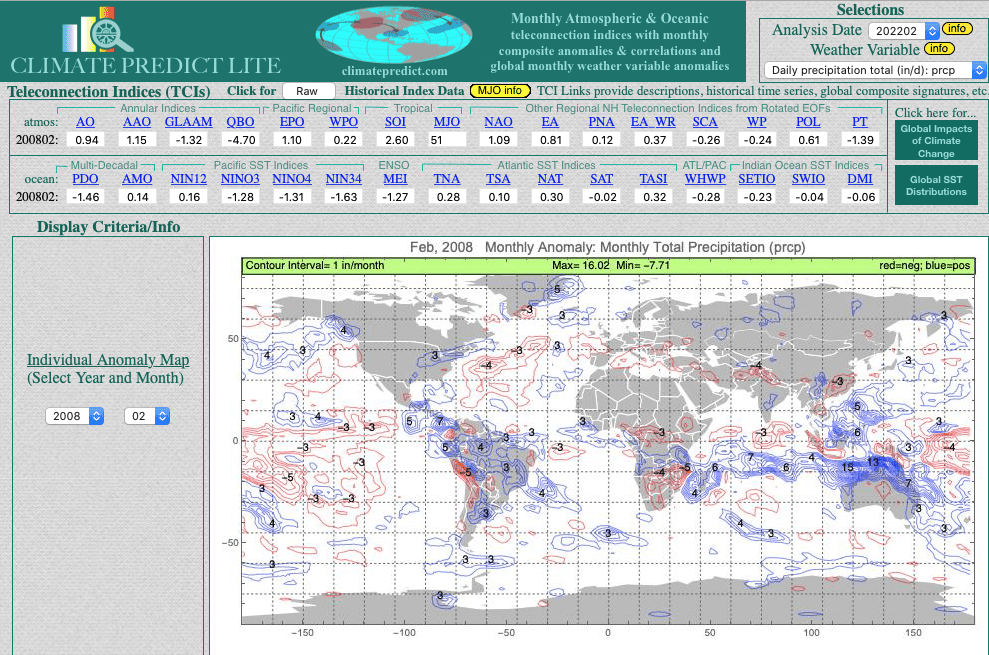
There have been several other climatic occurrences that also may lend credence to an active tornado season and wet spring for Midwest farmers. There are 1) The wet last few months in Australia; 2) The easing of the northern Brazil drought for coffee areas
Climate Predict (below) shows, for example, how wet 2008 was in Australia and northern Brazil, similar to February 2022 (this year)
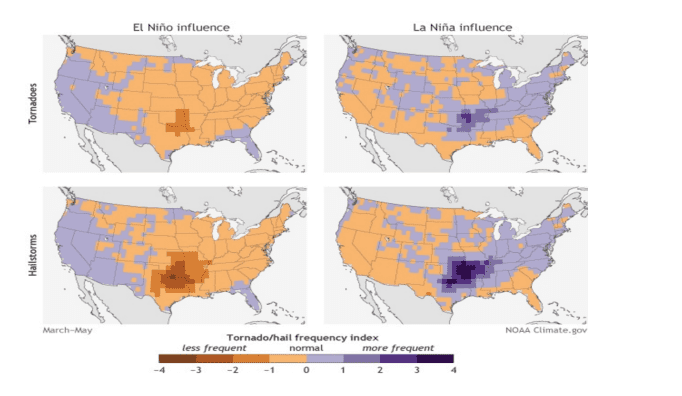
This graphic below shows what the tornado season is like during standard El Nino vs La Nina events. Notice that during an El Nino, tornado activity tends to be less frequent. The opposite is true during La Nina, when the “bulls-eye” (blue area) often moves from Tornado Alley into the Dixie Alley region.
The bottom line is that this spring’s tornado season could be one of the most severe in recent memory. The commodities most affected could be delayed corn and cotton planting in the deep south and potentially worsening drought conditions for livestock, wheat, corn, and cotton producers in Texas. This could already add to inflationary pressures for some commodities.
CLICK ABOVE TO RECEIVE FREE ISSUES OF OUR NEWSLETTERS
Last week the European Commission announced it will end Europe’s dependence on Russian oil, natural gas, and coal by 2027. In 2019, Russia provided 29% of the EU’s crude oil imports, 41% of its imported natural gas, and 47% of the EU’s imported coal. Net imports accounted for more than half of the EU’s energy needs.
Domestic crude oil, natural gas, and coal sources are limited within the EU. Some member states (i.e, Malta & Luxembourg) import up to 90% of their energy.
The EU is unlikely to simply switch supplying countries, thus leaving energy supplies outside their control again. However, European manufacturers and service suppliers must all contend with a new set of unknowns. A continuing conflict in Ukraine is bringing changes in supplies of components and raw materials. The war is impacting not only wheat supplies but also Europe’s supplies of computer chips. There are also potential costs in so quickly abandoning fossil fuels.
That said, what companies might benefit from this rapid push away from Russia and toward what must be a greener future?
Europe’s New Green Deal Firmly Back on Track (for Now)
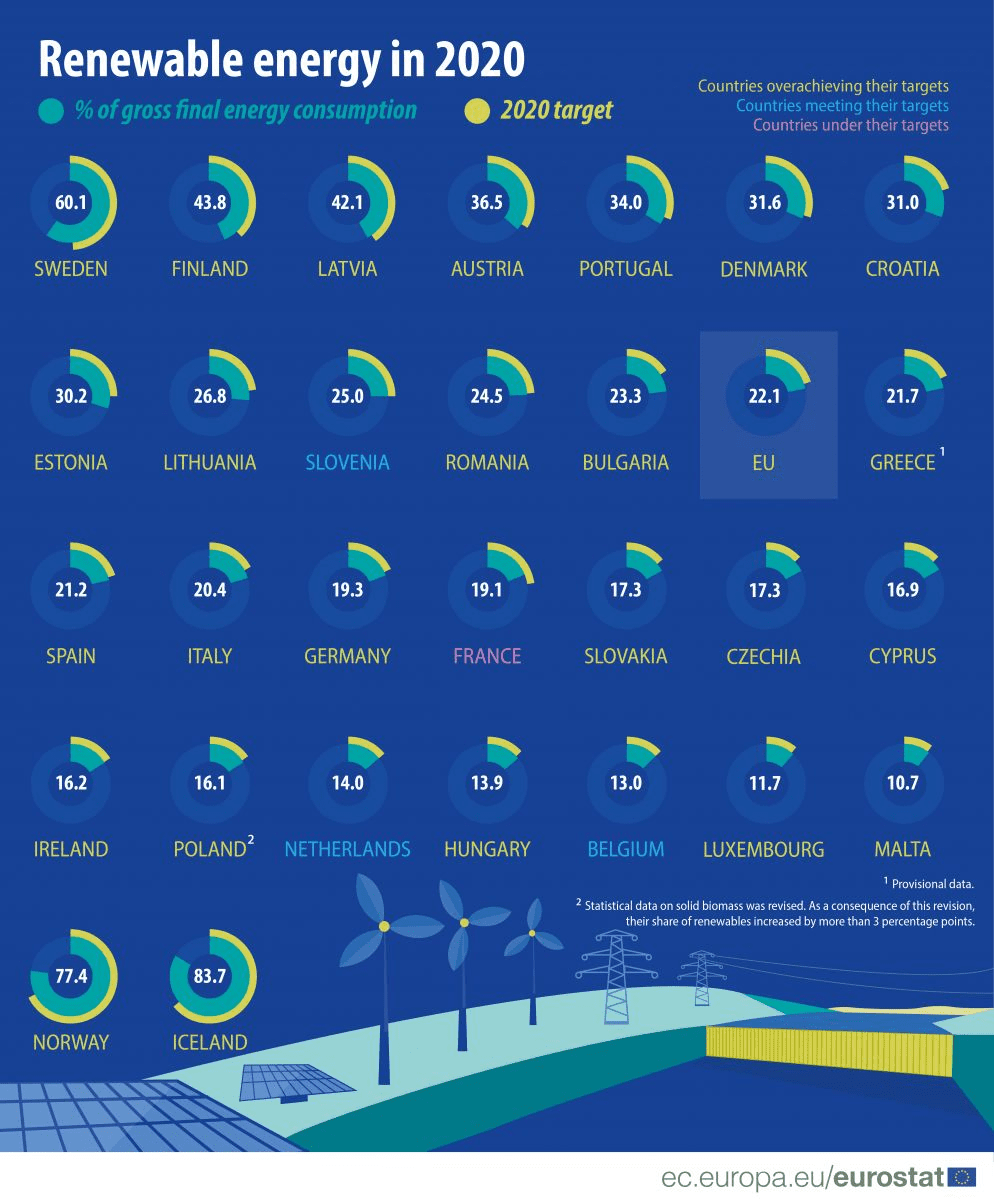
Renewables as percentage of energy by EU member country.
Friday, EU leaders agreed to spend the next two months drafting proposals for weaning Europe from dependency on Russian fossil fuels. Leaders set a deadline of 2027 to make Europe more energy independent. The replacement fuels will come from national and European sources, European Commission President Ursula von der Leyen said. EU climate policy chief, Frans Timmermans, stated that Europe could replace two-thirds Russian gas imports by the end of 2022
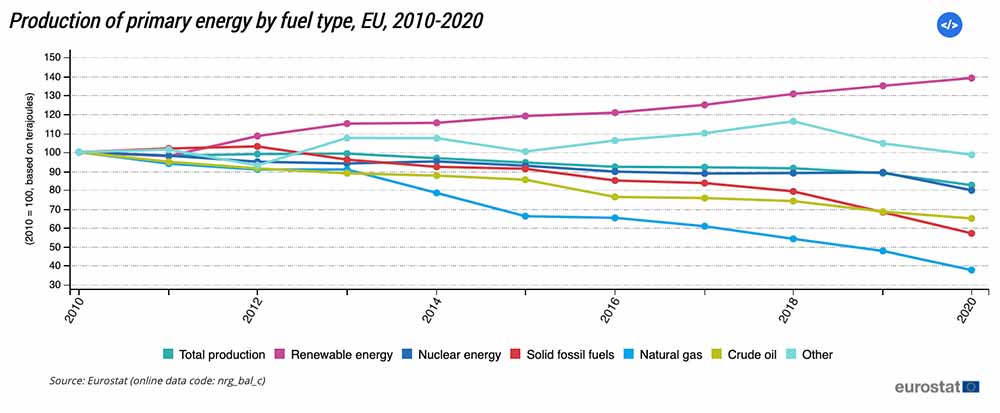
Coal and gas reserves vary wildly from country to country within the European Union. In 2020, EU production of primary energy was down by 17.7% from a decade before and 7.1% lower than in 2019. In the ten years up to 2020, European renewable energy use increased dramatically while uses of other sources declined. The EU’s recently agreed “Green New Deal” aims to make Europe carbon neutral by 2050. It included a €40bn fund to help coal-reliant regions, like Poland, move to cleaner alternatives
Primary energy production in Europe, 2010-2020.
In addition to emphasizing renewable energy, the Green New Deal also mandates a 20% reduction in agricultural fertilizer use. Russia’s invasion of Ukraine has helped send already high fertilizer prices soaring. Global fertilizer producer Yara recently reduced production at plants in Italy and France to 45% of capacity, citing rising gas prices. According to S&P Global Commodity Insights, Dutch natural gas prices have risen 1,100% from a year ago.
Which Companies May May Benefit From These Moves?
The EU’s Green New Deal focuses on transportation, energy production, agriculture sustainability, and improved energy efficiency in buildings. Some companies, like Baywa, work in several sectors that may see increased business because of Europe’s moves away from Russian energy reliance. Companies in energy production and transportation may be most likely to benefit quickly from the energy policy change.
Energy Production
Europe’s moves may not benefit nuclear power development, given rising concerns about potential accidents at Ukraine’s nuclear facilities. Energy companies that could benefit include Brookfield Renewable (NYSE: BEP; TSX: BEP.UN) and Spain’s Iberdrola (OTC: IBDRY), one of the world’s largest renewable energy producers.
Another company that may benefit is Switzerland’s Meyer Burger Technology AG (OTC: MYBUF), which has a focus on solar cells and photovoltaic equipment. Germany’s Baywa (ETR: BYW6) has a focus on agriculture, renewable energy, and construction, all sectors which will be impacted by Europe’s move away from imported fuels. Baywa’s agrovoltaic development center is already working with farmers on pilot projects.
Transportation
Companies providing goods and services to the public transportation sector and those with increasing production of electric vehicles have growth opportunities from this change. Alstom (EPA: ALO), the French company focused on rail infrastructure, recently acquired the rail division of Canada’s Bombardier. A renewed focus on public transportation could improve Alstom’s fortunes.
Many companies that produce electric vehicles already have long waitlists for their cars, SUVs, and trucks. Volkswagen (OTC: VWAGY) is increasing its electric vehicle production substantially in Europe, while also providing the technology for the seven new electric models that Ford (NYSE: F) will introduce in Europe by 2024.
Any of these stocks that might benefit from the EU’s decision to be independent of Russian energy will, of course, be subject to the whims of market movements. They also are dependent on the availability of raw materials and specific components. Battery improvement and production will underpin both energy and transport improvements.
Mercedes’s (OTC: DDAIF) corporate plan has been to produce only electric vehicles by 2030. To that end, the company has recently opened a battery plant in Alabama, while also taking an equity stake in European battery cell manufacturer Automotive Cells Company. Mercedes is partnering with Total Energy and Stellanis (NYSE: STLA), owner of Peugeot, in that venture.
Over the last 40 years, China’s sea levels have risen faster than the global average. In December, Premier Xi Jinping declared that the production of staples such as rice was a natural security issue.
China’s coastline is facing rising tides, so 2021’s production of 4.6 metric tons of “seawater rice” per acre must have pleased Chinese leaders. Earlier, China’s Minister of Agriculture had pronounced that the country would stabilize corn production and expand soybean production in 2022. After trade disruptions due to COVID, domestic agriculture production has a renewed policy focus in China.
A Surfeit of People, a Lack of Arable Land
China is home to around 20% of the world’s population but has only about 7% of the globe’s arable land. Crop-growing land in the country (currently around 120 million hectares) decreased by about 6% between 2009 and 2019. This was due to pollution and urbanization. Around 100 million hectares of China’s land are unusable due to salinity and alkaline issues. Chinese agronomists hope to turn 6-7 million of those hectares into “seawater rice” producing land by the end of the next decade. While not meeting China’s average of 6.5 tons of rice production per hectare, it would still boost domestic food supplies.
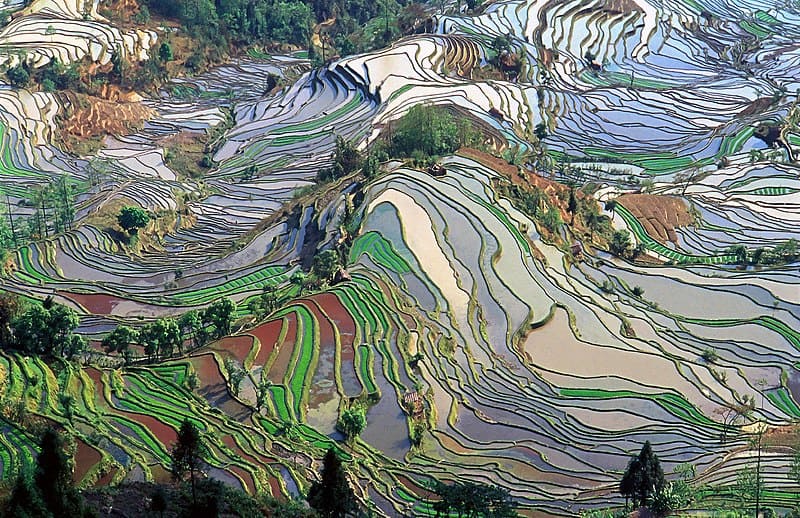
Terraced Rice fields in Yunan, China. Photo courtesy of Jialiang Gao, www.peace-on-earth.org.
Will Seawater Rice Impact Chinese Imports Soon?
With seawater rice growing in its early stages, Chinese imports of rice boomed in January-August 2021, with a record 3.2 million tons of rice imported. Half of this was broken rice, which is used for feed, snack, and liquor production.
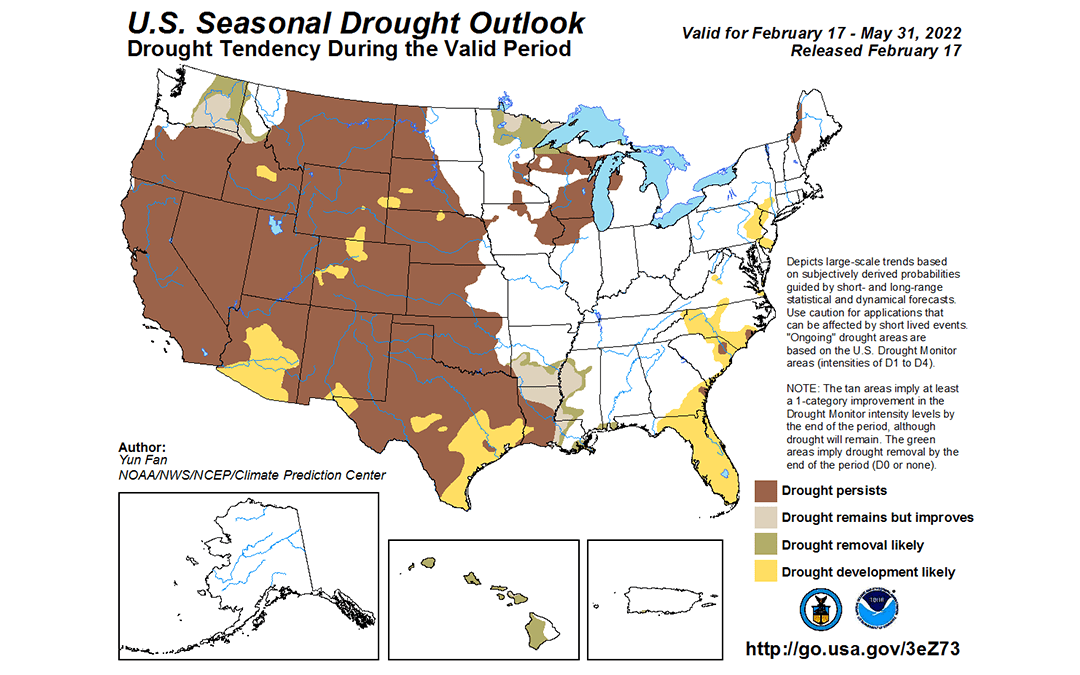
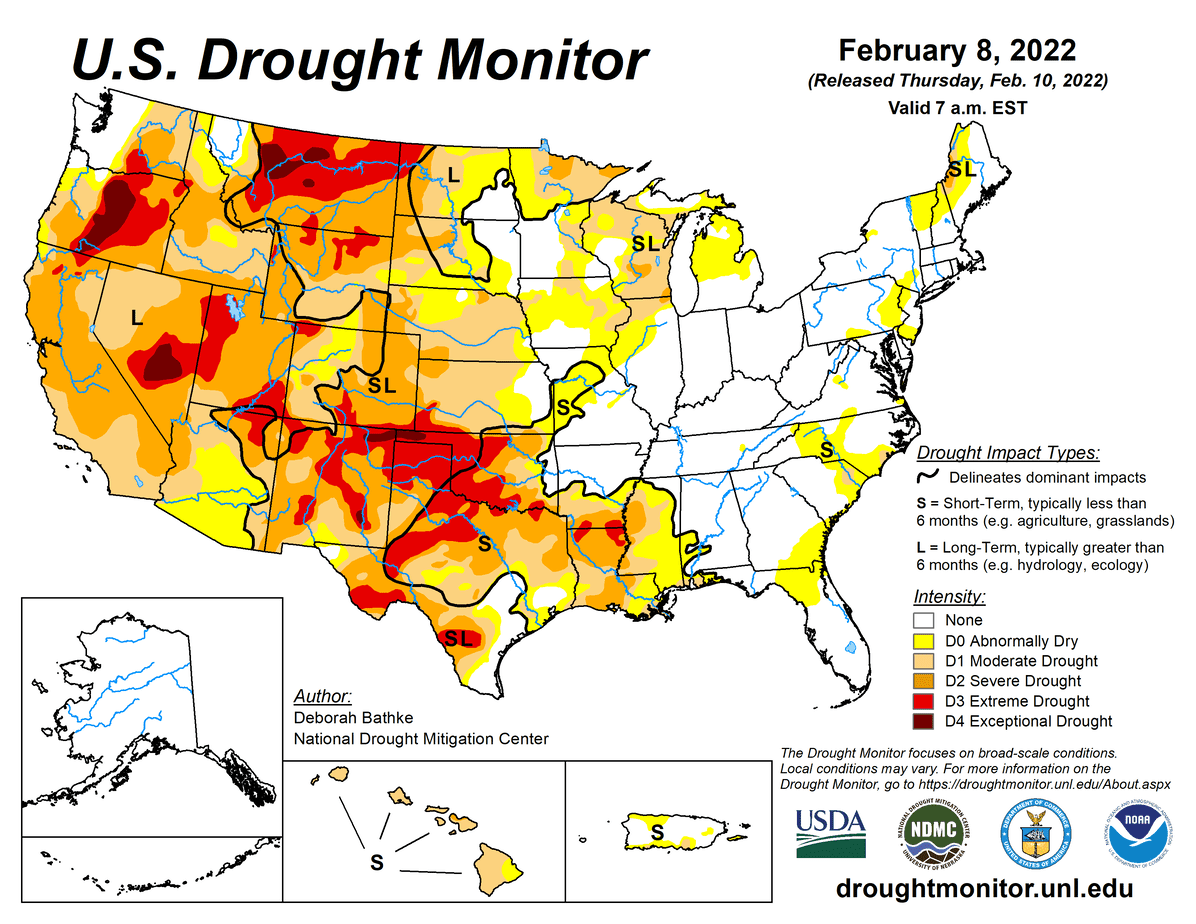
A drought in the western United States looks likely to continue through May, according to the outlook from the U.S. Drought Monitor. As of February 15, 2022, abnormally dry or drought conditions exist in 57% of the lower 48 states.
Researchers found that the 22 year drought period between 2000 and 2021 was the driest since 800 C.E., according to a study published this week at Nature.com. Anthropogenic (human-made) climate trends accounted for 42% of the southwestern North America soil moisture decrease in 2000–2021.
La Nina conditions have impacted snowfalls in the Canadian and U.S. Rocky Mountains and there are already concerns over water for irrigation and other needs in California, Colorado, and other areas. The Bureau of Reclamation’s February forecast predicts that the April-July runoff for the North Platte project will be only 80% of the 30-year average. As a result, the Bureau does not expect water allocations to be released to its contractors. The North Platte project feeds full irrigation to 226,000 acres and provides supplemental irrigation to 109,000 acres in Wyoming and Nebraska.
This week’s drought map for the United States.
How Could this Mega Drought Impact Crops?
Over 70% of the winter wheat-producing areas in Kansas, Texas, and Oklahoma are in drought conditions. Meanwhile, Eastern Europe also is experiencing relatively low precipitation. Wheat comes out of dormancy in the spring and moisture is key, so continuing dryness could impact the wheat market. As seen in the map below, dry conditions also have plagued the Canadian plains for the last month.
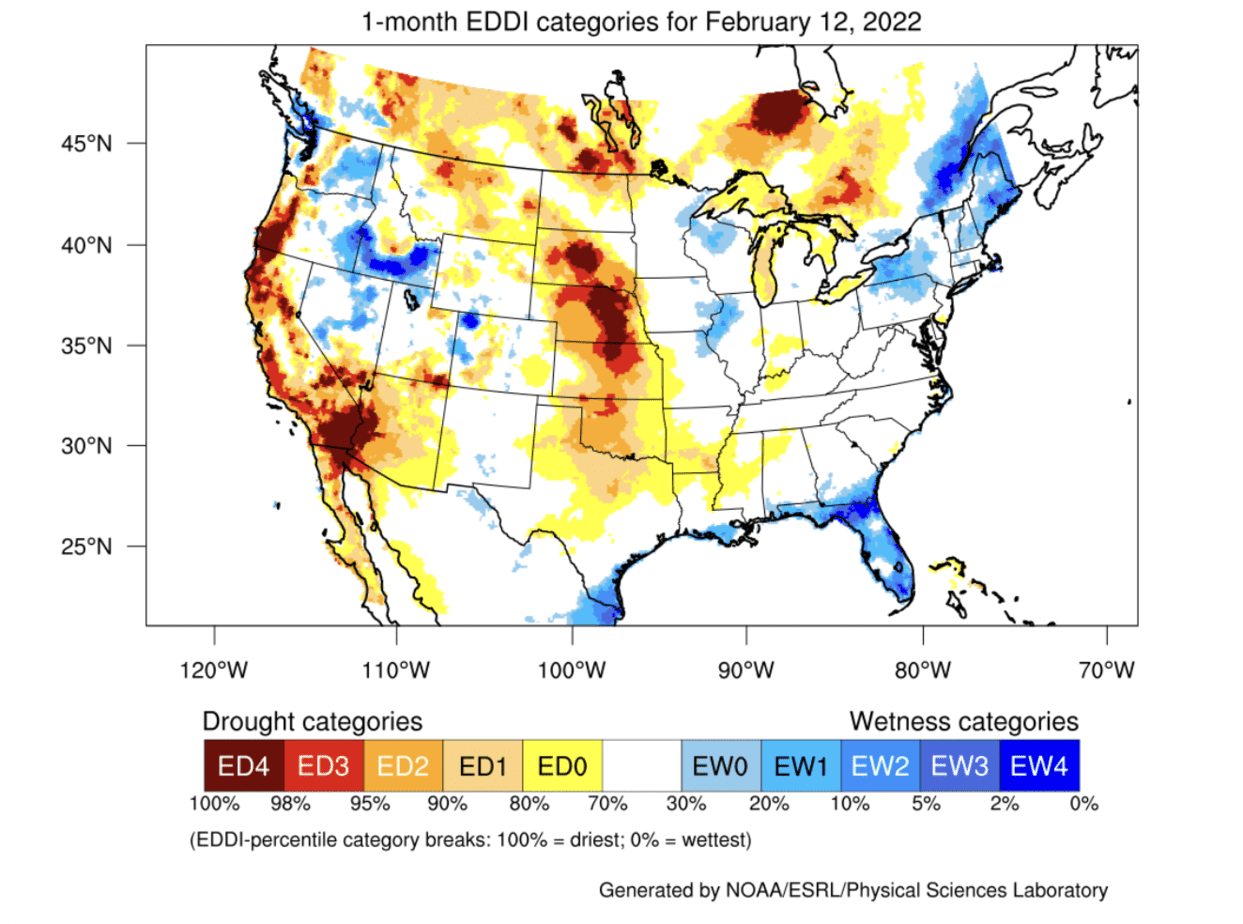
What happens in weather in April through June in the West and Midwest is important for corn and soybeans, too. Planting on the Plains starts as early as mid-April. Drought conditions in Argentina and Brazil have pushed soybean prices higher recently. Is a repeat in store for the U.S. crop?
Evaporative Demand Drought Index for the last month from NOAA. An ED4 category signifies that similar conditions are expected in only 2% of this time period.
HELPING YOU MAKE THE BEST INVESTMENT DECISIONS BASED ON THE WEATHER
We use cookies to ensure that we give you the best experience on our website. If you continue to use this site we will assume that you are happy with it.OkPrivacy policy