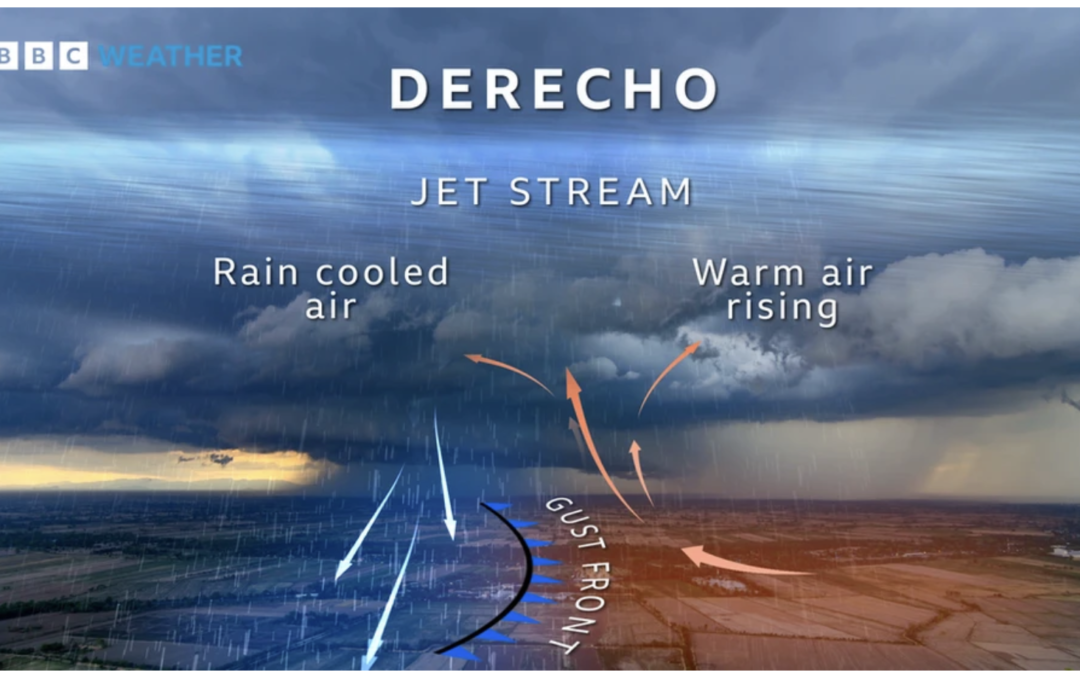
A derecho starts life as a thunderstorm, or cluster of thunderstorms. If conditions are right and there is plenty of warm, humid air at the surface, combined with a strong, straight jet stream, the storm can build into a towering system.
Warm currents of rising air combine with downdrafts of colder, rain-bearing air. These spill out of the bottom of the cloud and spread out horizontally, creating strong bursts of wind. This forces warm air at the surface upwards, creating a “gust front”.
While some minor damage could occur to some Midwest, corn, soybeans and interfere with the soft-red wheat harvest. The odds are low that the important July pollination month for Midwestern corn will see any extensive hot, dry weather. The reason? While El Niño just formed and is weak to start, it may act more like a “strong El Niño”, which rarely results in July Midwest droughts.
Click here to download our FREE Climatelligence Substack App.We will be offering soon a very inexpensive new, commodity-weather service.
See the video regarding two potential Derechos over the next week
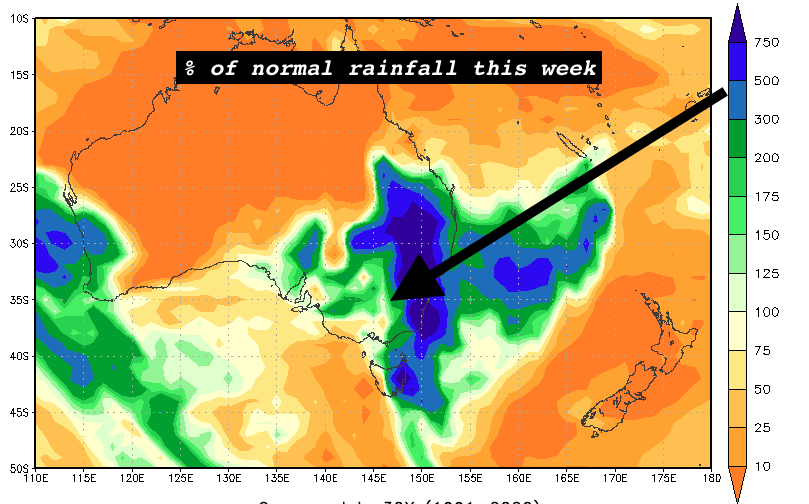
The first effects of a developing El Niño: Drought breaking in Texas and the deep south, with flooding in some areas
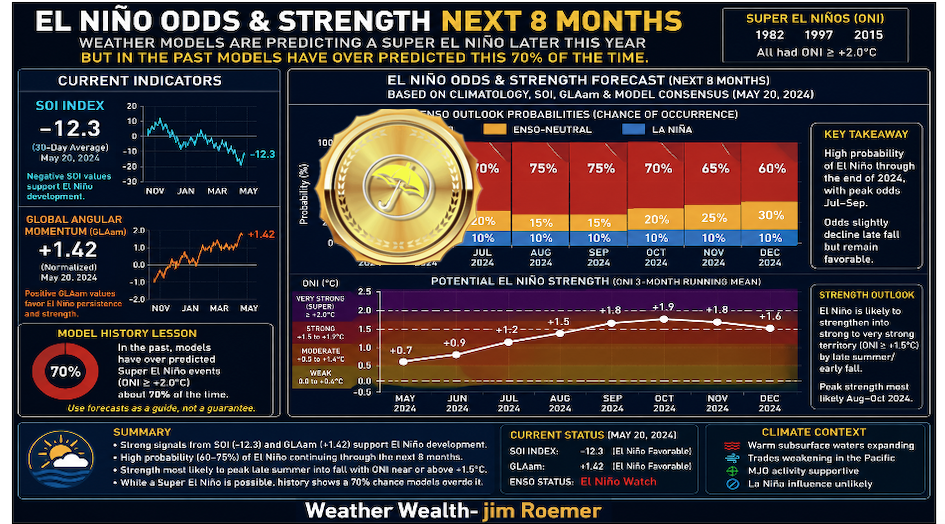
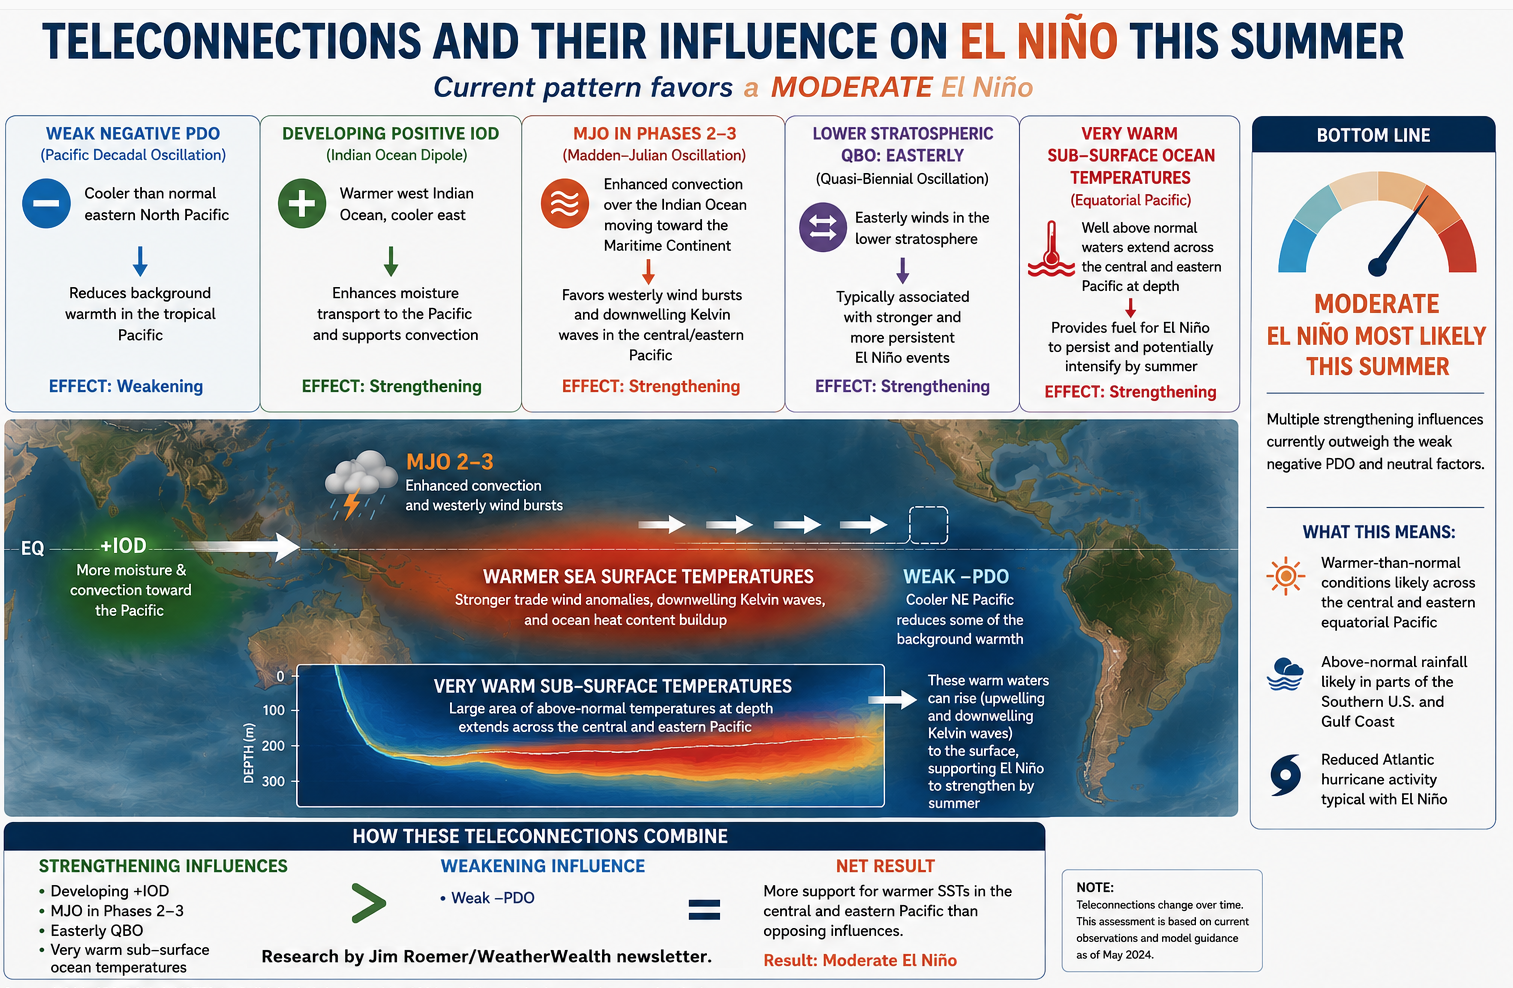
Various teleconnections can affect the strength and size of El Niño
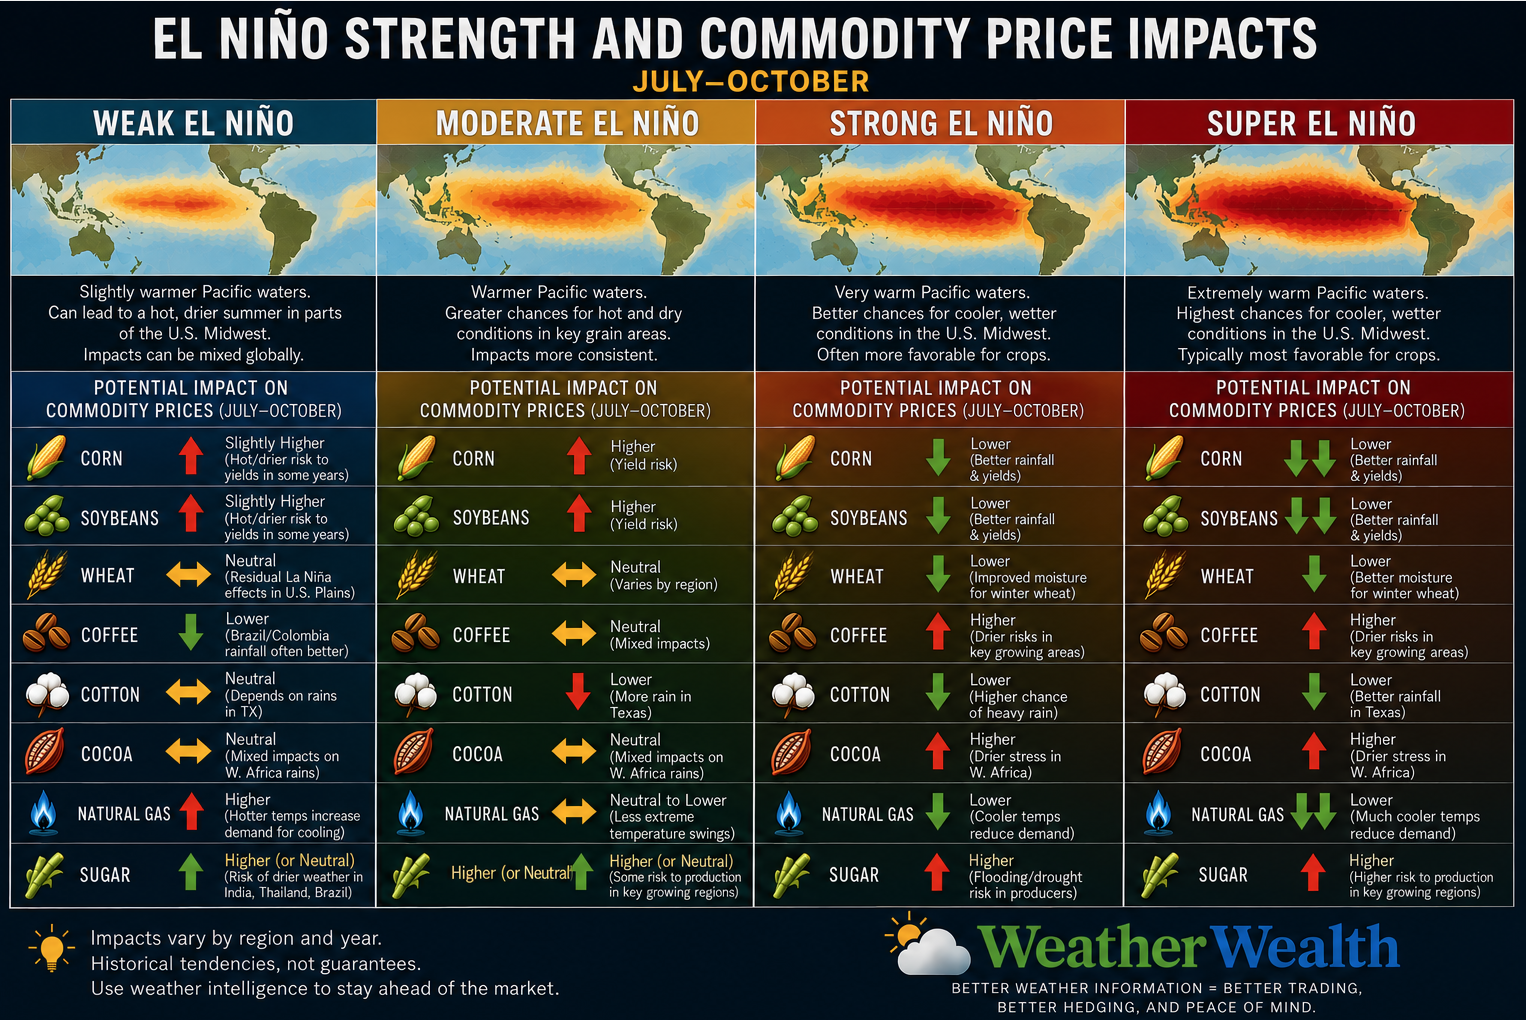
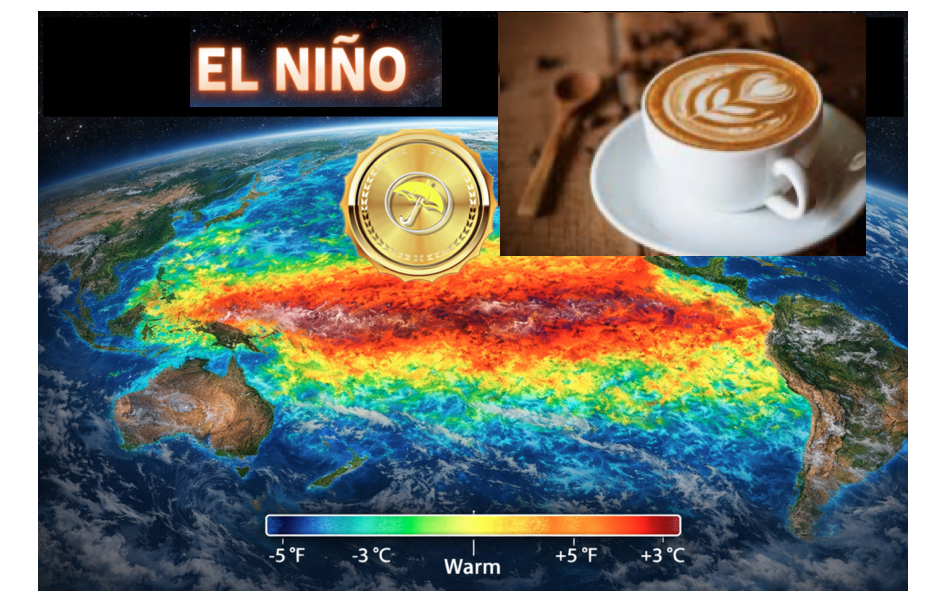
A general view of El Niño and commodity market impacts
Recent Trade Ideas
Click on the image
Video about El Niño
This video does not give any specific trade ideas, but discusses how El Niño forms and why some forecasters are predicting a ” Super El Niño.”
The verdict is still out, however, and I will be doing research on this in the coming weeks and months.
The effects of lower crude oil prices and a potential end to the Iran War will greatly affect commodity prices early this week. The stock market made new highs. However, Iran has not agreed 100% to a deal.
CLICK ON MY VIDEO ABOVE
The first effects of a developing El Nino? Flooding rains and drought breaking in the deep southern U.S.
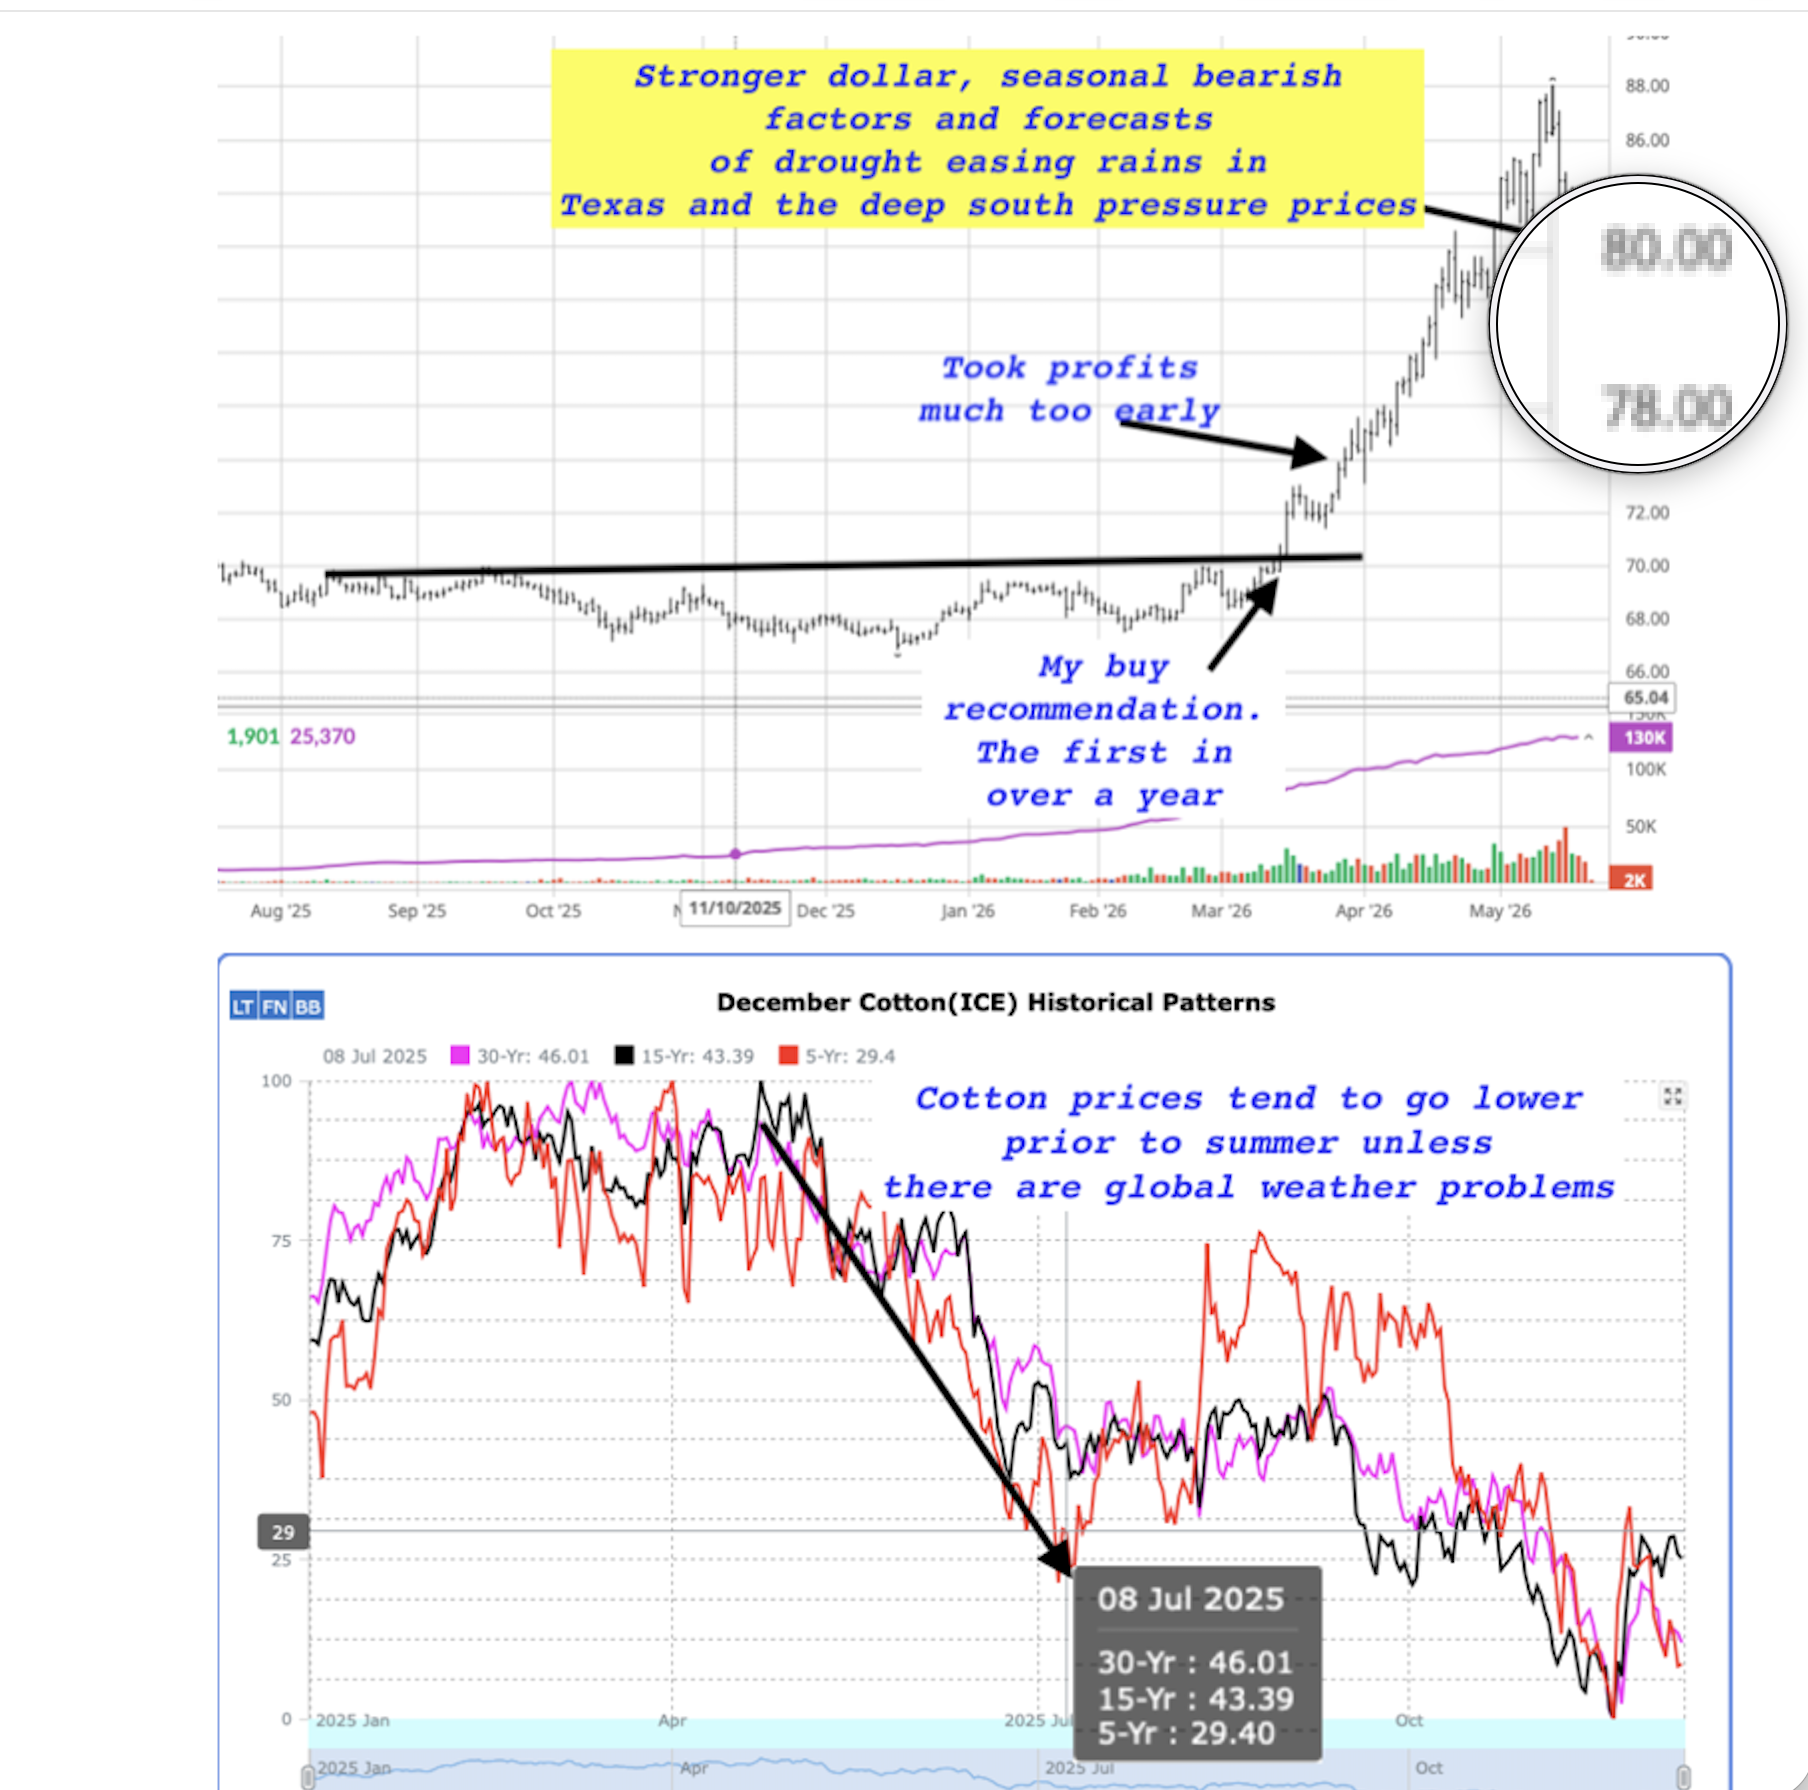
U.S. cotton drought to break
I mentioned some 400 points higher than this, that I was bearish on cotton as I saw the drought ease for key Texas and Delta cotton growing areas. This is typical of a developing El Niño. However, I am not sure of some flooding in the deep south could eventually rally cotton prices back, as well as strong demand. Otherwise, we had a clear break below support last week prior to my spider going bearish.
I mentioned this a week ago and cotton prices have collapsed
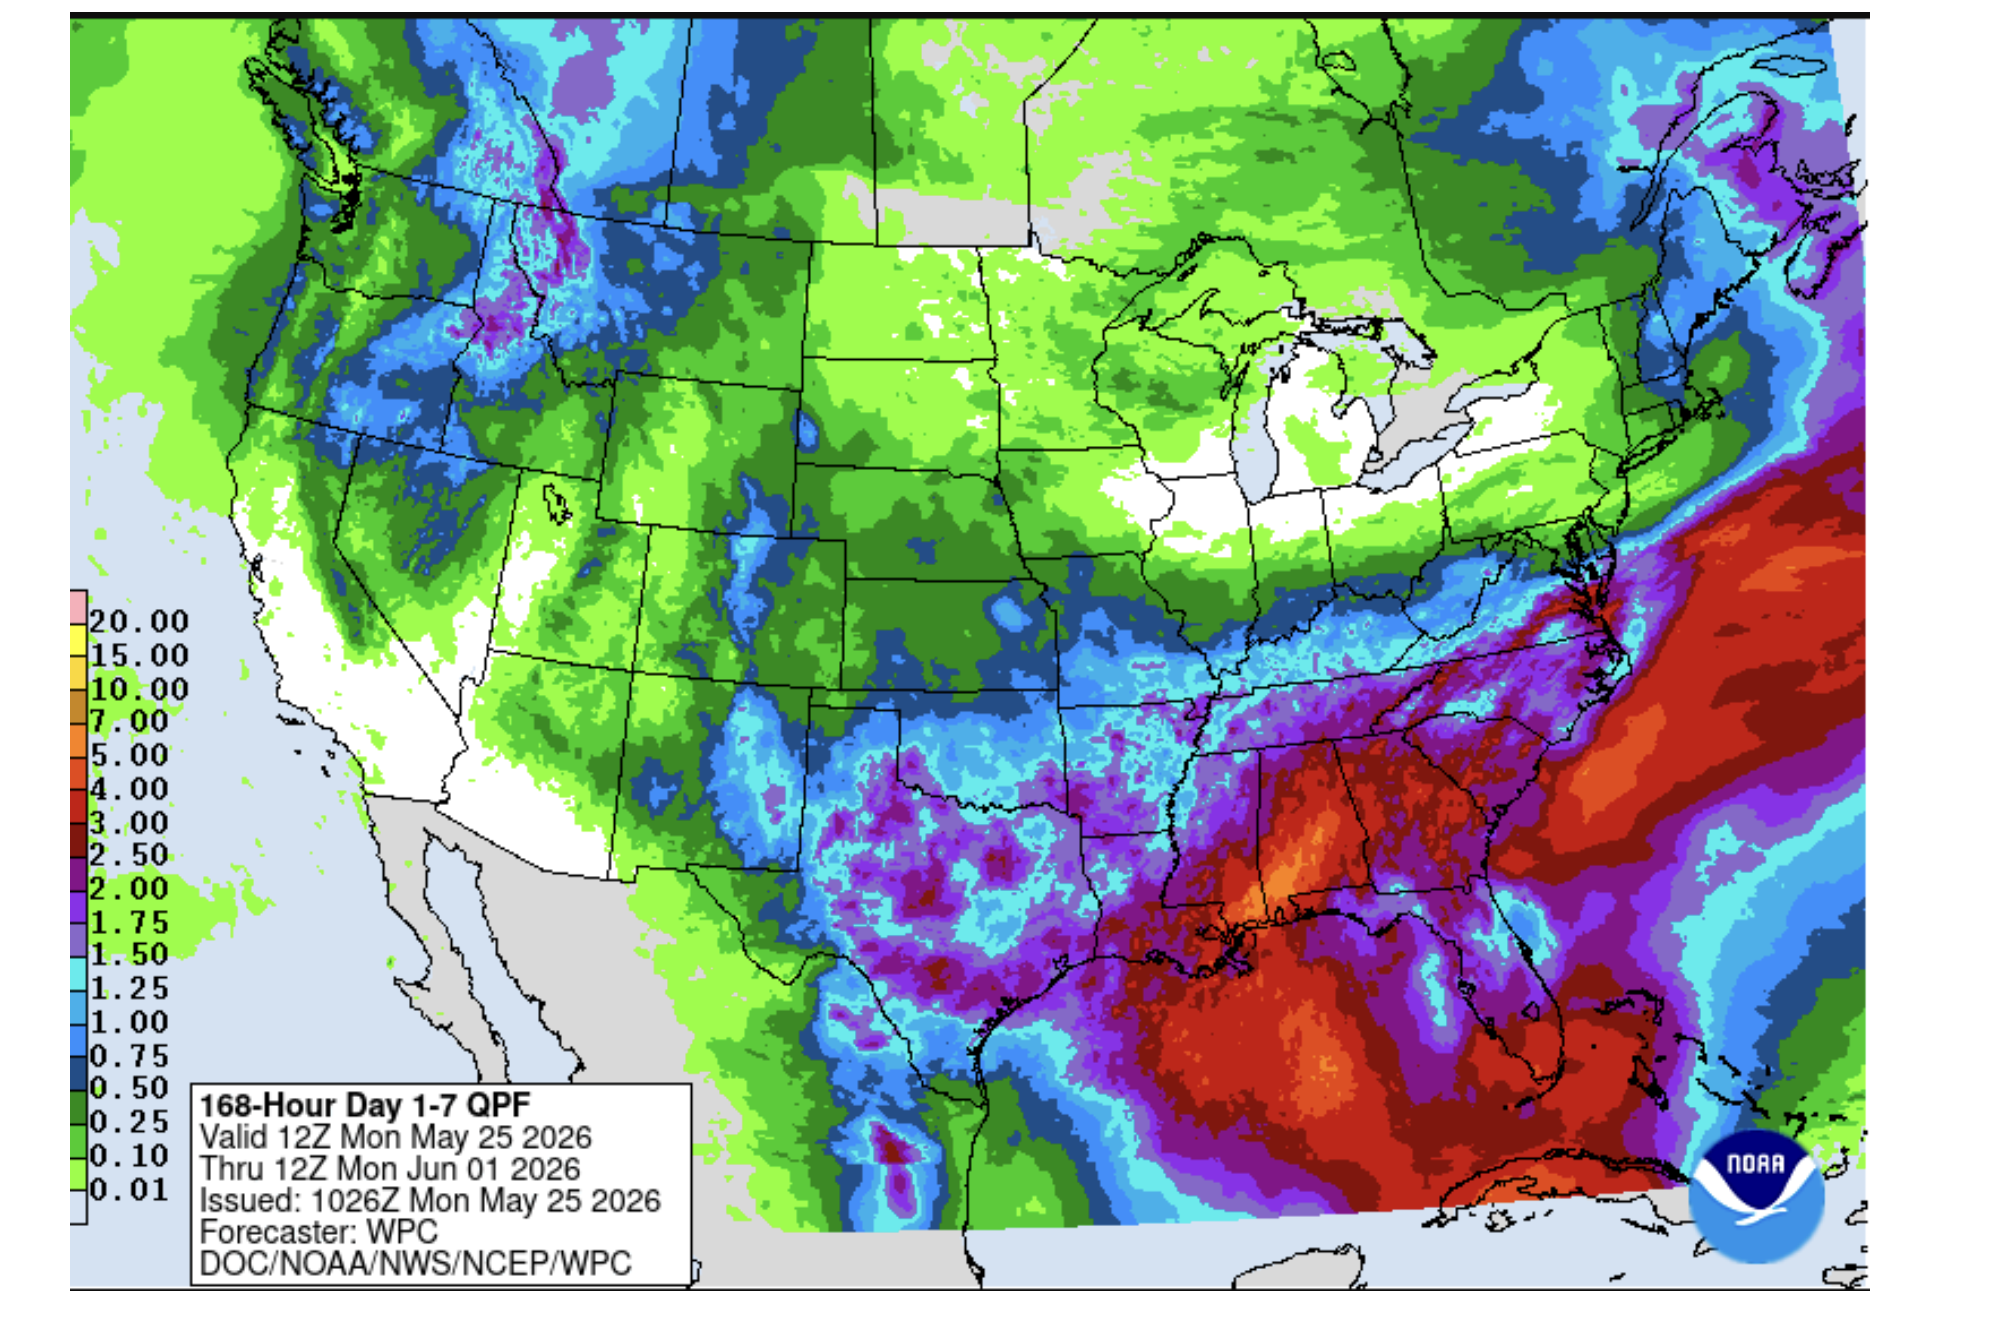
Flooding in the deep south may interfere with the early wheat harvest and some soybean planting
Notice rainfall this week could exceed 3-5″ in the deep south, including Texas. While seasonally, wheat prices go lower into harvest and much of the severe Plains (post-La Nina) drought may have been factored into wheat prices, these heavy rains might cause wheat prices to rally at some point.
In other words, some potential early wheat harvesting concerns and quality problems from too much rain in some areas. The wheat market is a bit confusing because global crop weather in Europe, Australia, and Russia is generally improving.
Rainfall in inches this week: Typical of a developing El Niño and too late to help the Plains wheat crop. This rain could cause some pre-harvest concerns for wheat in the Deep South and prevent prices from falling much further.
Improving the weather for Australian grain areas for planting
Look how models changed for very important rains for key Australian grain areas this week and possibly as we head deeper into June. I mentioned this two weeks ago. A weak El Niño this time of the year with a positive Indian Dipole usually brings better late May and June rainfall patterns for Australia. However, a strong El Niño later this year will likely cause some problems
Various teleconnections can affect the strength and size of El Niño
While Greek to many of you, it is not just Sea Surface Temperatures in the Pacific that influence El Niño, but some of these teleconnections. I will discuss this more in the days and weeks ahead.
Right now, by the North American summer, a moderate El Niño is likely, in my opinion. Will it be “Super” by the fall? Stay tuned
A general view of El Niño and commodity market impacts
You can print the table I created below.
This table is not set in stone. However, I pride myself on being able to “second-guess weather models and understand the psychology of commodity trading.”
Currently, I am trying to gauge the psychology of traders focusing on El Niño versus current global crop conditions.
For example, while there are no immediate major problems for sugar production areas, sugar prices have rallied 5-10% the last few weeks on a “what if ” situation of El Niño and the rally in crude oil prices. I would expect that sugar prices may slide a bit, given lower crude prices currently, until more is known about the 2026-27 crops.
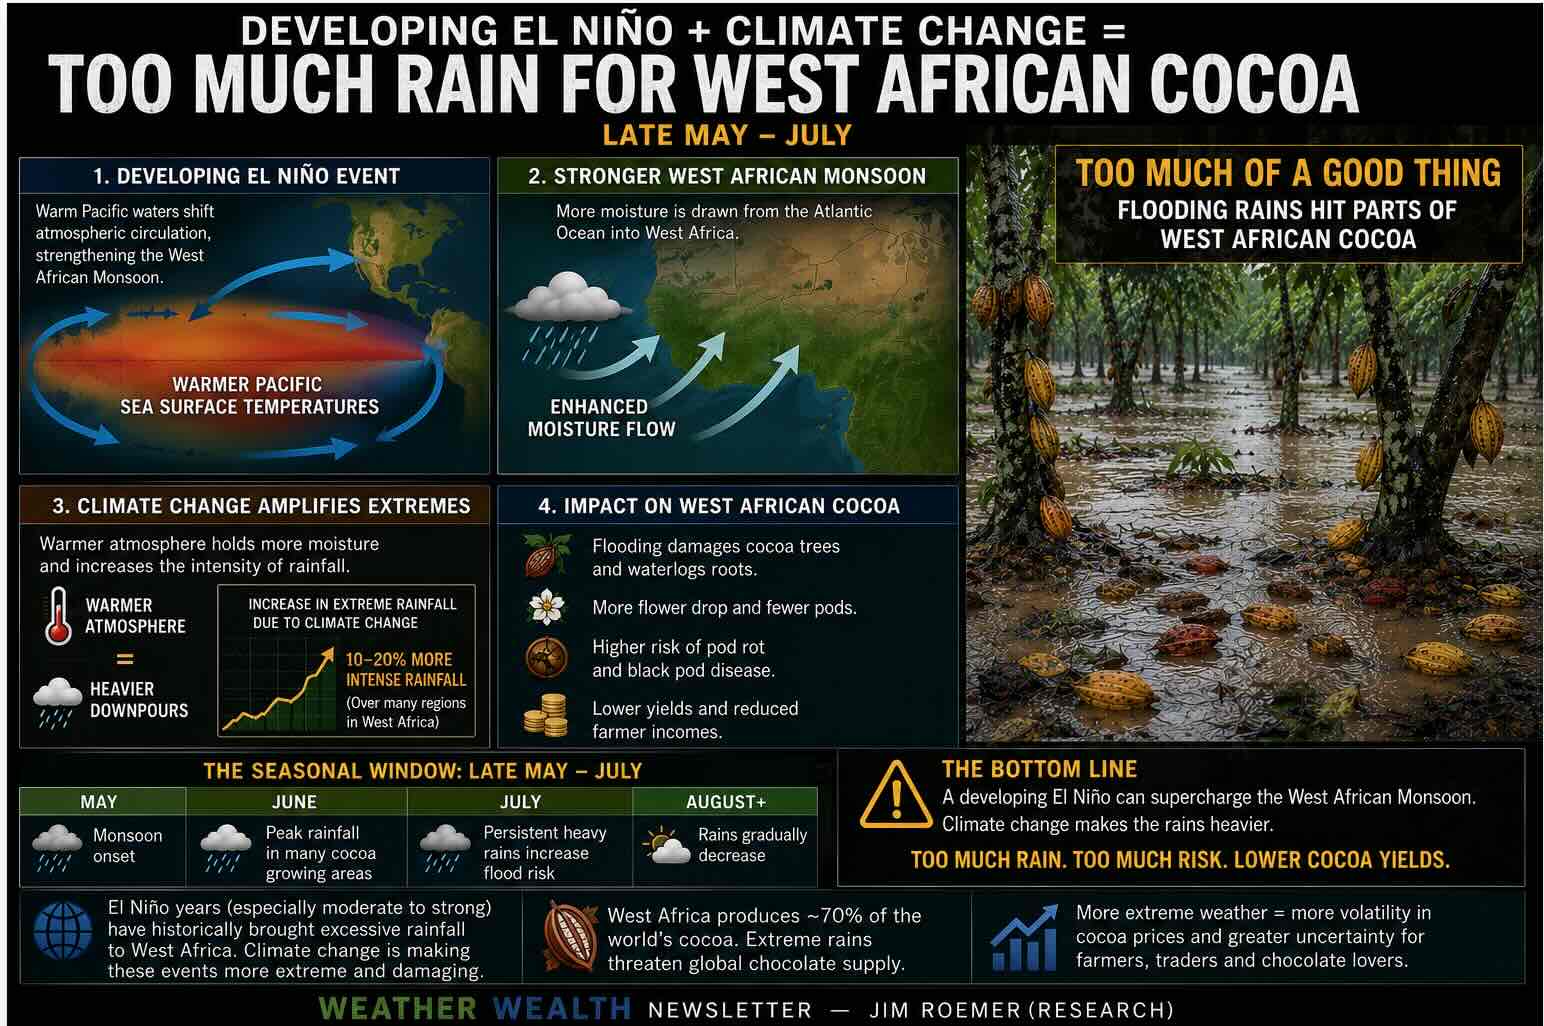
Another example is cocoa. Three weeks ago, I put out a buy recommendation in cocoa based on the “psychology” of El Niño coming. My timing was perfect as we rallied 20% in less than a week. Near the highs around $4500, I immediately said, “Take profits if you were long.” The reason, late May and June weather conditions are improving for West Africa. I do not know how low prices may go as we had a heck of a sell-off, but I want to see “actual” weather problems develop for West African cocoa crops before recommending any new high-confidence buy. It is possible that heavy rains in West Africa may be too much of a good thing and cause some crop concerns. I am cautiously bullish again cocoa longer term.
Screenshot
If El Niño becomes strong by July, ideal pollinating weather for corn will ensue and new crop December corn will fall below $4.00. Right now, the U.S. corn crop is in pretty good condition, and I will be monitoring dryness in the far north and western belt. If El Niño is weak to moderate, some potential Midwest heat and dryness could develop later in June and July. Stay tuned.
La Niña events usually create the greatest bull markets in wheat, but there are exceptions. Several strong El Niño events created major global crop problems in Australia, Argentina and China. For now, while wheat prices are falling on less Iran war tensions and harvest pressure coming up, some dryness and heat in Western Europe, combined with too much rain in the deep southern U.S. is typical of a developing El Niño. Some (not all) El Niño events can bring too much rain for the U.S. wheat harvest. The result may still be sideways, confusing action for the wheat market for now. I would not press the short side of the wheat market on the recent 20-30¢ sell off.
There has been talk about lower Brazilian coffee production and El Niño. However, this would NOT be until later this year. A strong El Niño would end the bear market I predicted in coffee from last August to October. Coffee prices have fallen 30% since my bearish recommendations.
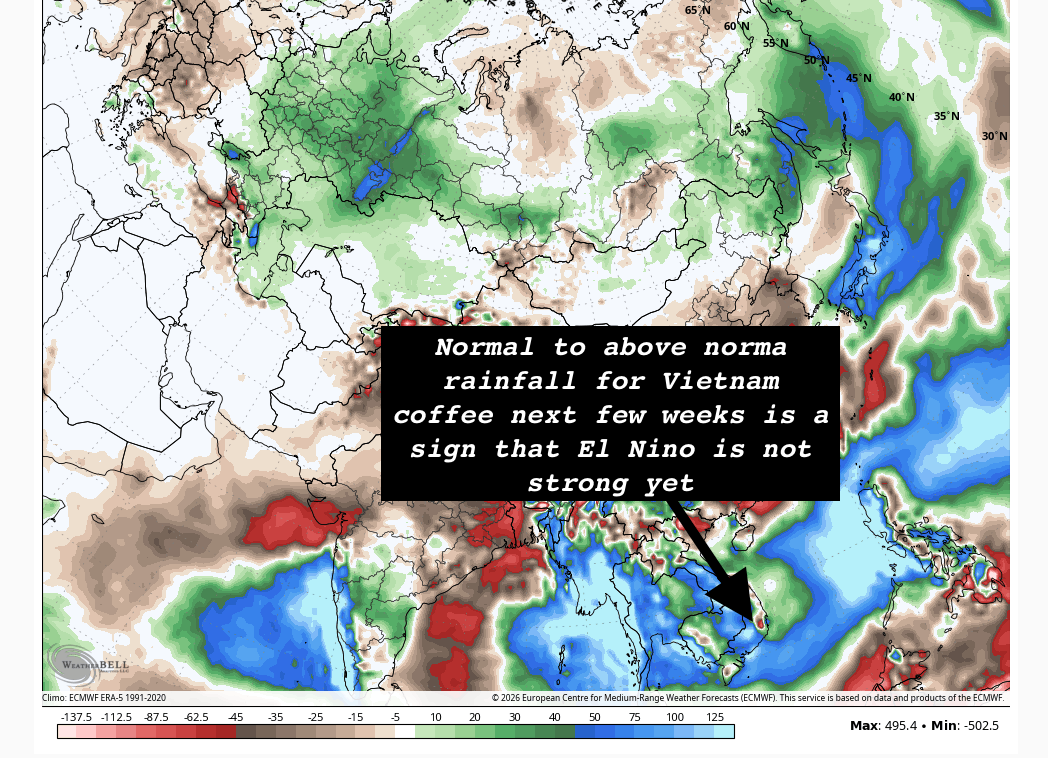
There is chatter that the Vietnam coffee crop is being hurt by dry weather–often a sign of El Niño. However, I think it is too early to write off the Vietnamese coffee crop. Usually, El Niño has to be strong to greatly reduce the Vietnam crop. That may not happen till later on this year.
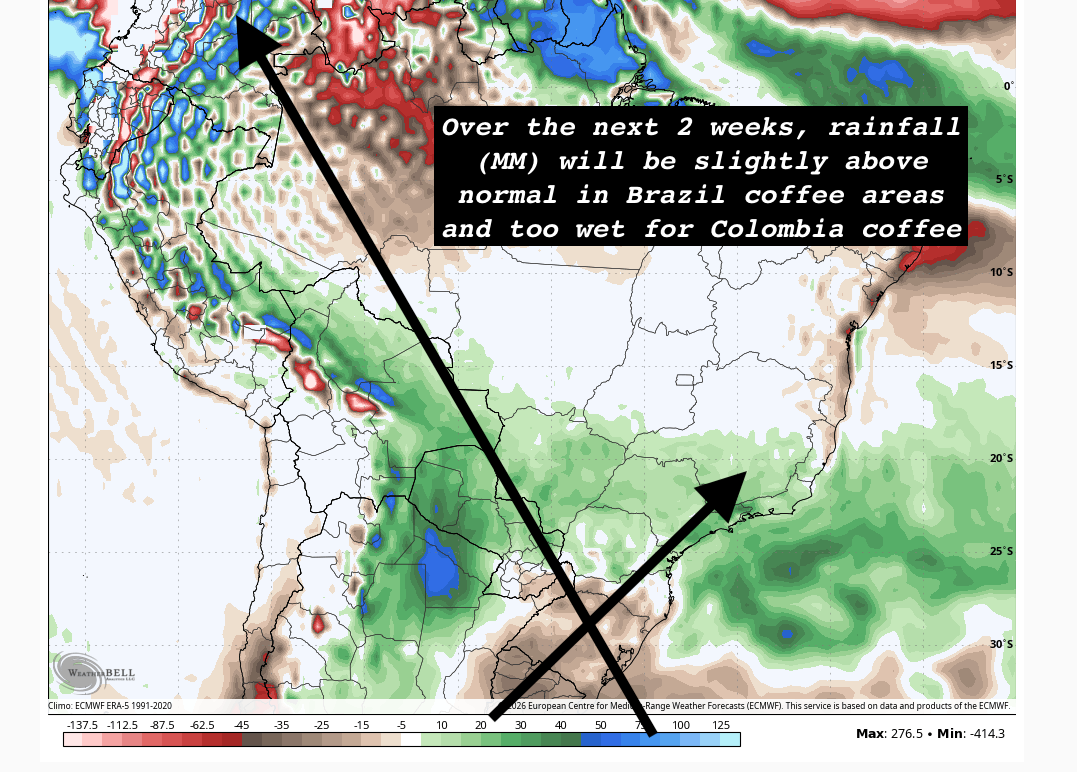
My main concern about the global coffee market is a lower Colombian crop. Usually, this time of the year, El Niño reduces potential crop problems for Colombia cofffee. However, that is not happening. It may be too wet. Hence, I am confused for the moment what to think about the coffee market and had clients take more nice profits again early last week in short positions (mostly long put options or short call options for months).
All detailed trading advice is available at least twice a week with a subscription to WeatherWealth
The short answer regarding El Niño is no! El Niño has not officially formed yet and will not be a factor for months.
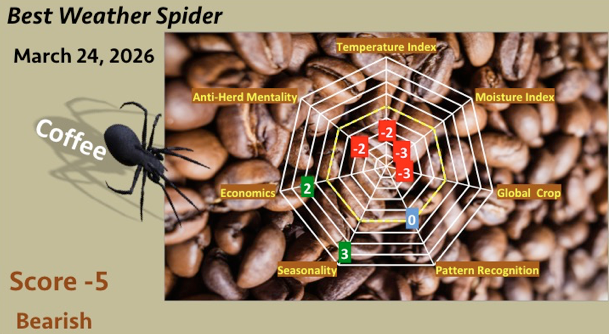
The coffee market did not rally because of dry weather in northern Brazil. In fact drier weather is beneficial for the upcoming Brazil harvest. They do not want rain; way too late to help the crop.
More than 6 months ago I put out a very bearish (-8) Weather Spider score and coffee prices collapsed from $3.50 to $2.80 a few weeks ago. This was because of the weakening La Niña event I predicted last fall and that usually “excellent summer (Brazil) weather”.
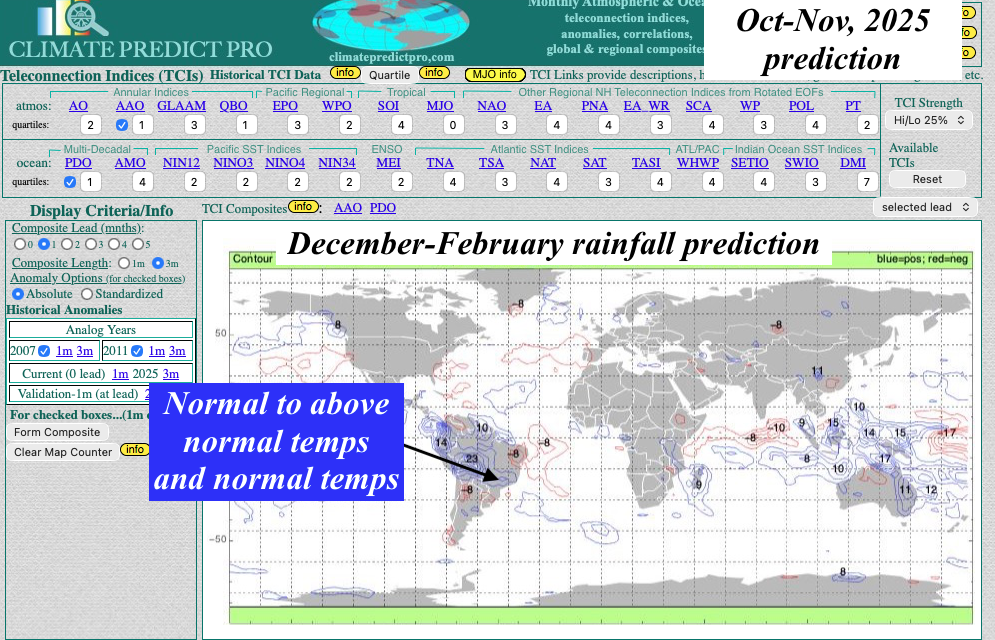
Notice my prediction last October of normal-to-above-normal rainfall for Brazil’s coffee from November-January greatly helping out this next year’s crop and easing most of previous drought.
My Weather Spider was scaled back a couple of weeks ago from very bearish to bearish due to the factors I mention, below. So why did prices rally sharply earlier this week? For one thing, the Strait of Hormuz being shut down restricted exports from Southeast Asia in mainly the cheaper variety Robusta coffee. This, plus the stronger Brazilian Real the market to rally. Remember the big crop does not hit the market till later in May and June.
However, it is way too early to talk about El Niño and if there will be crop problems to global coffee this year. Currently we are in an El Niño neutral phase with generally good global weather. This trend should weaken the wet weather aggravation that the world’s #2 coffee producer (Colombia) has recently.
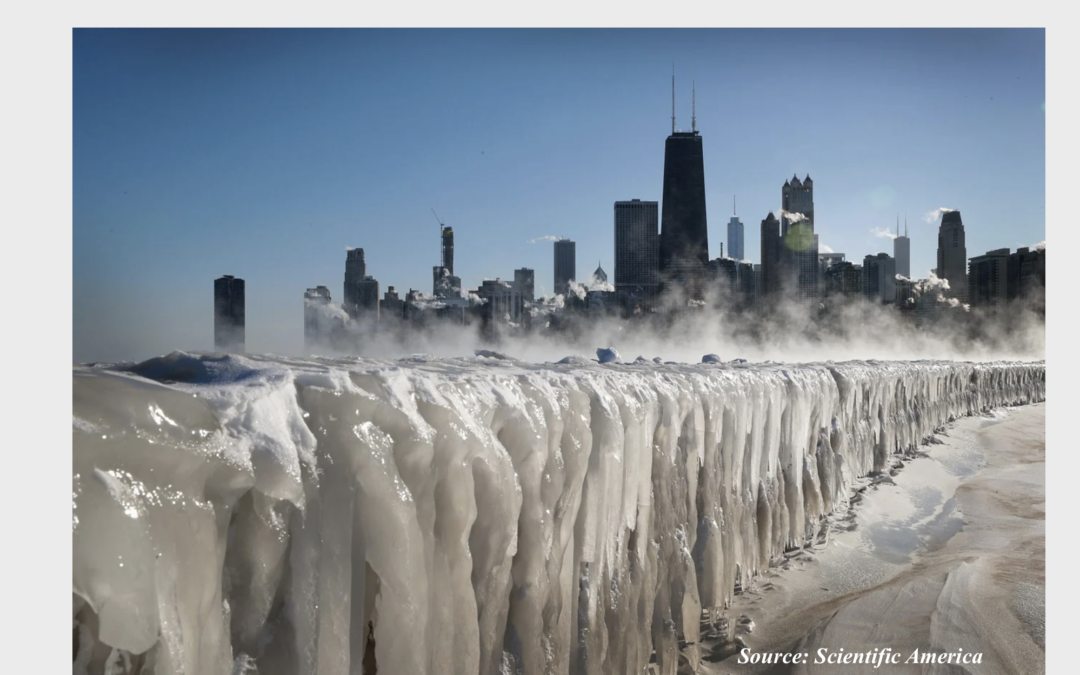
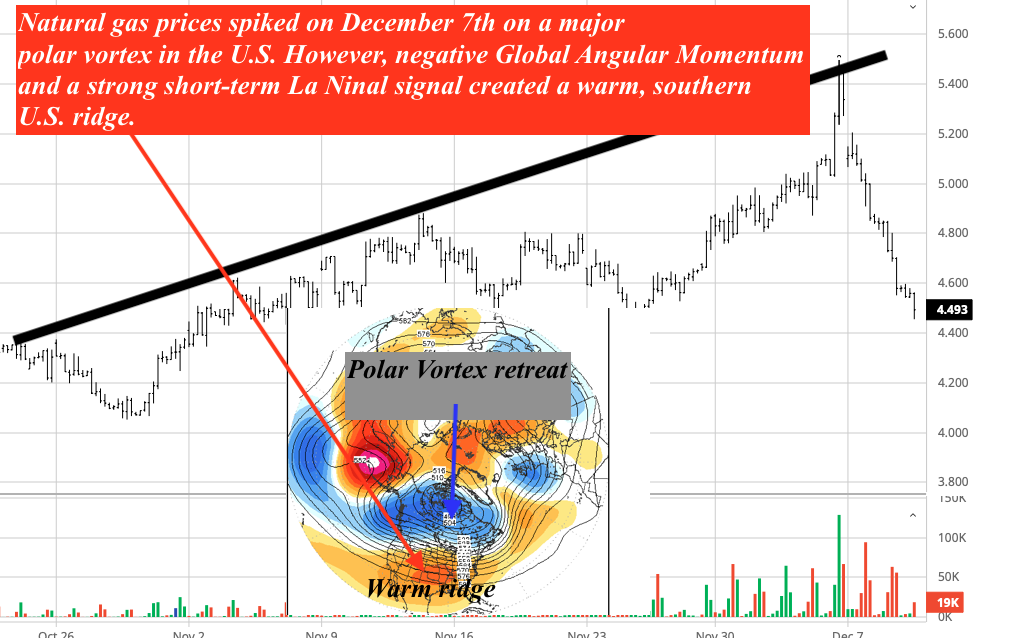
1)How stratospheric warming helped natural gas prices surge over $5.00 in early December, only to come crashing down on the warmer late month outlook. That warming aloft will begin to weaken.
2)What is a -WPO and -NAO index? It will bring much colder weather to Europe and perhaps New England as we head towards the end of the month, However, since the negative NAO will be more eased based, that would favor Europe seeing more consistent snows into January rather than much of the central and eastern U.S.
3)How a +EPO index (cold pool near Alaska) and strong western U.S. troughs (-PNA) will offset a potential cold January weather pattern for the U.S. This means that most U.S. natural gas areas will be warmer than normal.
4)How strong vs weak La Niña events affect the weather in January
Following some free reports about weather and commodities here on Substack
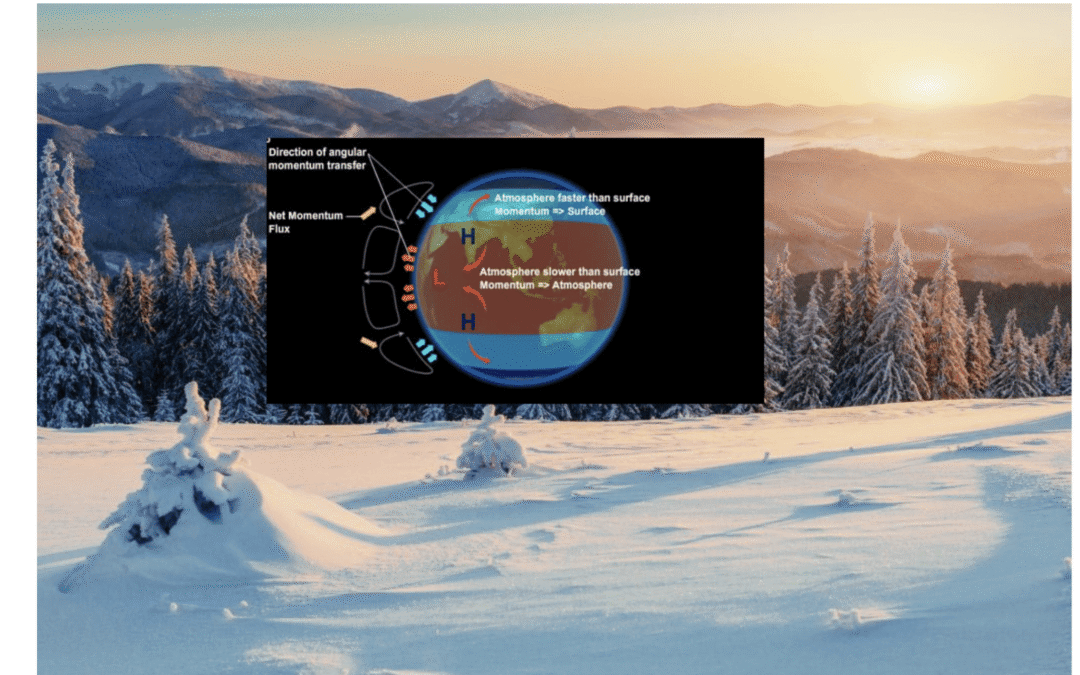
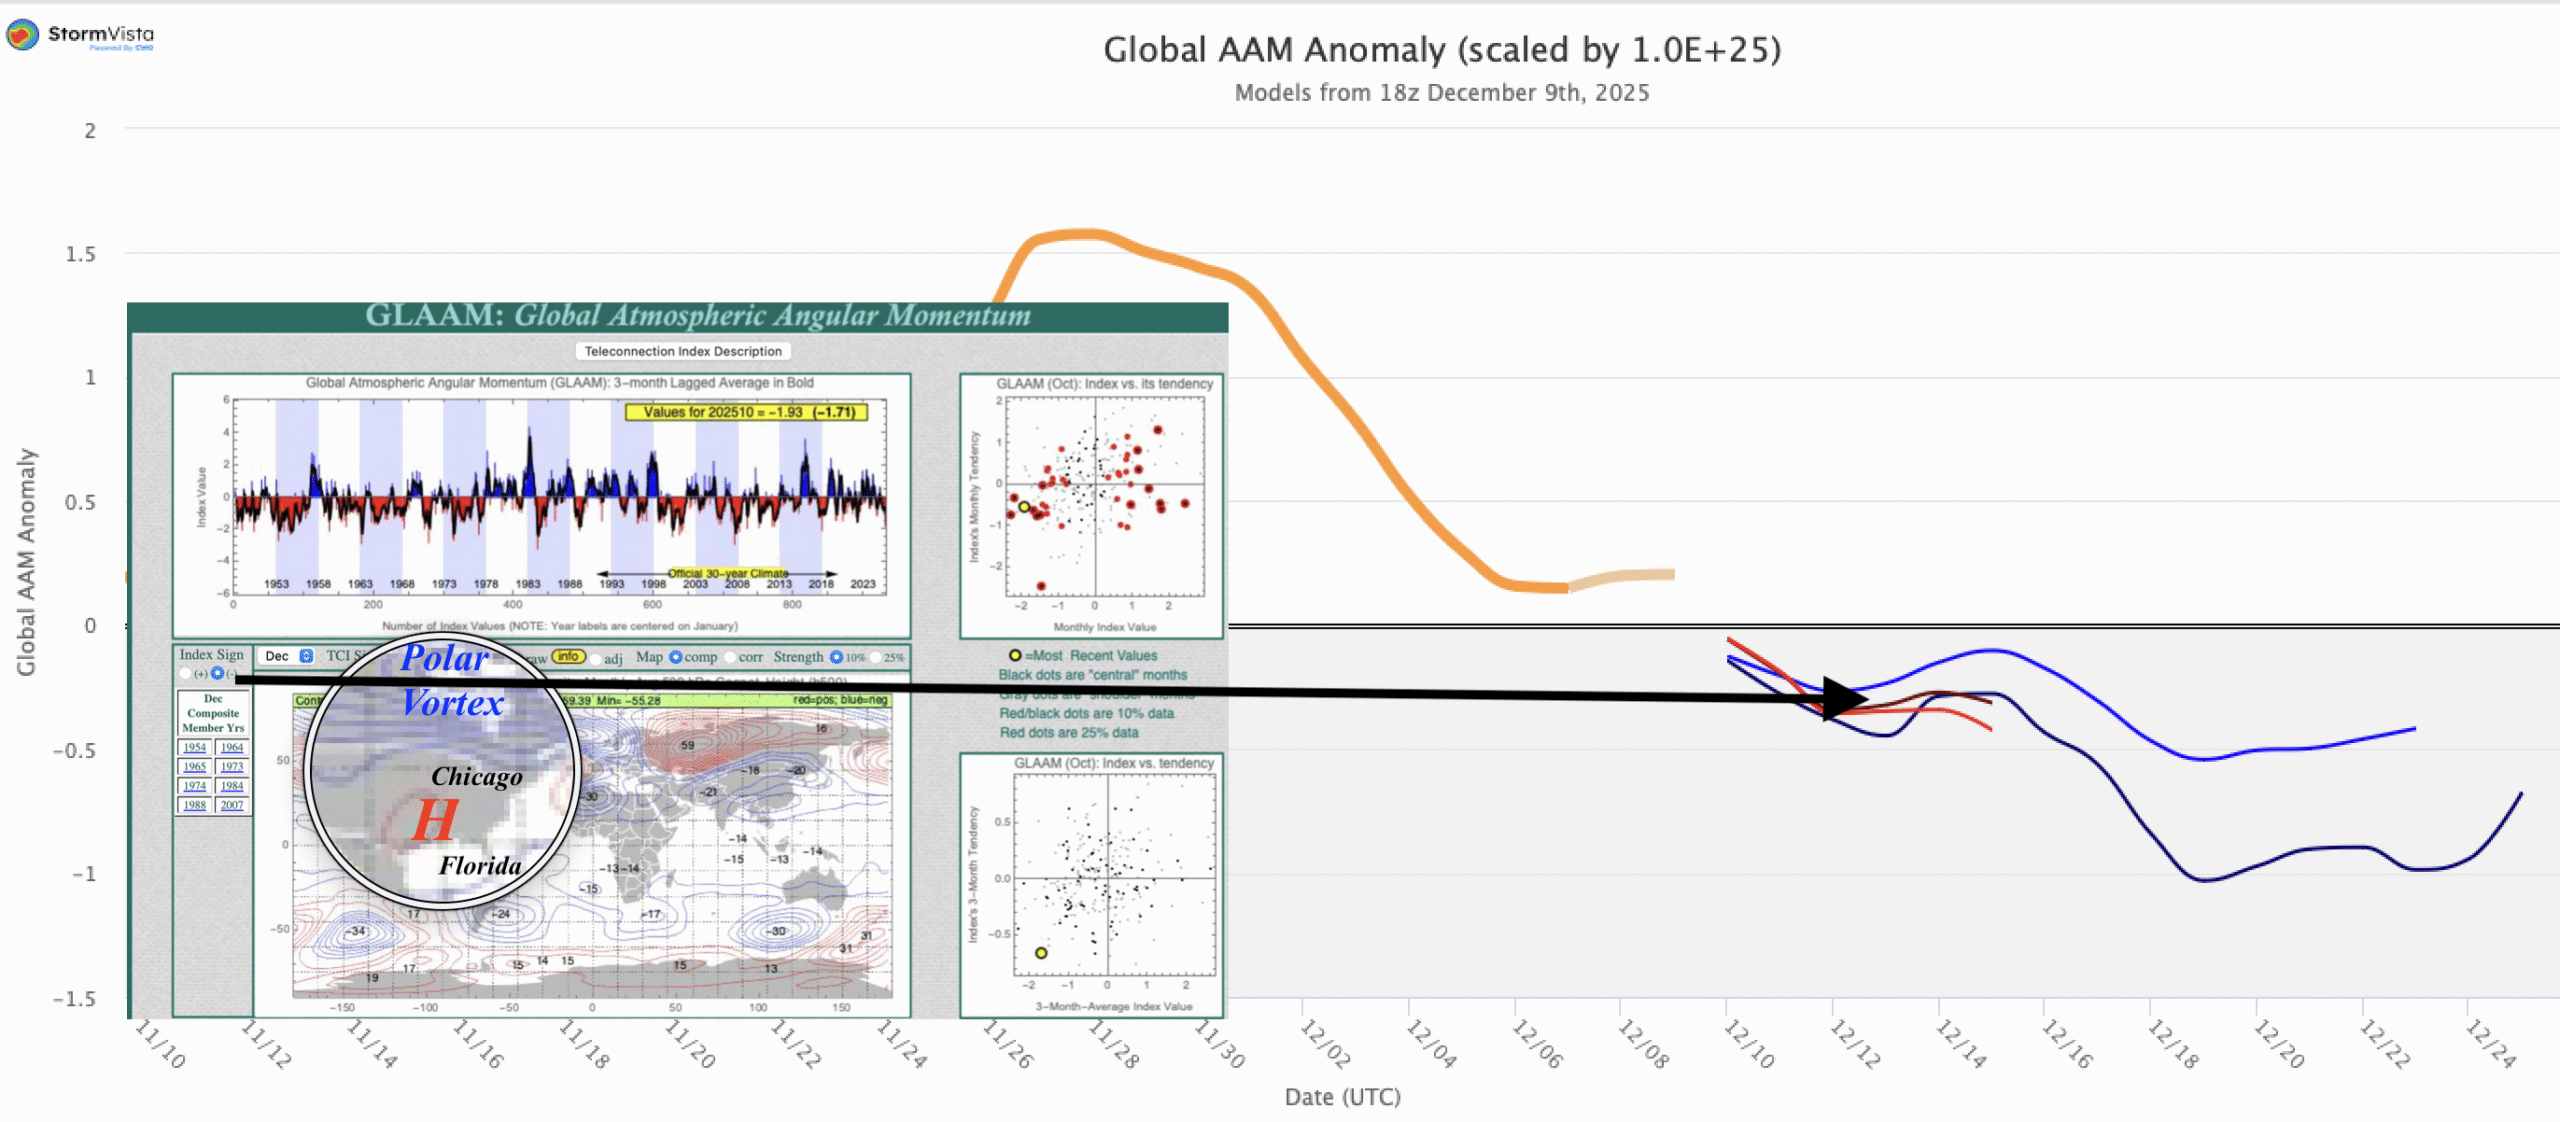
GLAAM stands for Global Atmospheric Angular Momentum in weather forecasting. It is sometimes referred to as GAM and/or GLAM, but they all refer to the same phenomenon. It measures the atmosphere’s rotation, combining Earth’s spin and wind patterns, acting as a crucial index for global circulation and Earth’s rotation, used to understand large-scale climate patterns like ENSO and predict seasonal changes, linking atmospheric shifts to length-of-day variations via numerical models.
There are both positive and negative angular momentum phenomena, and it is the negative GLAAM that is responsible for the mid-late December warm up over most of the United States and (as of this writing) the massive 20% sell-off in natural gas in just a few days.
Key Concepts
What it is: A measure of the total rotational momentum of the atmosphere around Earth’s axis, calculated by integrating wind speeds and densities across the globe.
Components: It includes the momentum from Earth’s own rotation (mass term) and the momentum from atmospheric winds (wind term), which vary seasonally.
Why it Matters:
Earth’s Rotation: Fluctuations in GLAAM directly affect the Earth’s rotation speed and thus the length of the day (LOD).
Atmospheric Dynamics: It helps study how mountains, surface friction, and jet streams influence global weather patterns.
How it is used in forecasting:
Monitoring: Atmospheric angular momentum is monitored in real-time using data from numerical weather models (like NASA’s GEOS models).
Seasonal Forecasts: Negative GLAAM often signals conditions favoring La Niña, potentially leading to cooler, snowier winters in certain regions, while positive GLAAM links to El Niño patterns.
Predictability: Studies suggest long-range forecasts of GLAAM (up to a year) are possible, offering insights into future climate.
In essence, GLAAM provides a unified view of atmospheric dynamics, linking winds to Earth’s rotation and helping forecast broader climate trends.
Negative global atmospheric angular momentum (GLAAM) is associated with La Niña conditions and can contribute to warmer winter weather in parts of the U.S. by altering global circulation patterns, particularly the jet stream.
During a negative GLAAM phase, the atmosphere moves more slowly relative to the Earth’s surface. Thinks of it like the skater to the right.
This change is consistent with and helps maintain La Niña conditions. During La Niña, the trade winds blowing east-to-west across the tropical Pacific are stronger than usual. These strong trade winds push warm surface water toward Asia, allowing colder, nutrient-rich water to upwell along the American west coast. This process is a key feature of La Niña, and the associated atmospheric circulation changes are reflected in the negative GLAAM.
Will the Polar Vortex come south again by January? Will GLAAM go in the opposite direction and become positive? If so, natural gas prices would rally again, as we approach January.
That is what we do at WeatherWealth: We “out forecast” standard weather models and making trade recommendations for clients in soft, grain and natural gas commodities on six continents.
HELPING YOU MAKE THE BEST INVESTMENT DECISIONS BASED ON THE WEATHER
We use cookies to ensure that we give you the best experience on our website. If you continue to use this site we will assume that you are happy with it.