This video points out the power of weather on commodity markets. How can you potentially profit using the weather in your investment portfolio?
(click below)
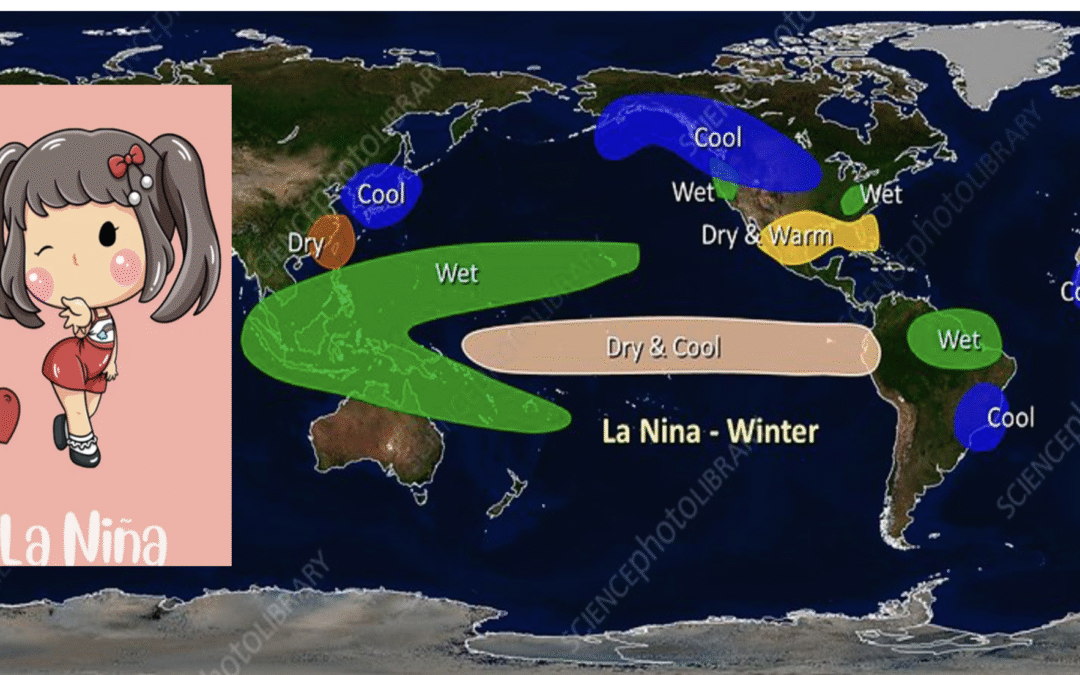
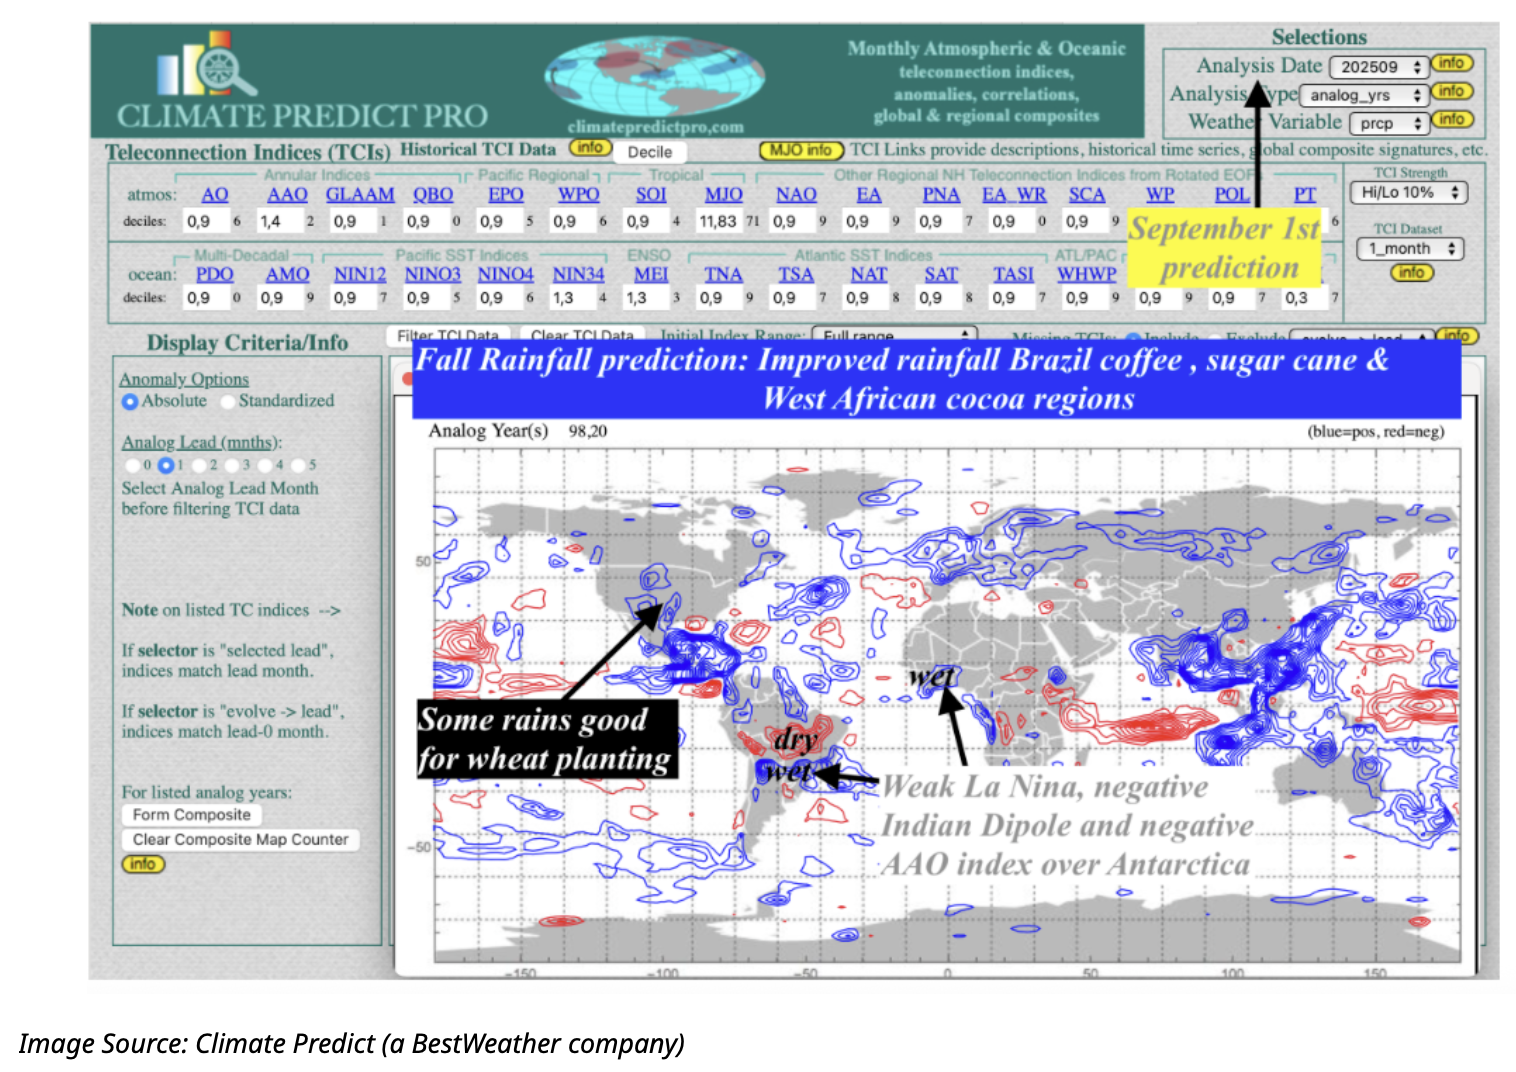
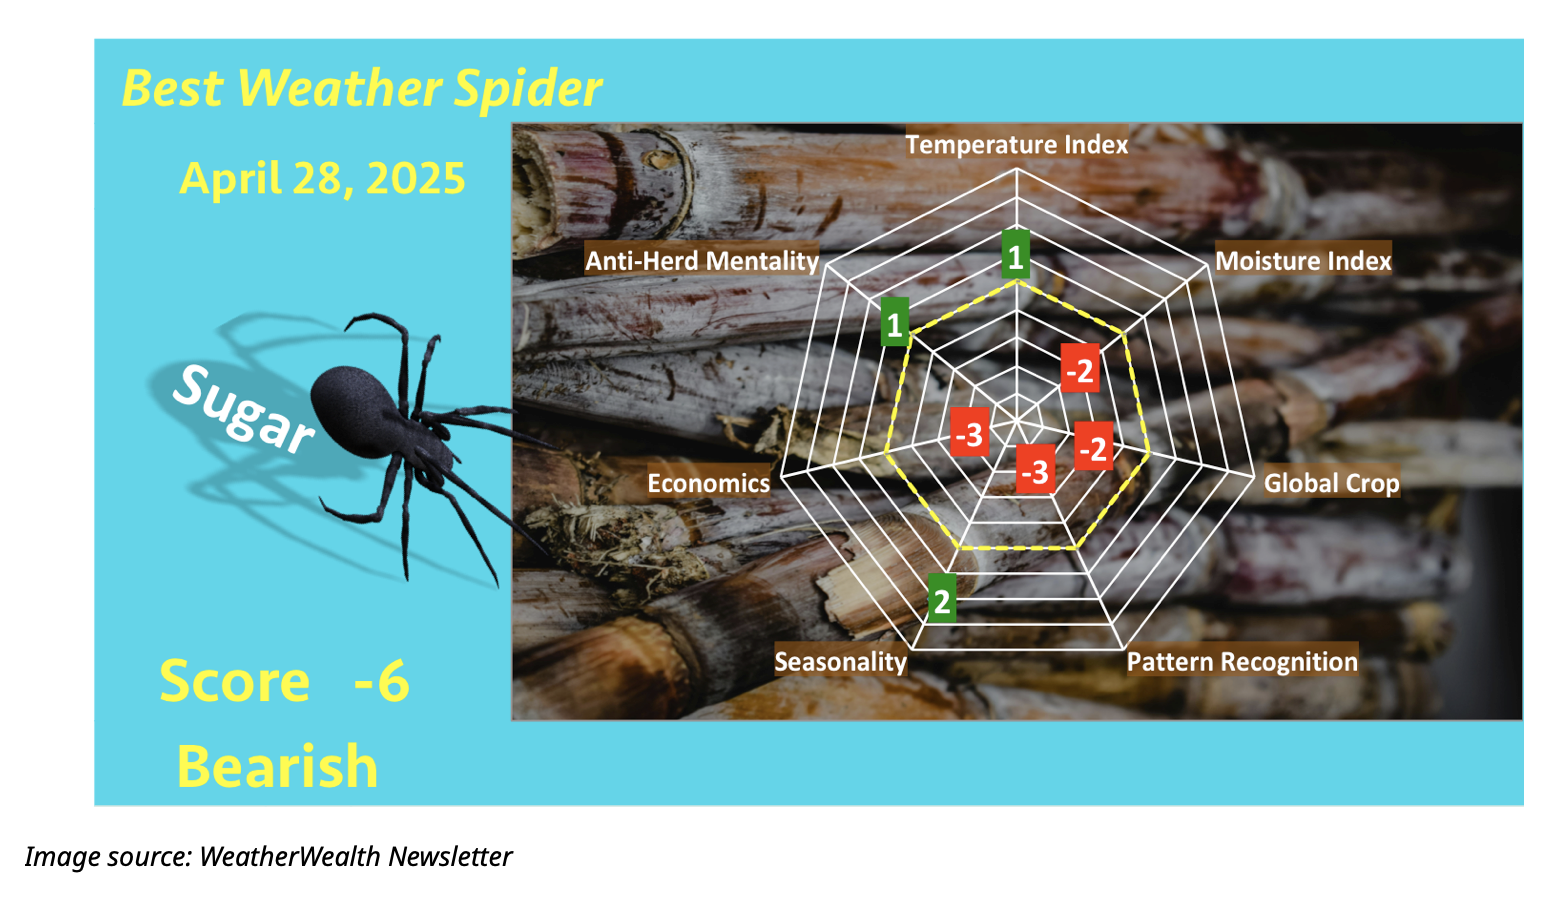
Most recently, a developing La Niña event combined with a negative Indian Ocean Dipole in the Pacific and a weak negative Antarctic Oscillation Index is causing bear markets in cocoa and sugar. Coffee prices may be next (especially if trade tariff tensions ease with Brazil), as we have been predicting the end of Brazil’s multi-year drought for two months.
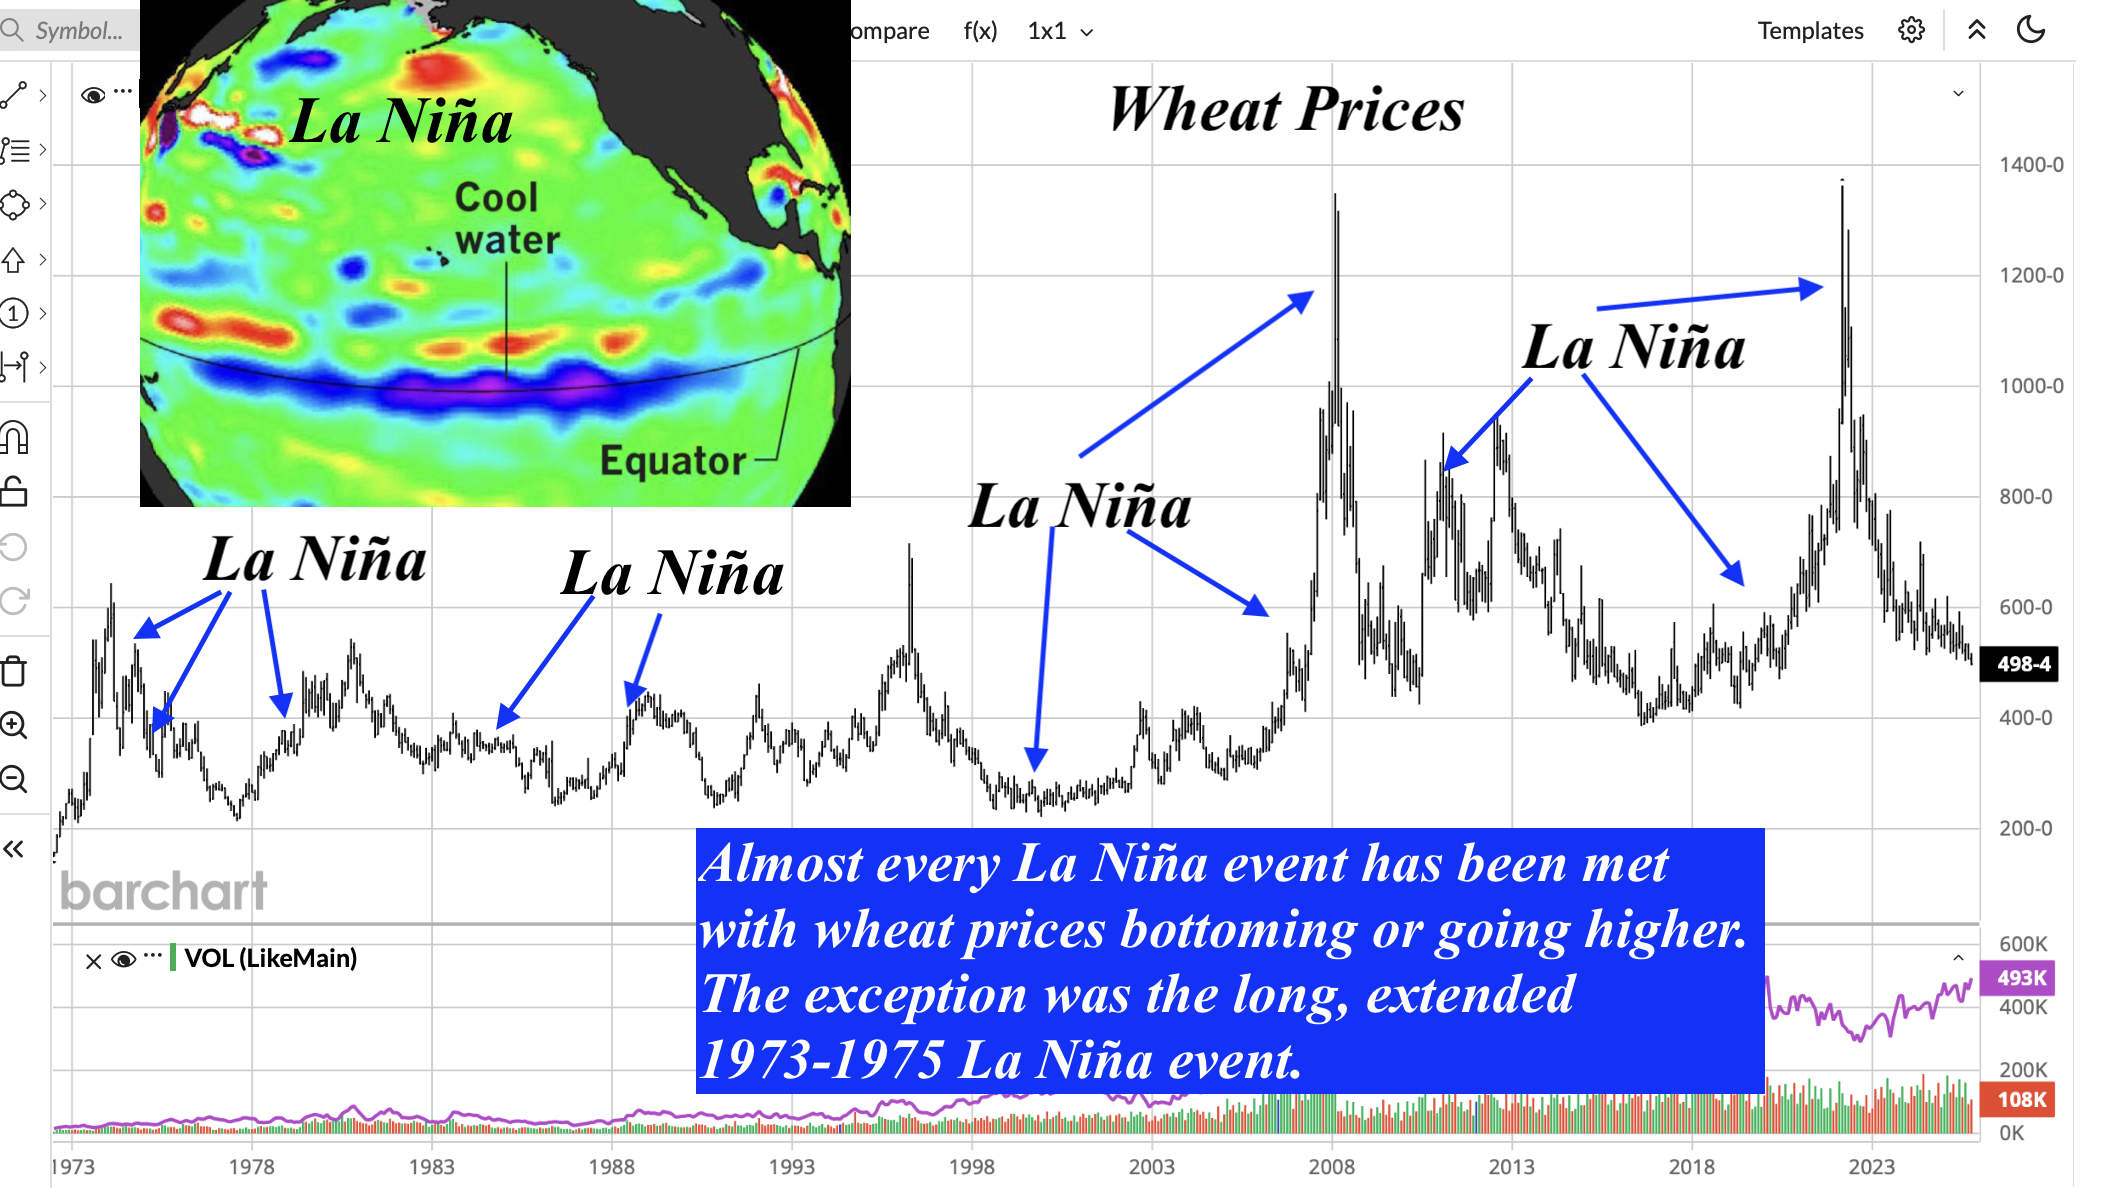
In addition, the rains in Australia and generally good global wheat crops have kept the wheat futures markets in a downtrend. Could that change next year with La Niña?
Screenshot
While the grain market has been hurt by more record global crops, trade tariffs, and poor demand, could La Niña end the bear market by 2026? It is possible.
The US corn crop has come down from a dry late summer and disease issues, and may be the one lone bullish Ag star after the US grain harvest.
You can now receive occasional free weather and commodity discussions on SUBSTACK (click below)
For specific trading and hedging strategies and much more frequent commodity weather ideas, and our BestWeather Spiders for all commodities:Click here for a two week FREE TRIAL for $1
Once your free trial ends to WeatherWealth ($1), you are eligible for a 70% annual discount for over 100 issues. Click below
The BestWeather Spider is considered a reliable tool for commodity traders because it integrates advanced weather forecasting (including factors like El Niño, La Niña, and the Indian Ocean Dipole) with market analysis to anticipate how weather events will impact commodity prices.
Screenshot
Jim Roemer’s approach uses both meteorological data and market fundamentals, providing actionable insights that help traders and farmers make informed decisions in volatile markets.The Spider’s recommendations are regularly updated in the WeatherWealth newsletter, which further enhances its reliability through continuous analysis and expert commentary.
Jim Roemer’s BestWeather Commodity Spider is a proprietary tool that combines weather analysis, technical analysis, and other market fundamentals to help commodity traders anticipate price movements in markets like grains, energy, and soft commodities. The Spider provides actionable insights by showing how weather patterns and forecasts may impact specific commodities, giving both experienced and novice traders an edge in making informed trading decisions. It is part of the broader suite of services offered by Best Weather Inc., which includes newsletters and reports with trade recommendations based on meteorological data and market analysis.
Jim Roemer’s BestWeather Commodity Spider predicts market moves by integrating several key factors:
Weather analysis: It assesses global weather patterns—such as El Niño, La Niña, droughts, and temperature anomalies—that can impact crop yields and energy demand
Technical analysis: The Spider incorporates chart patterns and market signals to identify trends or reversals in commodity prices.
Market fundamentals: It evaluates supply and demand factors, currency movements, and geopolitical events that influence commodity markets
Market psychology: The tool interprets trader sentiment and behavioral patterns to anticipate potential market reactions.
By combining these elements, the Spider provides actionable insights and trade ideas for commodities like grains, energy, coffee, and cocoa, helping traders anticipate and respond to market shifts
by Jim Roemer – Meteorologist – Commodity Trading Advisor – Principal, Best Weather Inc. & Climate Predict – Publisher, Weather Wealth Newsletter
Scott Mathews, Editor
Weekend Report – May 9-11, 2025
Source: Screenshot by Climate Predict LLC – superimposed comments and markers by BestWeather – insert of Pacific Walker Circulation image by NOAA
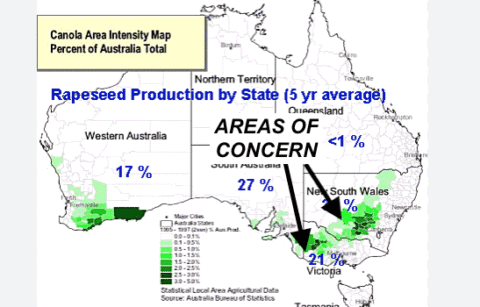
While the grain futures have been mostly in a bear market, even with a weaker dollar, commodities from gold to cocoa and coffee continue in bull trends. Canola prices have really been perking up.
Potentially, there is a global weather problem as the drought in China is beginning to affect some crops in parts of southern Australia.
Below, I discuss how weather and the El Niño neutral stage (neither El Niño or La Niña) is affecting every commodity from wheat to ideal Midwest corn belt weather, previous crop problems in West African cocoa and why global sugar weather is improving. How about natural gas and a possible hot summer?
As a WeatherWealth newsletter subscriber, not only do you receive trading ideas, but you also see much more accurate weather information as we “second guess” standard weather models by looking at these 28 global weather teleconnections for all Ag and natural gas commodities.
—Enjoy Jim Roemer
Source: map by USDA
– commentary and indicator arrows added by BestWeather
Source: price graph by Barchart.com
– indicator arrow and superimposed wording by BestWeather
Source: screenshot by Climate Predict LLC
Source: screenshot by Climate Predict LLC with comments and indicator arrows superimposed by BestWeather
Source: map by Agri-Food Canada (a national information service)
Source: maps by stormvistawxmodels.com – used by permission- superimposed comment and indicator arrow by BestWeather
Source: map by WeatherBELL – used by permission
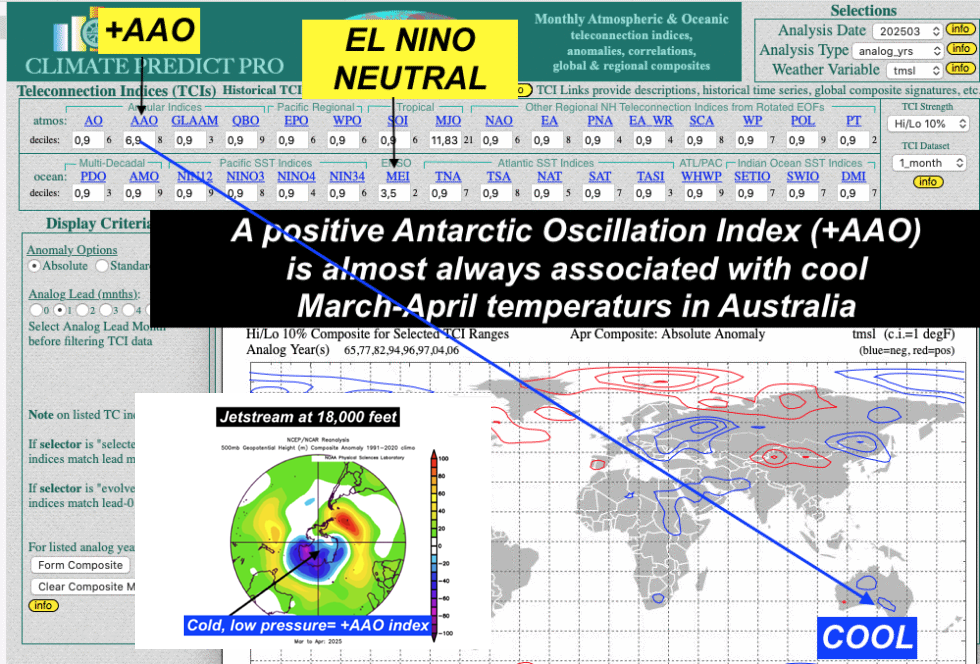
Sources: three screenshots above by Climate Predict LLC
– superimposed comments and indicator arrows by BestWeather
– antarctic polar projection map insert by NOAA, with superimposed markers by BestWeather
Source: maps by USDA, with indicator arrow superimposed by BestWeather
Source: map by WeatherBELL – used by permission
Source: maps by NOAA with superimposed labels and comments by BestWeather
Source: map by NOAA with superimposed arrow indicator by BestWeather
Sources: seasonality table by MRCI (used by permission), with superimposed elements by BestWeather- Map by stormvistawxmodels.com – used by permission – comments and indicators by BestWeather
Source: BestWeather Spider – royalty free natural gas flair photo by pexels.com
Artwork created via AI software DALL-E 3 and is the property of BestWeather
Thanks for your interest in commodity weather!!!
Mr. Roemer owns Best Weather Inc., offering weather-related blogs for commodity traders and farmers. He also is a co-founder of Climate Predict LLC, a detailed long-range global weather forecast tool. As one of the first meteorologists to become an NFA registered Commodity Trading Advisor, he has worked with major hedge funds, Midwest farmers, and individual traders for over 35 years. With a special emphasis on interpreting market psychology, coupled with his short and long-term trend forecasting in grains, softs, and the energy markets, he commands a unique standing among advisors in the commodity risk management industry.
This article contains syndicated content. We have not reviewed, approved, or endorsed the content, and may receive compensation for placement of the content on this site. For more information please view the Barchart Disclosure Policy here.
WEATHER WEALTH SAMPLE CONTENT
HELPING YOU MAKE THE BEST INVESTMENT DECISIONS BASED ON THE WEATHER
We use cookies to ensure that we give you the best experience on our website. If you continue to use this site we will assume that you are happy with it.