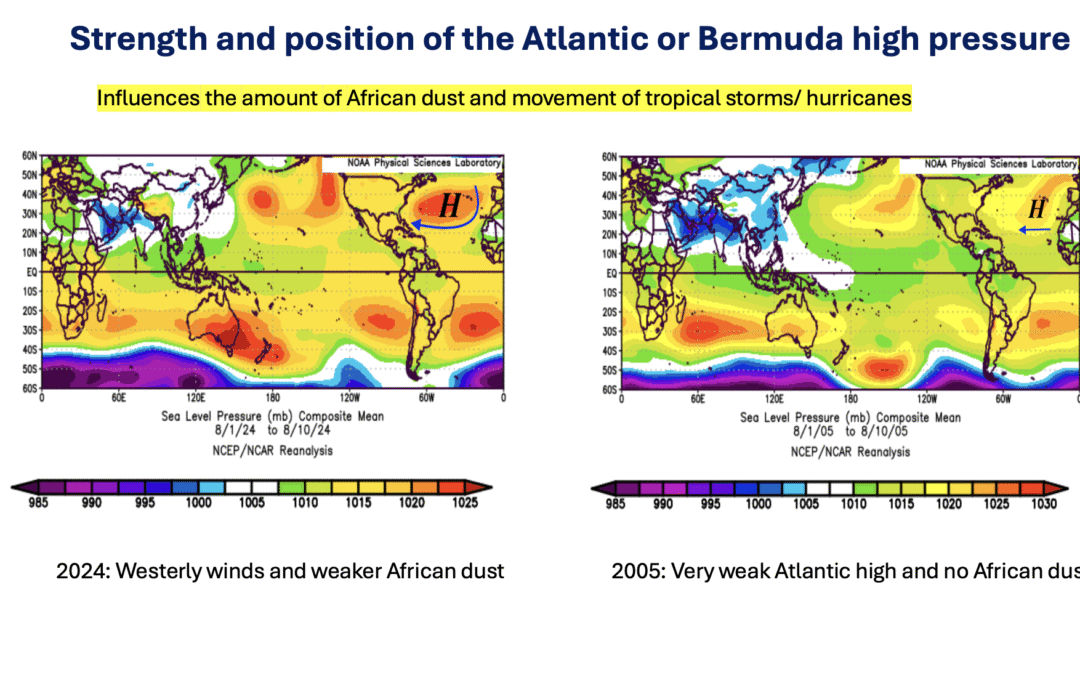
click on video below of renowned meteorologist and commodity investing analyst Jim Roemer riding out the hurricane in Sarasota.
Windows being blown out of building and trees down. However, the situation for this area could have been a lot worse if Milton did not weaken at landfall. Though NOAA and others are saying it landed as a CAT 3 hurricane, sustained winds of around 80-90 MPH with gusts to 100 or so, was really a strong Cat 2. A big difference, though certainly many communities around Tampa, etc. had severe flooding. Tornadoes were the biggest threat in Florida (a record number)
“The record summer +NAO index and its impact on the weak hurricane season and commodities”
by Jim Roemer – Meteorologist – Commodity Trading Advisor – Principal, Best Weather Inc. & Climate Predict – Publisher, Weather Wealth Newsletter
Weekend Report – September 6-8, 2024
Background of the NAO index and its potential i& influence on the Atlantic hurricane season
The NAO (North Atlantic Oscillation Index) is one of the most important teleconnections to predict winter weather for the natural gas market. It has to do with how surface pressures fare over Greenland and the Azores to the west of Africa. When the NAO is negative in winter, this means high pressure over Greenland that can sometimes bring onslaughts of cold winter weather to Europe and/or the U.S.
However, the positive NAO index also helped us predict record midwest summer grain crops for corn and soybeans and will have implications for soft commodities in the months ahead.The record-warm Arctic combined with mostly a positive NAO index (low pressure off Greenland and high pressure over the Azores) has resulted in several warm winters in a row.
A trader could have sold natural gas at some point in time in November or December in each of the last three to four years and made 30-50% on his/her money by March.
Anyway, the NAO index also has some influence on U.S. summer grain weather and soft commodities, as well as repercussions for the Atlantic hurricane season. Models have been overzealous, forecasting potential hurricanes due to all this African dust you see in the image below.
Nevertheless, storms that “originate” in the Gulf are often not affected by African dust–just waves coming off the coast of West Africa. Near record warm ocean temps could result in rapid intensification of a tropical storm early this week in the Gulf. However, no immediate major hurricane is expected.
Shown below are four graphic images I put together:
(upper left) A negative NAO indexresults in below-average African dust and often an active Atlantic hurricane season when an “El Niño neutral” or La Niña is present.
(lower left) The NAO indexhas hit arecord high this summer at 3.15
(upper right) The correlation of a +NAO (shown on my weather forecast program ClimatePredict) depicts thattotal Atlantic Cyclone Energy and the number of strong storms are below normal. This is in contrast to NOAA as well as many other entities out there who wrongly predicted a few months ago, one of the strongest hurricane seasons on record.
(lower right) Low pressure over Greenland responsible for the +NAO
How can the NAO index give clues about commodity weather?
Take a look at the correlation for September rainfall over northern Brazil when the NAO is positive. There is a negative correlation with rainfall. This implies the severe drought continuing for key Brazilian sugar cane crops, coffee, and orange production areas. OJ prices are making all-time highs on the combination of Florida’s lowest crop in decades, and also a 25% reduction in Brazil’s 2024 crop. The 2025 crop may see more of the same.
Soybean traders will also be watching Brazil’s planting weather in another few weeks or so. A severe drought is unusual if La Niña forms in northern Brazil, but deforestation of the Amazon is offsetting some standard climatological signals.
Of course, the NAO is only one of many teleconnections. See how my program has 28 of them. These helped me “second guess” standard computer models last June in predicting that La Niña would not form this summer and the Midwest would have huge corn and soybean crops.
What is my forecast for the important October coffee bloom in Brazil?
When, if at all, will the sugar market begin to respond to the drought?
Which trading strategies am I employing in futures or options for WeatherWealth clients?
Jim Roemer, Scott Mathews, and The Weather Wealth Team
Mr. Roemer owns Best Weather Inc., offering weather-related blogs for commodity traders and farmers. He also is a co-founder of Climate Predict, a detailed long-range global weather forecast tool. As one of the first meteorologists to become an NFA registered Commodity Trading Advisor, he has worked with major hedge funds, Midwest farmers, and individual traders for over 35 years. With a special emphasis on interpreting market psychology, coupled with his short and long-term trend forecasting in grains, softs, and the energy markets, he established a unique standing among advisors in the commodity risk management industry.
Trading futures and options involves a significant risk of loss and is not suitable for everyone. Past performance is not necessarily indicative of future results.
This video below talks about the following from July 5th:
How Hurricane Beryl may affect commodity markets (this is old news now)
Why it has been coffee most adversely affected by a warming planet
The potential for a bull market in grains later? Possibly, but our overall bias for weeks has been “against the crowd” predicting doom and gloom for U.S. grain crops. For now, the delay of La Niña has prevented any major widespread weather problems for corn and soybeans, other than a few isolated areas
Why traders were wrong being bullish natural gas over $3.00 a few weeks ago
Click above and also feel free to join my YouTube channel
This video talks about how the loop current close to Florida and La Nina continuing much more than other meteorologists felt months ago, has strengthened Hurricane Ian close to a category 5 hurricane: one of the strongest if not the strongest hurricanes ever for SW Florida. The storm will likely hit close to Venice, give or take 10 miles.
Winds of at least 100-110 MPH will be felt for several hours this afternoon from Sarasota to Fort Charlotte and Venice, unless Ian weakens. We are hoping the most catastrophic winds hit just south of Sarasota and Long Boat Key.
The video also shows a dry tongue to the west of Ian and shear. The big question is, will this weaken Ian before it hits landfall? Due to the warm loop current, it may not (tough forecast)
HELPING YOU MAKE THE BEST INVESTMENT DECISIONS BASED ON THE WEATHER
We use cookies to ensure that we give you the best experience on our website. If you continue to use this site we will assume that you are happy with it.OkPrivacy policy