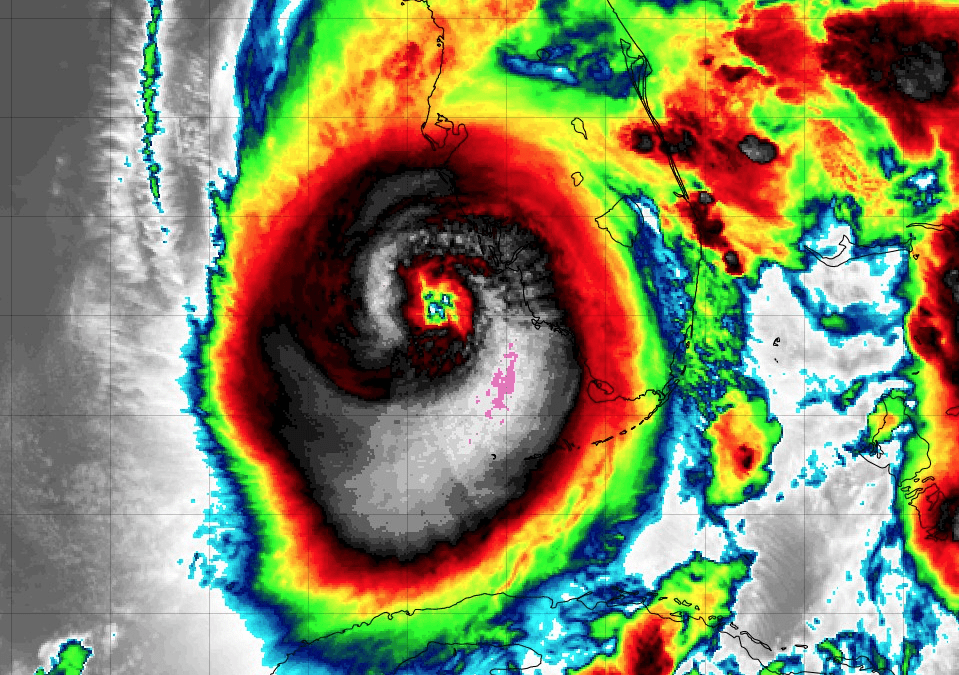
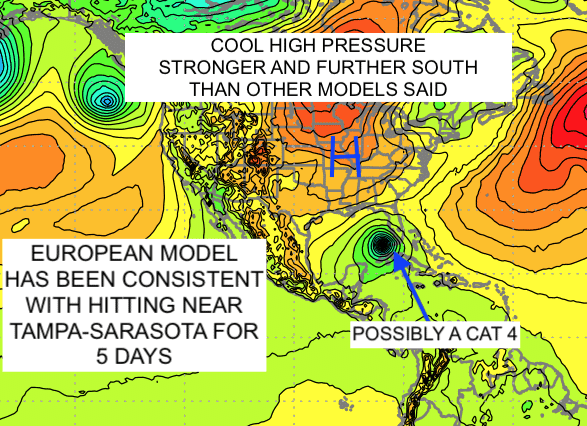
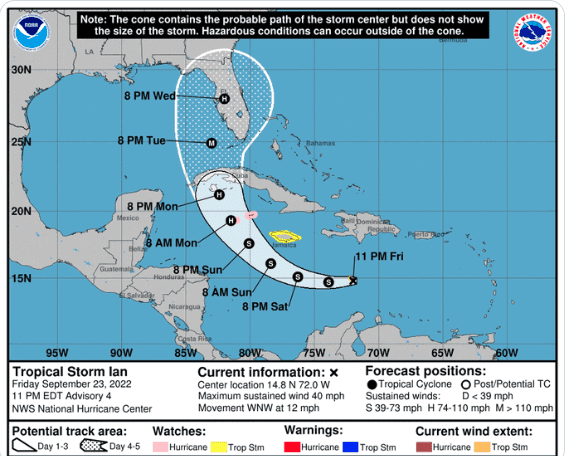
See the video above, subscribe to my youtube channel, and learn about why hurricane Ian may be the worst hurricane to hit western Florida in 100 years or more.
This video talks about what I feared quite early on September 19th, unfortunately: A potentially major hurricane Ian for the west coast of Florida. However, I have seen many times before weather models are wrong, and if Ian develops just west of Cuba that could spare Florida and move Ian closer to the coast of eastern Louisiana to the Panhandle of Florida.
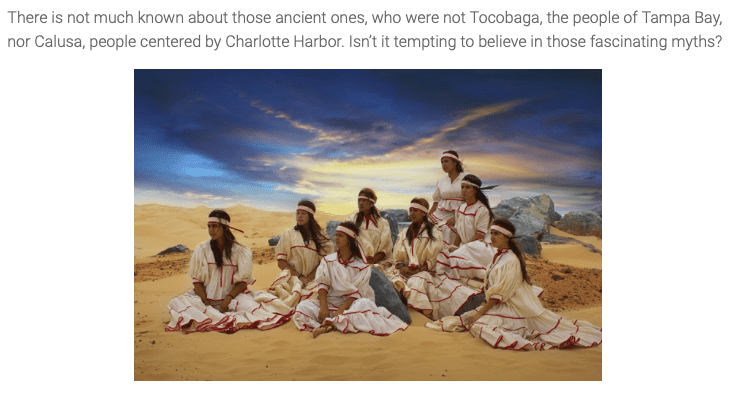
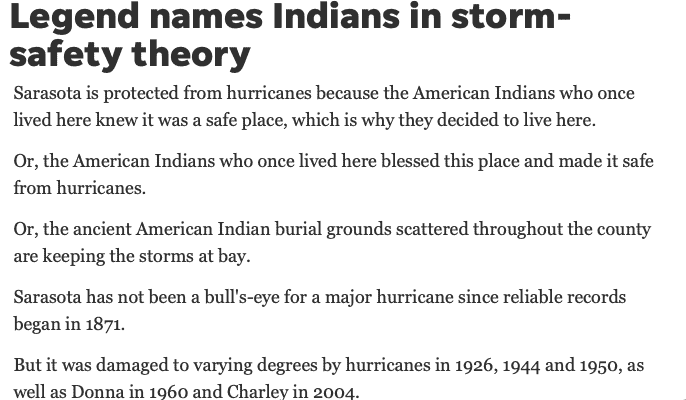
It also talks about the old myths about how Indians protected Sarasota from a major hurricane; one reason why John Ringling settled in Sarasota.
SEE THE VIDEO BELOW AND SUBSCRIBE TO TO MY YOUTUBE CHANNEL
See (click on) video above and please subscribe to my YouTube channel. You will learn about what the “Loop Current” is, how “La Nina” is still playing a role and more. Hurricane Gaston could form before September 28th and be huge.
Click here and subscribe to my youtube channel to find out more about the hurricane season
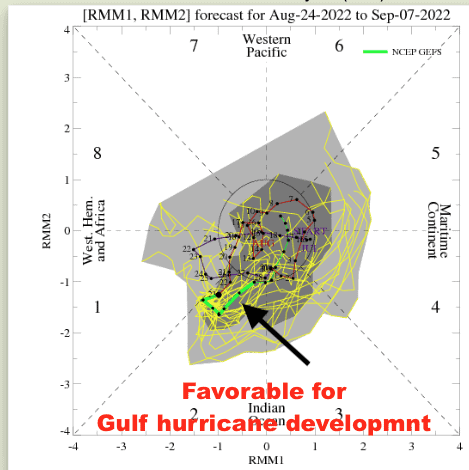
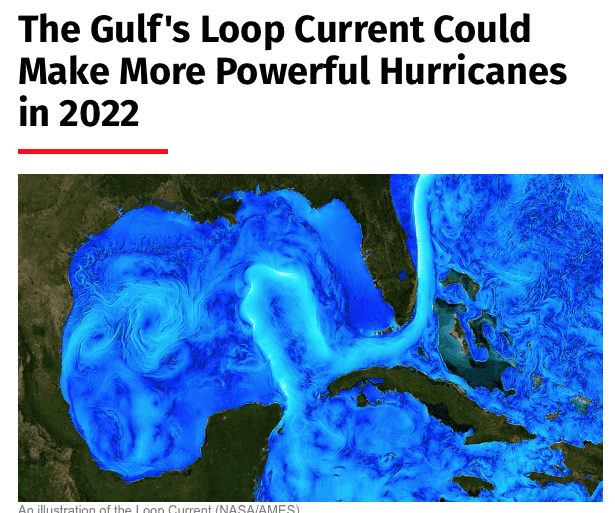
While most of our research suggests a weaker than normal hurricane season, a warm loop current in the Gulf of Mexico and something we call the MJO in phase 2 is a favorable environment for a possible hurricane in the Gulf by early September.
There are many climatological factors that affect the Atlantic and Gulf hurricane seasons. Typically, a La Nina event like we have today reduces wind shear which can help enhance tropical activity. In contrast, El Nino events increase wind shear and reduce the number of storms.
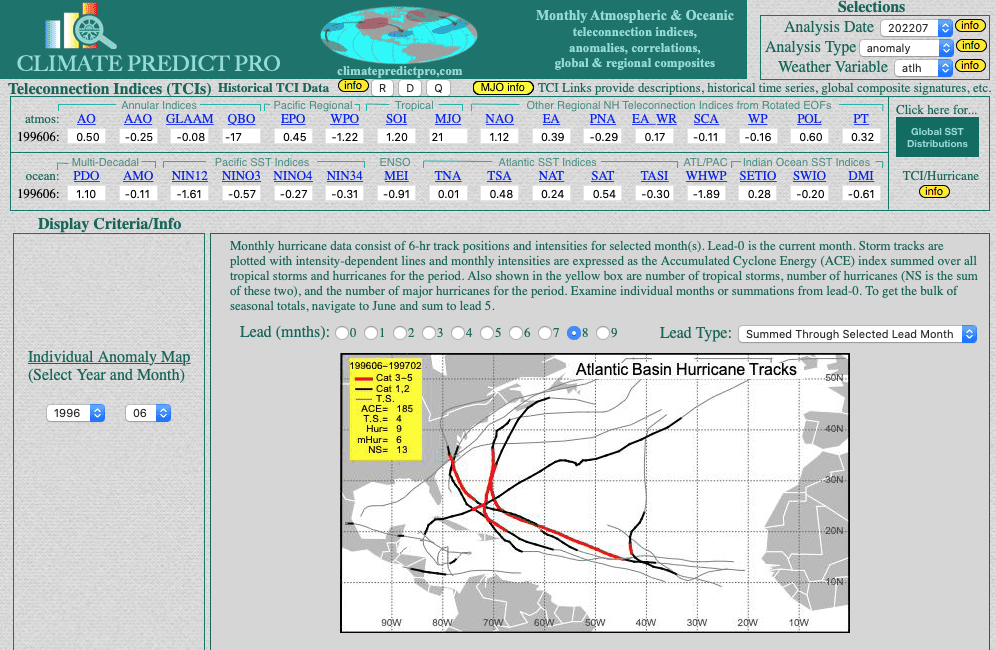
Based on our research and similar global ocean temperatures, the 1996 and 2018 analog may be a good ones. 1996 was a La Nina event with some similar global climatological characteristics. In 2018, Europe also had a severe heat wave in drought that killed thousands of people. African dust also killed the beginning of the hurricane season that year; like this year.
Notice the storm tracks in both of these cases: Mostly out in the Atlantic or along the east coast. In both 1996 and 2018, total named storms were 13 and 14, respectively.
Could this season still reach the projected 17 storms or more that NOAA and others are saying? It could based on climate change and the warm loop current in the Gulf of Mexico (see the discussion below)
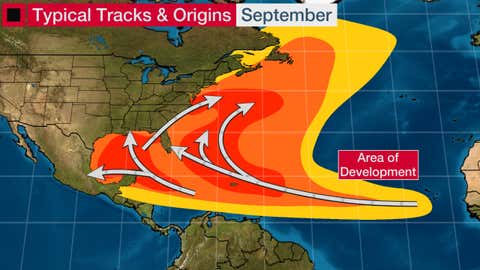
So here is what we are thinking at Best Weather about the general storm tracks this year
1996 La Nina and hurricane tracks
2018 was not a La Nina but similar major European heat wave with AFrican dust
and 2018
Why 2022 hurricane season got off to a slow start and what may be changing?
Summer 2022 got off to a slow start due to major African dust that disrupted any development in the Atlantic. However, in the main eastern development region near Africa, African dust is weakening and some tropical storms and hurricanes are forecasted by early September.
Additional factors that influence hurricane development (or not), are the following
The MJO (Gulf of Mexico and Caribbean Sea hurricanes are four times more likely to occur when the MJO is producing enhanced precipitation and divergent upper level winds than when precipitation is suppressed and upper level winds are convergent.)
2. The TNA index (ocean temperatures off the west coast of Africa
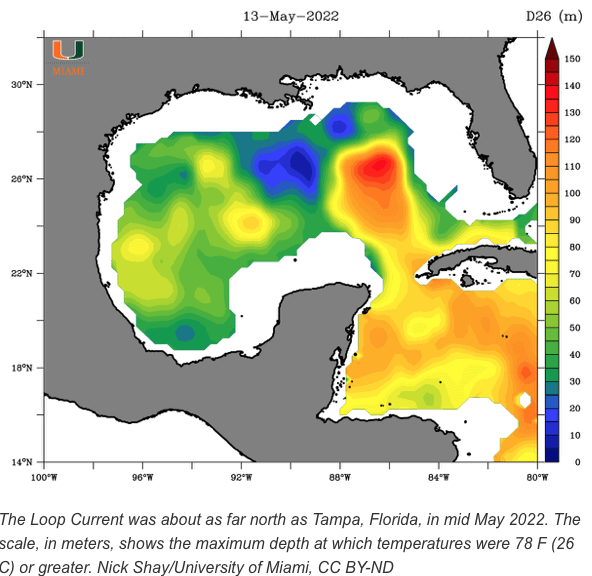
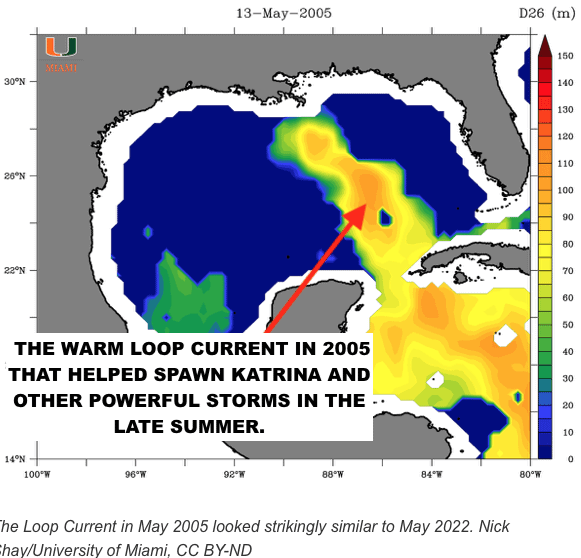
3. The loop current in the Gulf of Mexico (The warm loop current the last few years, brought on by climate change and global warming helped spawn no less than 5 category 5 hurricanes over the last few years out of nothing).
The hurricane season officially began this week and the season’s second storm could be headed toward the Gulf this weekend. What are the reasons for such an early start to the hurricane season? What are the factors that go into making a longer range forecast? How can you have free access to 70 years of historical hurricane data? This report discusses it all.
Much of the information below is quite detailed, but most meteorologists will understand the terms I use.
Anyone can access CLIMATEPREDICT software for free and receive hundreds of color maps showing hurricane tracks, snowfall, and much more. See a description toward the bottom of the page on how to use it.
Potential Tropical Storm or Weak Hurricane in the Gulf This Weekend
Cooling ocean waters in the eastern Pacific are tell-tale signs that a weak La Nina may be forming. When the Atlantic is as warm as it is now and the Pacific is cooling, this reduces wind shear and often allows hurricane formation to develop.
Not all active early starts to the hurricane season are excellent predictors of what may happen during the heart of the season (September/October). Nevertheless, another climatic variable called the Madden Julian Oscillation (MJO) is also in a favorable position for development to occur this weekend.
This weekend’s storm (above) will originate near the Yucatan Peninsula and could be stronger than forecasted because of the MJO.
Here is an interesting video about what the MJO is and how it influences hurricane activity. The MJO is not always in a favorable position to reduce wind shear but will be later this weekend.
Access Historical Hurricane Tracks And Data For FREE
Whether you are a meteorologist, college student studying Atmospheric Science, a commodity trader or just weather enthusiast, you can access FREE historical global ocean temperature data and Atlantic and Gulf hurricane tracks going back to 1948.
Tons of other information related to teleconnections.
We use this data and our proprietary software, ClimatePredict, to forecast the weather. Feel free to try out our lite version.
What Links Teleconnections and Hurricanes?
Teleconnections are recurring, large-scale patterns of pressure and circulation anomalies spanning large geographical areas. They are often responsible for unusual weather anomalies happening at the same time in different areas far apart around the globe.
ClimatePredict.com connects different datasets on factors that impact teleconnections. Understanding teleconnections helps predict hurricanes.
Here are the “short version” instructions for using ClimatePredict.
A) Access historical hurricane information and a database of ocean temperatures from around the world
Click on Global SST (sea surface temperature) distributions to access a huge database of historical ocean temperatures.
B) Access Historical Hurricane Tracks, ACE Data and More
Toggle to get hurricane data. Set the parameter to “Atlantic Basin Hurricane Activity.”
Set the year and month. You can see hurricane tracks, teleconnection relationships, and ACE historical data:
The example above is the Atlantic hurricane season from 2005. You can scroll to 1948. In this case, we are looking at May 2005 teleconnections. The lead time is 5 months (through October) and the “lead type” is ” all hurricanes summed (total)”.
You will see tropical storm, overall hurricane, and major hurricane numbers and cumulative seasonal ACE for that year.
C) Using Teleconnections To Predict Hurricane Tracks and Intensities
Here we are Looking at cooling at NINO12 in the Pacific and the warm Atlantic.
One of the most important teleconnections (other than Atlantic SST’s) in relation to major hurricanes is the NINO12 region. Notice the negative correlation with hurricane activity and ACE. In other words, cooling (negative NINO12) has a negative correlation with ACE and hurricane activity= + hurricanes, active season, and the strongest correlation of any teleconnection (-.29).
The cooling at NINO12 is critical for there to be an active hurricane season in the Atlantic or Gulf. It reduces wind shear and is a possible precursor to a La Nina.
Shown above is the location of the Tropical North Atlantic (TNA) and Tropical South Atlantic (TSA) ocean temperature regions. The region is generally warm right now, so these values are positive and have will have a positive effect on a potentially active hurricane season later this summer and fall.
D) How to Use Teleconnections to Predict Hurricane activity
Warm TSA/TNA regions in the Atlantic in May suggest these analogs. You can see how the checked boxes appear automatically. They represent all the warm ocean temperatures in the tropical regions since late winter and early spring.
Out of these 2 years (above), 1995 had a very warm previous winter (like this past winter) and many other similar teleconnections, such as a weak El Nino. This could be our best fit analog.
We CHOOSE 1995 and 1998 as the best analogs.This is because these 2 years were most similar with respect to a weakening El Nino. But remember, climate change and warming oceans have to be factored into the equation. These analogs are only a guide.
I took the year 1995 as the best possible analog. It was a warm NAO/AO winter with the polar vortex remaining over the North Pole and a weakened El Nino.
E) CONCLUSION: 1995 storms could be a good fit, with at least 19 named storms. 5 were category 4 or 5’s and had high ACE.
The 1995 analog: An active hurricane season likely, ahead
Please remember that analogs are only a guide. Climate change, warming oceans, and a host of other factors influence global weather, climate, and, of course, hurricane activity.
1995 had a previous warm winter and a positive NAO/AO index. It also had a weakening El Nino. Notice how, by the spring, NINO12 was cooling off, as it is now (-1.16 value).
Looking at the 5-month total hurricane activity from May 1995 on Climate Predict (above), one can see the active hurricane season with ACE at 261. There were roughly 18 named storms of which 5 were major hurricanes. One can see the associated hurricane tracks. A couple hit Florida and the Gulf of Mexico, although the majority were out in the Atlantic. This year there is a 261 ACE value. The analogy would suggest that many hurricanes will be of at least category 2-3 status later this summer and fall.
How the 2020 hurricane season could be weaker than normal
It should be pointed out, however, that due to global warming since 1995, the loop current, and other factors, this is only a rough estimate of how active the season could be.
Could the hurricane season be weaker than forecast? After all, many weather forecast firms are predicting an active season and I often “hate” agreeing with the crowd. The hurricane season would be weaker than expected if A) La Nina fails to materialize by the fall and Nino12 regions do not continue to cool off; B) The Atlantic Ocean cools off suddenly, which is very unlikely; or C) Africa dust comes into the Atlantic, which can often disrupt storm formations.
HELPING YOU MAKE THE BEST INVESTMENT DECISIONS BASED ON THE WEATHER
We use cookies to ensure that we give you the best experience on our website. If you continue to use this site we will assume that you are happy with it.OkPrivacy policy