The Indian Ocean Dipole (IOD) is a climate phenomenon affecting the Indian Ocean. During a positive phase, warmth is pushed to the Western part of that body of water, while cold deep waters are brought up to the surface in the eastern end of the Indian Ocean. This pattern is reversed during the negative phase of the IOD. It is also known as the Indian Niño, as it draws similarity with the El-Niño Southern Oscillation (ENSO).
What are we looking at?
The plot tracks the conditions in the Indian Ocean, showing the phase of the IOD both now and in the past. Right now we are in a negative phase.
When the value of the time series is positive (red shading), the warm phase of the IOD is present with higher sea level in the western Indian Ocean and lower sea level in the eastern Indian Ocean.
When the value is negative (blue shading on graph above), the cool phase of the IOD is present with lower sea level in the western Indian Ocean and higher sea level in the eastern Indian Ocean. This is what we have today.
Why is it important in commodity trading?
The IOD influences tropical commodities in Africa, Australia and Southeast Asia the most.
During the positive phase of the IOD, the high temperatures along the coast of Africa cause heavy rains and droughts in Australia.
During a negative phase the high temperatures and rainfall patterns are reversed. The sea-level changes associated with the IOD can also lead to increased threats of coastal flooding and associated impacts. However, for west Africa, a negative IOD phase coupled with an El Niño can bring bull markets for cocoa with dry spring and summers often occurring affecting the main crops in Ivory Coast and Ghana.
Presently, we have an El Niño neutral situation and a developing negative Indian Dipole. Hence, the situation is a bit confusing, but could portend a decent (not great) main cocoa crop and possibly take the steam out of the recent two year bull market.
Source: Jim Roemer (Climatepredict software): “If there was an El Niñno in 2025, which there is not, drier weather and a potential bull market would occur this summer“
The negative phase of the IOD brings about the opposite conditions of a positive IOD, with warmer water and greater precipitation in the eastern Indian Ocean, and cooler and drier conditions in the west.
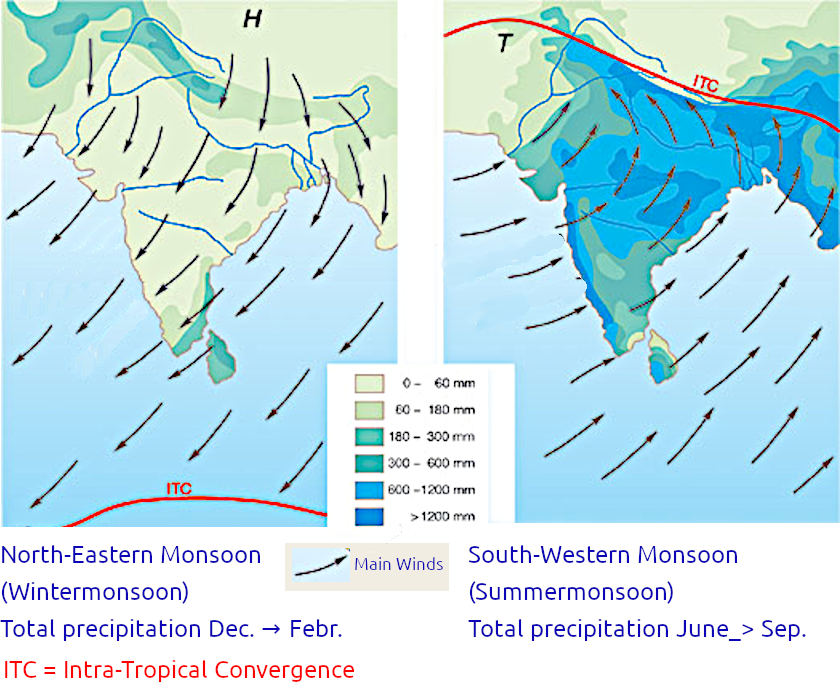
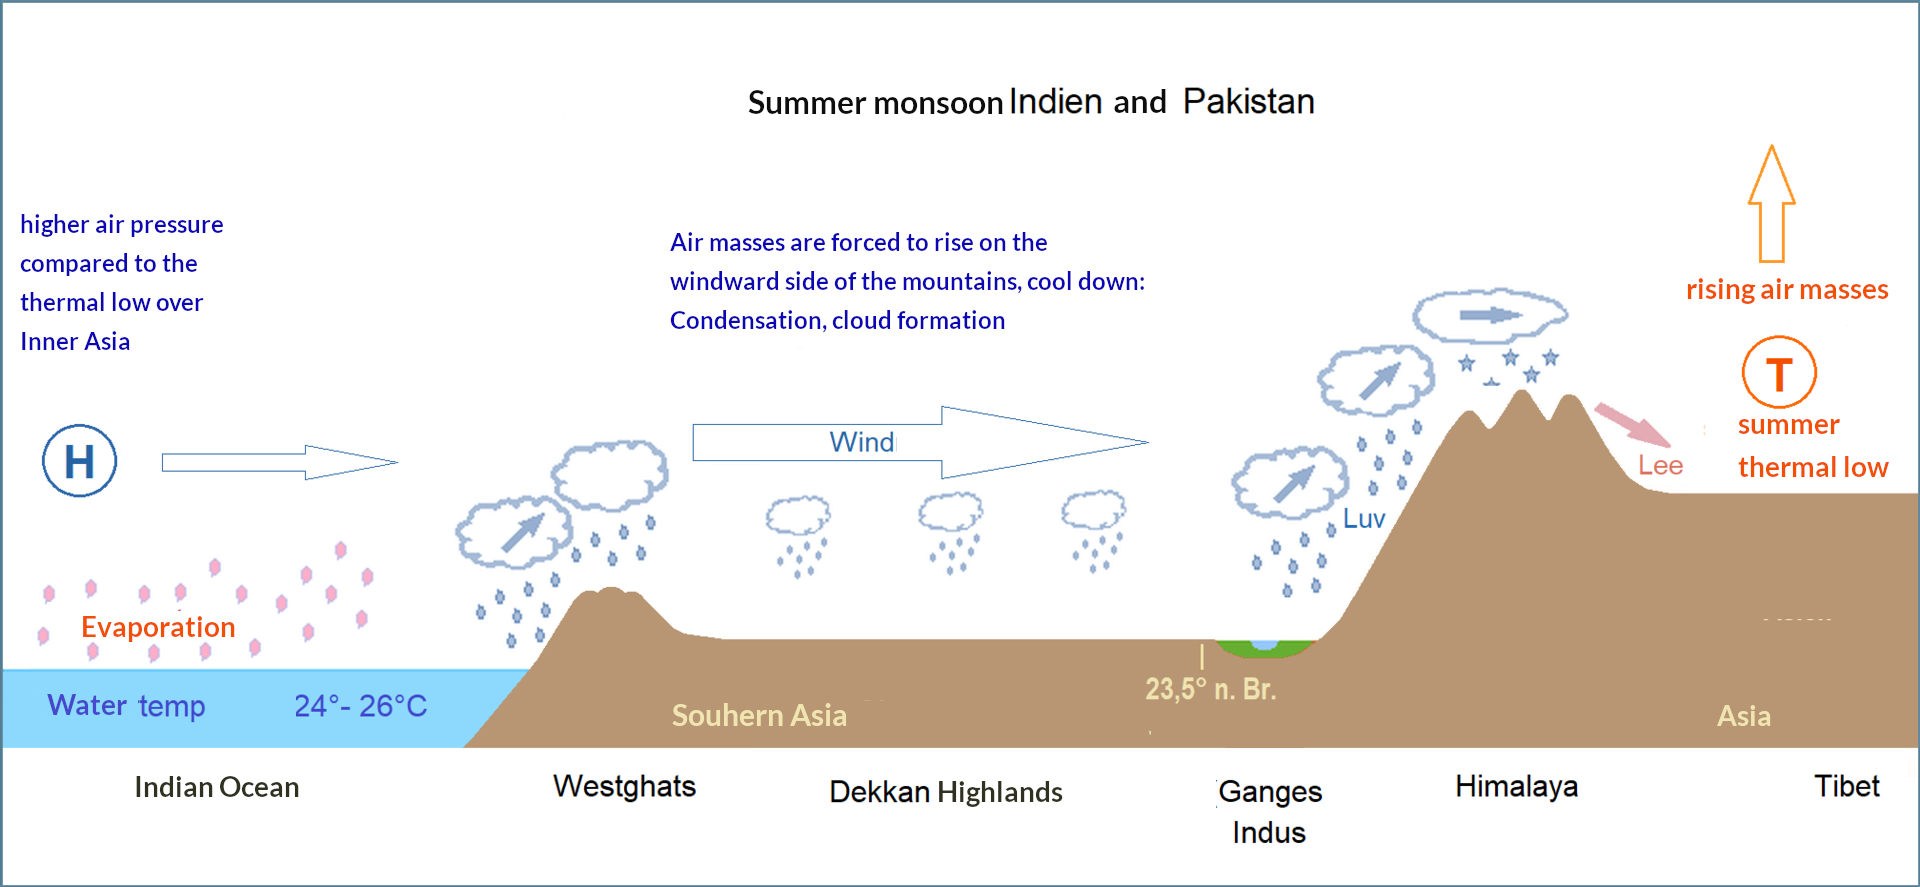
The IOD also affects the strength of monsoons over the Indian subcontinent. This is what we have presently: A negative Indian Ocean Dipole, whose effects should be for a general good monsoon in India that tends to be bearish commodities such as sugar.
The impact of monsoons on Indian farmers
A majority of India’s GDP is dependent on the growth and production of agriculture. India is an agrarian nation, with more than 50% of the population earning their livelihood in agriculture.
The monsoon is the most important season for farmers in this country. A majority of Indian agricultural land is watered by the southwest monsoon. Field crops such as sugar, cotton, wheat, rice, and legumes are staple foods in India. They require strong rainfall in order to grow.
Does the Indian Monsoon affect summer corn belt weather?
There is only a little evidence that the Indian monsoon has a significant or consistent effect on Midwest Corn Belt weather. The Midwest’s weather and crop yields are primarily influenced by local factors such as precipitation recycling, land use, and groundwater, as well as larger-scale patterns like El Niño and La Niña. While global weather systems can sometimes interact, and changes in major monsoon systems may have indirect or minor effects on global atmospheric circulation, any direct linkage between the Indian monsoon and Midwest Corn Belt weather is not established in the search results.
You can see on my ClimatePredict program below (available to subscribers to WeatherWealth newsletter), there is a slight (-.31) correlation of the Indian Dipole and July corn belt rainfall.
In other words, a negative IOD, which is negatively correlated, suggests a slight chance for above normal corn belt rains (two negatives = a positive value). Notice, however, the correlation is much higher with El Niño/La Niña (+1.01). An El Niño (warm ocean signal) is positively correlated with corn belt rain. In other words wet, while La Niña is the opposite– a dry bullish signal like 2011 and 2012. Right now, we have mixed “El Niño neutral” conditions.
July temperature tends to to be hotter than normal for the Midwest corn belt with a negative IOD. Here too, the correlation is much weaker with the IOD than El Niño/La Niña and other teleconnections
Conclusion:
It promises to be another wild summer for the grain market, as the potential for hot summer weather will increase market volatility. The Indian Ocean Dipole being negative and an “El Niño neutral” event does suggest that most (not all) of the Midwest grain belt should have decent summer rains.
With respect to soft commodities, potential crop problems may continue for parts of West African cocoa, while Robusta coffee and sugar crops recover in Southeast Asia. This could keep these two commodities in a more longer term bear market. Of course, the behavior of the Brazilian Real, US dollar and crops in various locations will also play a role.
by Jim Roemer – Meteorologist – Commodity Trading Advisor – Principal, Best Weather Inc. & Climate Predict – Publisher, Weather Wealth Newsletter
Scott Mathews, Editor
Weekend Report – May 9-11, 2025
Source: Screenshot by Climate Predict LLC – superimposed comments and markers by BestWeather – insert of Pacific Walker Circulation image by NOAA
While the grain futures have been mostly in a bear market, even with a weaker dollar, commodities from gold to cocoa and coffee continue in bull trends. Canola prices have really been perking up.
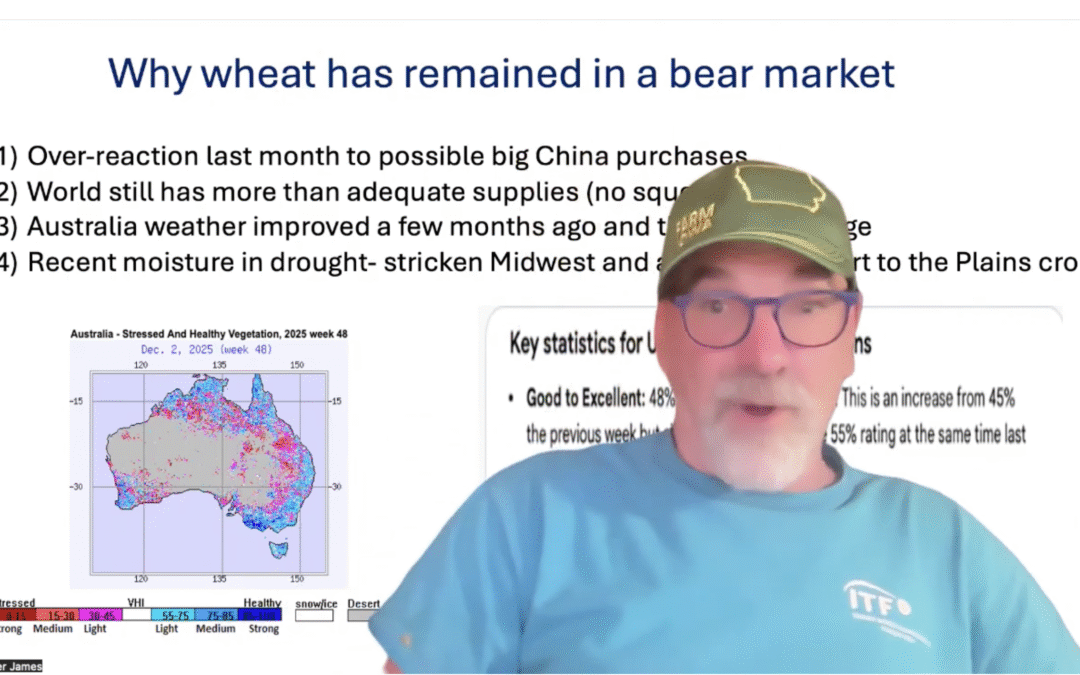
Potentially, there is a global weather problem as the drought in China is beginning to affect some crops in parts of southern Australia.
Below, I discuss how weather and the El Niño neutral stage (neither El Niño or La Niña) is affecting every commodity from wheat to ideal Midwest corn belt weather, previous crop problems in West African cocoa and why global sugar weather is improving. How about natural gas and a possible hot summer?
As a WeatherWealth newsletter subscriber, not only do you receive trading ideas, but you also see much more accurate weather information as we “second guess” standard weather models by looking at these 28 global weather teleconnections for all Ag and natural gas commodities.
—Enjoy Jim Roemer
Source: map by USDA
– commentary and indicator arrows added by BestWeather
Source: price graph by Barchart.com
– indicator arrow and superimposed wording by BestWeather
Source: screenshot by Climate Predict LLC
Source: screenshot by Climate Predict LLC with comments and indicator arrows superimposed by BestWeather
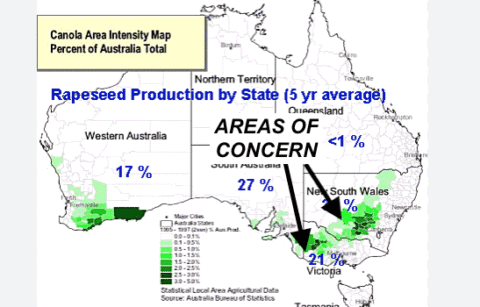
Source: map by Agri-Food Canada (a national information service)
Source: maps by stormvistawxmodels.com – used by permission- superimposed comment and indicator arrow by BestWeather
Source: map by WeatherBELL – used by permission
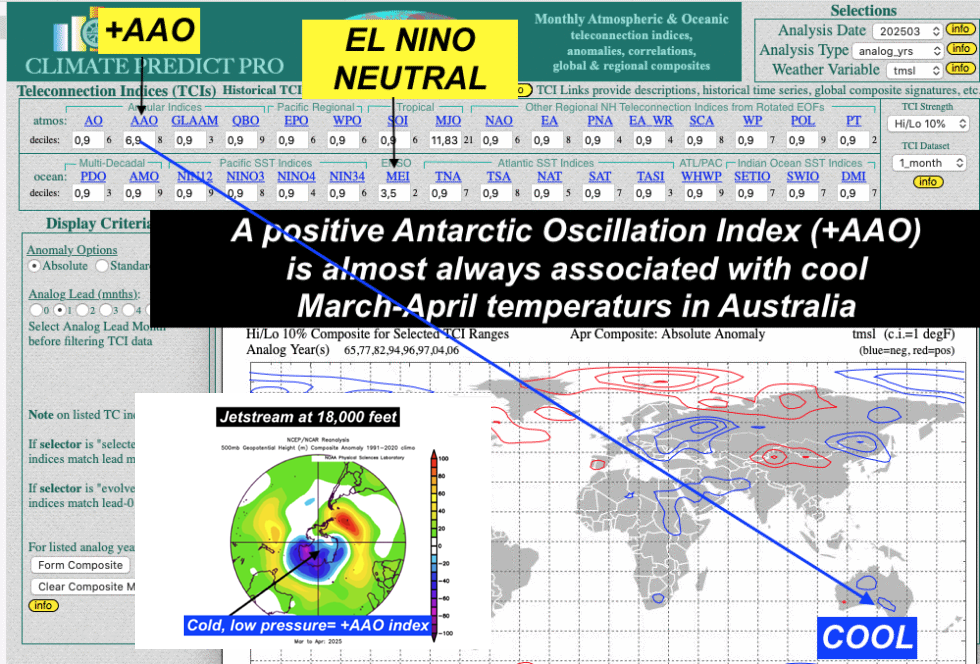
Sources: three screenshots above by Climate Predict LLC
– superimposed comments and indicator arrows by BestWeather
– antarctic polar projection map insert by NOAA, with superimposed markers by BestWeather
Source: maps by USDA, with indicator arrow superimposed by BestWeather
Source: map by WeatherBELL – used by permission
Source: maps by NOAA with superimposed labels and comments by BestWeather
Source: map by NOAA with superimposed arrow indicator by BestWeather
Sources: seasonality table by MRCI (used by permission), with superimposed elements by BestWeather- Map by stormvistawxmodels.com – used by permission – comments and indicators by BestWeather
Source: BestWeather Spider – royalty free natural gas flair photo by pexels.com
Artwork created via AI software DALL-E 3 and is the property of BestWeather
Thanks for your interest in commodity weather!!!
Mr. Roemer owns Best Weather Inc., offering weather-related blogs for commodity traders and farmers. He also is a co-founder of Climate Predict LLC, a detailed long-range global weather forecast tool. As one of the first meteorologists to become an NFA registered Commodity Trading Advisor, he has worked with major hedge funds, Midwest farmers, and individual traders for over 35 years. With a special emphasis on interpreting market psychology, coupled with his short and long-term trend forecasting in grains, softs, and the energy markets, he commands a unique standing among advisors in the commodity risk management industry.
This article contains syndicated content. We have not reviewed, approved, or endorsed the content, and may receive compensation for placement of the content on this site. For more information please view the Barchart Disclosure Policy here.
by Jim Roemer – Meteorologist – Commodity Trading Advisor – Principal, Best Weather Inc. & Climate Predict – Publisher, Weather Wealth Newsletter
Weekend Report – August 23-25, 2024
To View Video > > > > > PLEASE CLICK BELOW
In this video, I talk about:
Why La Niña did not form this summer and how I predicted the bear market in grains last June
BestWeather Spiders: What are they and how to use them to trade everything from soybeans to coffee
Global Atmospheric Angular Momentum is finally turning negative: How this resulted in some short-term heat and dryness in parts of the Midwest grain belt. Will it last?
Northern Brazil’s drought and how it may affect OJ, sugar, and coffee production and prices.
West African dry weather is helping the cocoa market again. What’s in store, weatherwise?
See how we predicted $9.50 soybean prices and sub $4.00 corn, 2-3 months ago, what’s ahead for soft commodities, and more. You can also receive a 2-week free trial period
Thanks for your interest in commodity weather!
Jim Roemer, Scott Mathews, and The Weather Wealth Team
Mr. Roemer owns Best Weather Inc., offering weather-related blogs for commodity traders and farmers. He also is a co-founder of Climate Predict, a detailed long-range global weather forecast tool. As one of the first meteorologists to become an NFA registered Commodity Trading Advisor, he has worked with major hedge funds, Midwest farmers, and individual traders for over 35 years. With a special emphasis on interpreting market psychology, coupled with his short and long-term trend forecasting in grains, softs, and the energy markets, he established a unique standing among advisors in the commodity risk management industry.
Trading futures and options involves a significant risk of loss and is not suitable for everyone. Past performance is not necessarily indicative of future results.
On the date of publication, Jim Roemer did not have (either directly or indirectly) positions in any of the securities mentioned in this article. All information and data in this article is solely for informational purposes. For more information please view the Barchart Disclosure Policy here.
by Jim Roemer – Meteorologist – Commodity Trading Advisor – Principal, Best Weather Inc. & Climate Predict – Publisher, Weather Wealth Newsletter
It is already well known that U.S. corn yields may surpass 180 bushels per acre and for soybeans, at least 51 bushels per acre. There still continues to be some amateur meteorologists and/or advisory services out there that are talking about everything from hot/dry western corn belt weather, to drought in Ukraine, flooding to Russia’s spring wheat crop, hoping for a bull market. Sorry, Folks … it is n o t g o i n g t o h a p p e n at any time soon.
In addition, La Niña may be super weak later this year and does NOT necessarily portend major weather problems for southern Brazil or Argentina after November.
Presently, notice how the Southern Oscillation Index (SOI) is negative (El Niño like). The SOI index is a major climatological variable that influences the formation of La Niña or El Niño. The index needs to be positive for 2-3 months for NOAA to officially claim a La Niña is present. When that happens, low pressure sets up over Australia and high pressure near Tahiti. The Trade Winds then blow strong from east to west over the equator bringing cooler waters further west. As you can see, there are still warm waters to the east of Australia.
To make matters worse, if a narcissistic pathological liar gets elected as President… one who only cares about himself, not about you! (you know who I am talking about), and, if you are a farmer, then there are more problems ahead for lower grain prices. You are not only going to have to contend with storage of a record 2024 corn and soybean crop, demand worries from China but a possible Trade War with China.
With regards to the weather, we told our WeatherWealth clients late last week…
…that stratospheric warming (39-50 miles up above the atmosphere) was going to force the Arctic Oscillation Index to go negative. This is a warm block aloft, above the western Arctic circle that is going to push cool fronts over the Midwest the next 2 weeks and result in more ample rain and NO extreme heat.
Combine the negative AO index and NO La Niña yet and you have the continuation of mostly ideal weather in August for Midwest crops.
Thanks for your interest in commodity weather!
Jim Roemer, Scott Mathews, and The Weather Wealth Team
Mr. Roemer owns Best Weather Inc., offering weather-related blogs for commodity traders and farmers. He also is a co-founder of Climate Predict, a detailed long-range global weather forecast tool. As one of the first meteorologists to become an NFA registered Commodity Trading Advisor, he has worked with major hedge funds, Midwest farmers, and individual traders for over 35 years. With a special emphasis on interpreting market psychology, coupled with his short and long-term trend forecasting in grains, softs, and the energy markets, he established a unique standing among advisors in the commodity risk management industry.
Trading futures and options involves a significant risk of loss and is not suitable for everyone. Past performance is not necessarily indicative of future results.
This video below talks about the following from July 5th:
How Hurricane Beryl may affect commodity markets (this is old news now)
Why it has been coffee most adversely affected by a warming planet
The potential for a bull market in grains later? Possibly, but our overall bias for weeks has been “against the crowd” predicting doom and gloom for U.S. grain crops. For now, the delay of La Niña has prevented any major widespread weather problems for corn and soybeans, other than a few isolated areas
Why traders were wrong being bullish natural gas over $3.00 a few weeks ago
Click above and also feel free to join my YouTube channel
HELPING YOU MAKE THE BEST INVESTMENT DECISIONS BASED ON THE WEATHER
We use cookies to ensure that we give you the best experience on our website. If you continue to use this site we will assume that you are happy with it.


