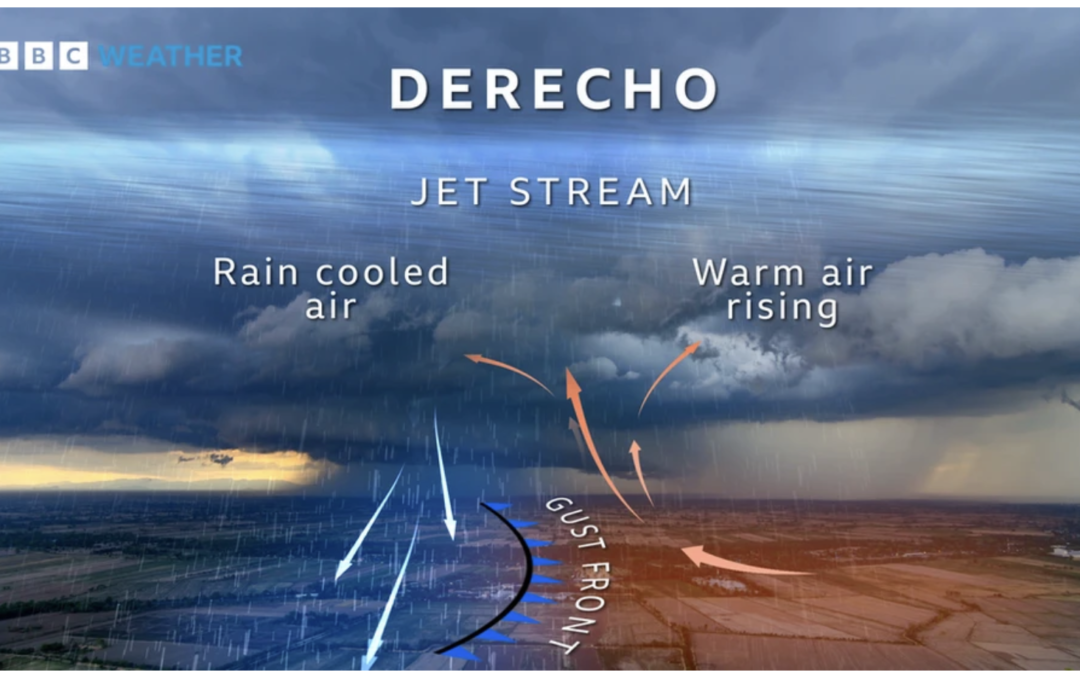
A derecho starts life as a thunderstorm, or cluster of thunderstorms. If conditions are right and there is plenty of warm, humid air at the surface, combined with a strong, straight jet stream, the storm can build into a towering system.
Warm currents of rising air combine with downdrafts of colder, rain-bearing air. These spill out of the bottom of the cloud and spread out horizontally, creating strong bursts of wind. This forces warm air at the surface upwards, creating a “gust front”.
While some minor damage could occur to some Midwest, corn, soybeans and interfere with the soft-red wheat harvest. The odds are low that the important July pollination month for Midwestern corn will see any extensive hot, dry weather. The reason? While El Niño just formed and is weak to start, it may act more like a “strong El Niño”, which rarely results in July Midwest droughts.
Click here to download our FREE Climatelligence Substack App.We will be offering soon a very inexpensive new, commodity-weather service.
See the video regarding two potential Derechos over the next week
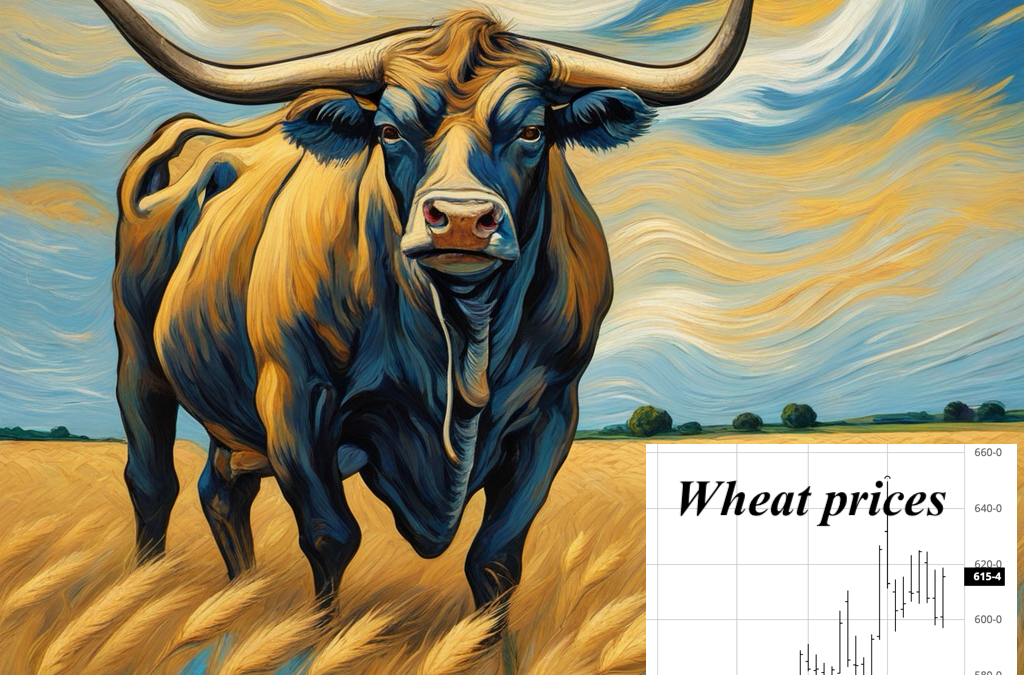
Our video below addresses three very important climatic teleconnections that may worsen the U.S. wheat crop in the weeks ahead. April and May are critical times for wheat crops in Europe, Ukraine, and most of the U.S.
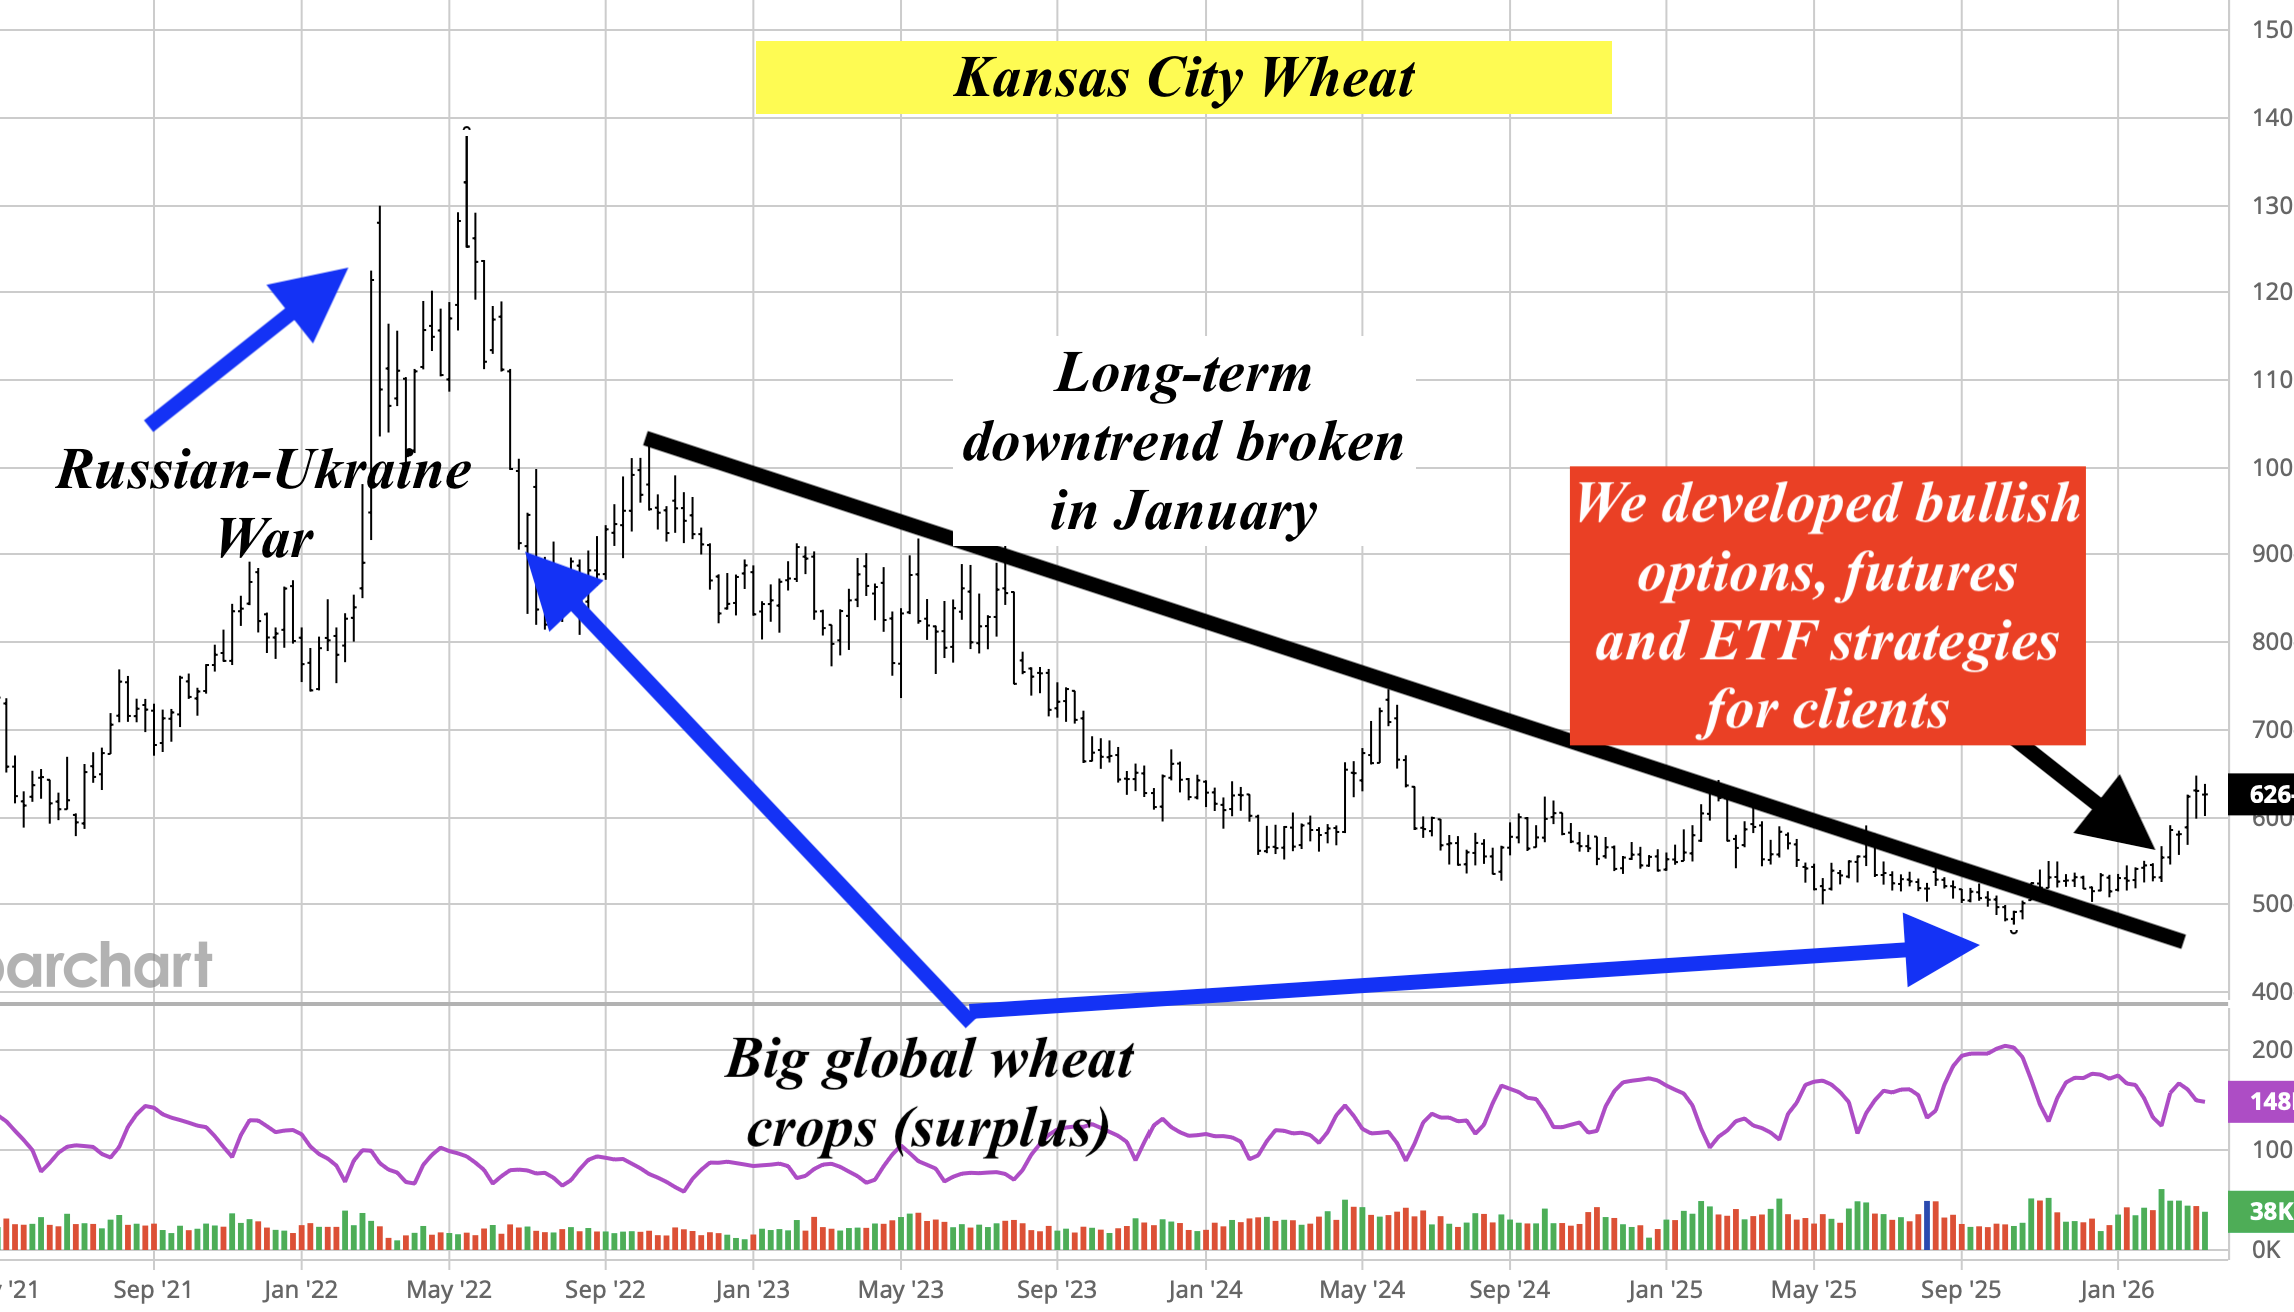
The key teleconnections that help us develop ETF, futures and option strategies for clients are: 1) A weakened La Niña; B) Lingering negative global atmospheric angular momentum (GLAAM) that can sometimes result in dryness for parts of the Midwest or the Plains; C) A major warm block (-WPO index) in northwestern Alaska that can bring occasional cold snaps to either the U.S. and/or Russia that could threaten wheat yields.
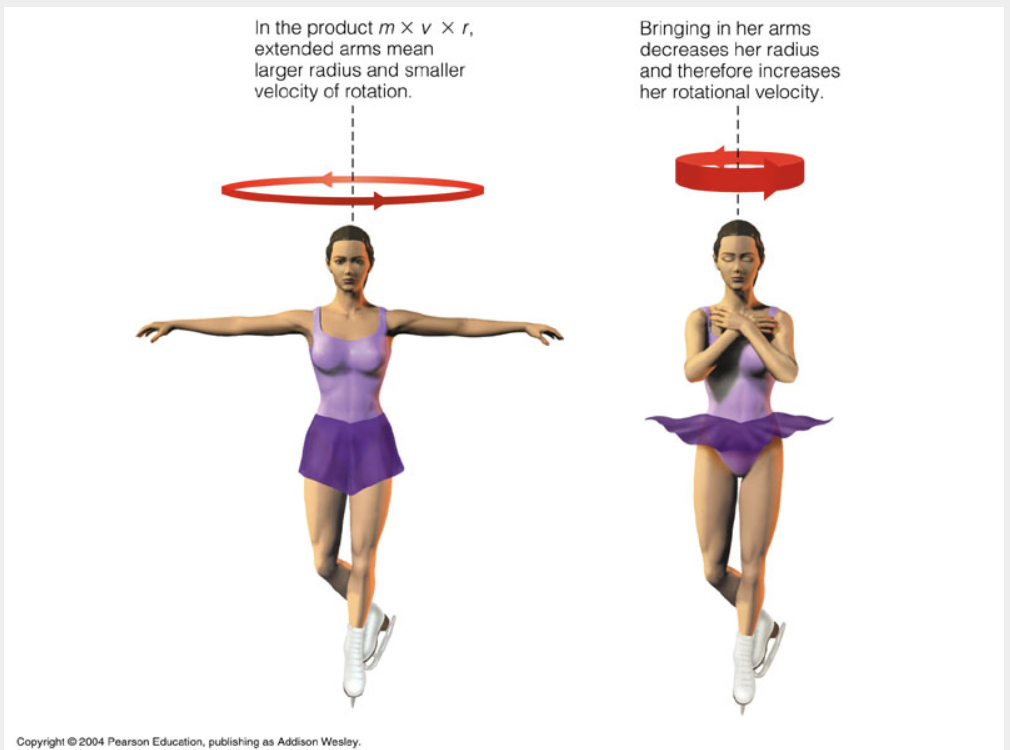
Source: Pearson Education
Global Atmospheric Angular Momentum (GLAAM) is a measure of the total rotation of the atmosphere relative to the Earth. When this index is negative, it indicates that the atmosphere is rotating more slowly (ice dancer on the left) than the Earth’s surface, typically resulting in easterly wind anomalies.
In the spring, a negative GLAAM phase often leads to dryness in the U.S. Great Plains wheat areas. The key point here is that even though La Niña has “officially” weakened to neutral, the atmosphere can still occasionally act as if La Niña is present when GLAAM is negative.
See this five minute video (below) that discusses the developing Plains drought and which factors we are watching.
Source: Jim Roemer & Google’s NOTEBOOK-LM
Other factors have influenced wheat prices, resulting in major volatility. They are:
The Middle East war and logistical issues in transporting wheat
The Russian war on Ukraine could lower Ukrainian wheat production
Recent heat stress to crops in India
The stronger U.S. dollar can sometimes hurt grain prices
by Jim Roemer – Meteorologist – Commodity Trading Advisor – Principal, Best Weather Inc. & Climate Predict – Publisher, Weather Wealth Newsletter
Scott Mathews, Editor
Weekend Report – May 9-11, 2025
Source: Screenshot by Climate Predict LLC – superimposed comments and markers by BestWeather – insert of Pacific Walker Circulation image by NOAA
While the grain futures have been mostly in a bear market, even with a weaker dollar, commodities from gold to cocoa and coffee continue in bull trends. Canola prices have really been perking up.
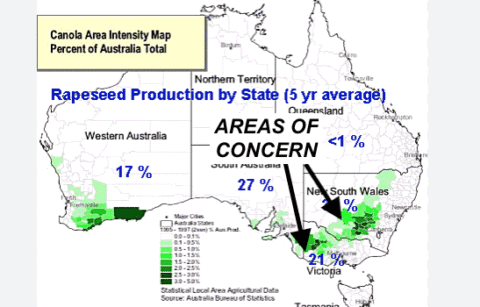
Potentially, there is a global weather problem as the drought in China is beginning to affect some crops in parts of southern Australia.
Below, I discuss how weather and the El Niño neutral stage (neither El Niño or La Niña) is affecting every commodity from wheat to ideal Midwest corn belt weather, previous crop problems in West African cocoa and why global sugar weather is improving. How about natural gas and a possible hot summer?
As a WeatherWealth newsletter subscriber, not only do you receive trading ideas, but you also see much more accurate weather information as we “second guess” standard weather models by looking at these 28 global weather teleconnections for all Ag and natural gas commodities.
—Enjoy Jim Roemer
Source: map by USDA
– commentary and indicator arrows added by BestWeather
Source: price graph by Barchart.com
– indicator arrow and superimposed wording by BestWeather
Source: screenshot by Climate Predict LLC
Source: screenshot by Climate Predict LLC with comments and indicator arrows superimposed by BestWeather
Source: map by Agri-Food Canada (a national information service)
Source: maps by stormvistawxmodels.com – used by permission- superimposed comment and indicator arrow by BestWeather
Source: map by WeatherBELL – used by permission
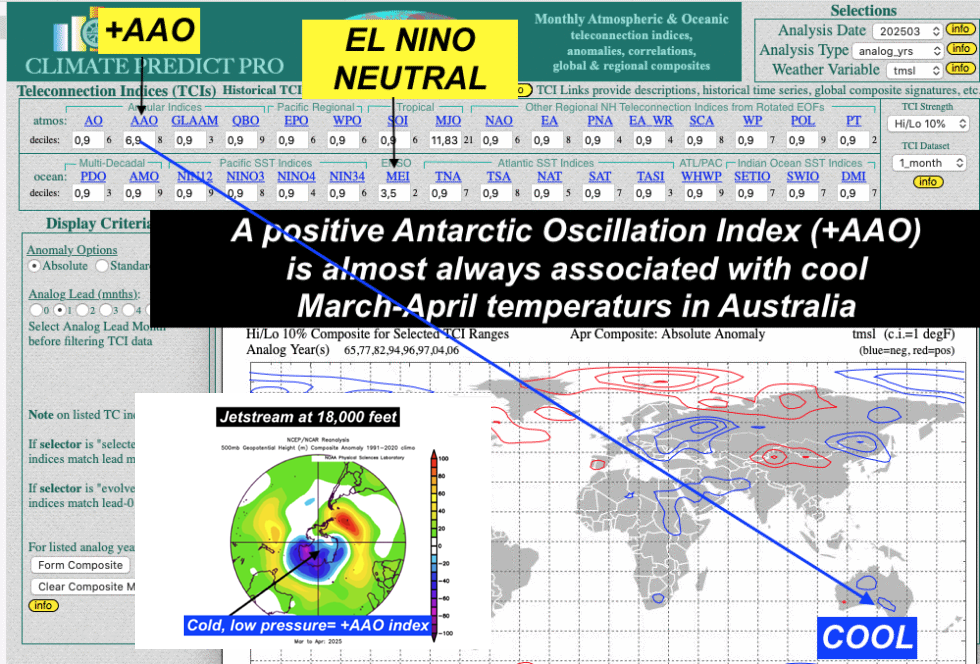
Sources: three screenshots above by Climate Predict LLC
– superimposed comments and indicator arrows by BestWeather
– antarctic polar projection map insert by NOAA, with superimposed markers by BestWeather
Source: maps by USDA, with indicator arrow superimposed by BestWeather
Source: map by WeatherBELL – used by permission
Source: maps by NOAA with superimposed labels and comments by BestWeather
Source: map by NOAA with superimposed arrow indicator by BestWeather
Sources: seasonality table by MRCI (used by permission), with superimposed elements by BestWeather- Map by stormvistawxmodels.com – used by permission – comments and indicators by BestWeather
Source: BestWeather Spider – royalty free natural gas flair photo by pexels.com
Artwork created via AI software DALL-E 3 and is the property of BestWeather
Thanks for your interest in commodity weather!!!
Mr. Roemer owns Best Weather Inc., offering weather-related blogs for commodity traders and farmers. He also is a co-founder of Climate Predict LLC, a detailed long-range global weather forecast tool. As one of the first meteorologists to become an NFA registered Commodity Trading Advisor, he has worked with major hedge funds, Midwest farmers, and individual traders for over 35 years. With a special emphasis on interpreting market psychology, coupled with his short and long-term trend forecasting in grains, softs, and the energy markets, he commands a unique standing among advisors in the commodity risk management industry.
This article contains syndicated content. We have not reviewed, approved, or endorsed the content, and may receive compensation for placement of the content on this site. For more information please view the Barchart Disclosure Policy here.
WEATHER WEALTH SAMPLE CONTENT
HELPING YOU MAKE THE BEST INVESTMENT DECISIONS BASED ON THE WEATHER
We use cookies to ensure that we give you the best experience on our website. If you continue to use this site we will assume that you are happy with it.