Probably the biggest blessing from the winter weather extremes experienced coast to coast this winter, is the end of multi-year California drought. This will go a long way to replenishing California water reserves, critical to farming and many other industries.
But the extreme flip in weather, from forest fires in 2018 to incessant winter snows and flooding all along the West coast, will still come at a tremendous economic cost.
My article below sheds light on how an oscillating El Nino signal and the PNA index has created extremely volatile winter weather and what the outlook may be for April based on the PNA flipping from negative to positive.
RECORD WESTERN SNOWS BLESS SKI RESORTS, WHILE SEVERE WEATHER THREATENS THE DEEP SOUTH
Mammoth Mountain California had close to 25 feet of snow in just a few weeks. The official 24 hour snowfall record for California was set during the El Nino of 1982, with 67 inches at Echo Summit. While the most total snowfall to accumulate in one calendar year was during the La Nina year from July 1998 to June 1999 at Mt. Baker ski area in Washington. The 19.3 inches of snow in February at Pendleton, Oregon broke a record set back during the El Nino “neutral year” of 1994. The point here is that western weather extremes do not always occur just with an El Nino.
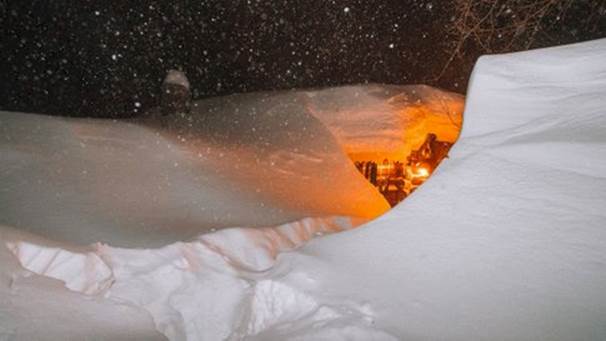
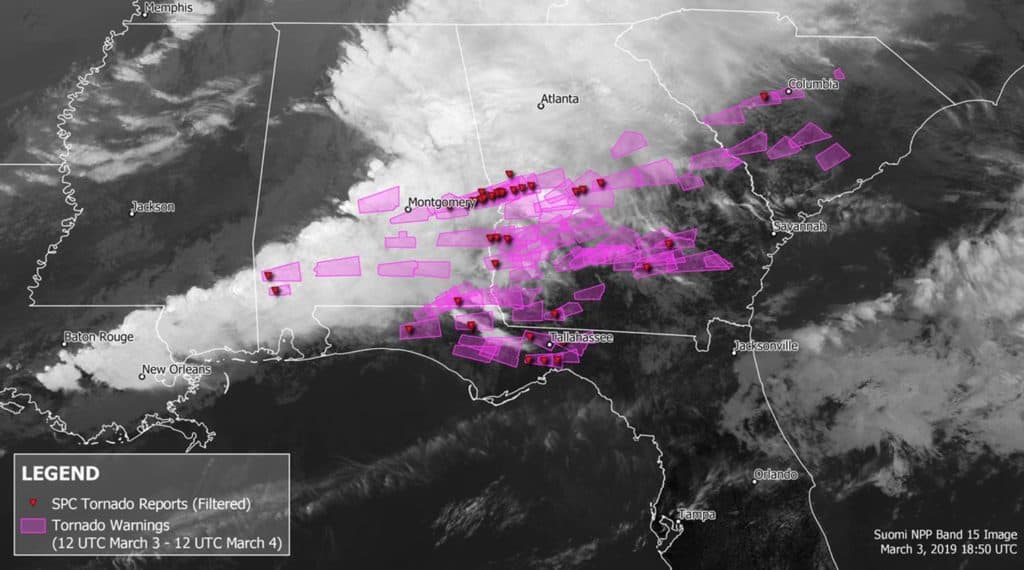
March has already started out extremely snowy out west, with blissful snowfall falling at many ski resorts like Snowbird, Utah and throughout dozen of other resorts out west. In contrast, however, an unusual outbreak of severe weather and tornadoes have dominated the southern United States. To see more about the recent outbreak of tornadoes click here
My research suggests a lot more severe weather to come in the coming weeks.
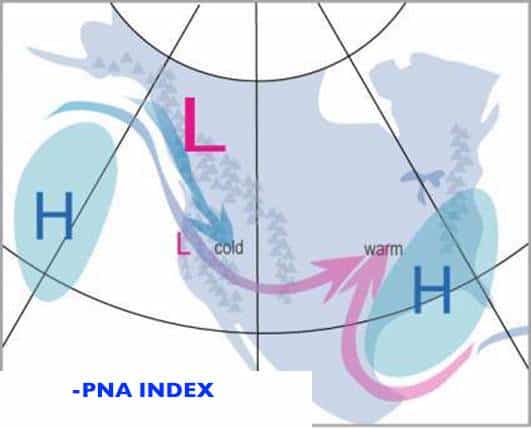
So what is causing all of this extreme weather? After all, El Nino is very weak and has ebbed and flowed all winter with no clear direct signal. Part of the reason has been a meteorological phenomenon of a negative Pacific North Atlantic Oscillation Index.
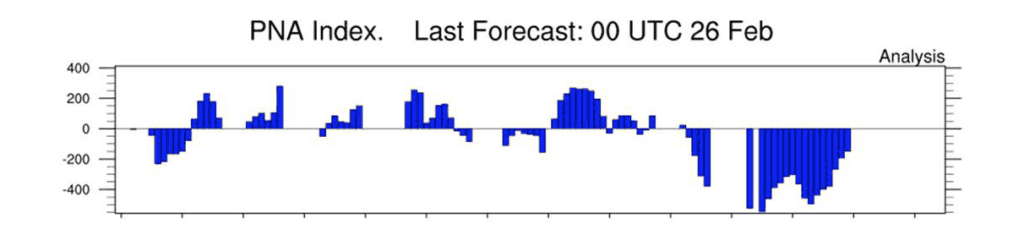
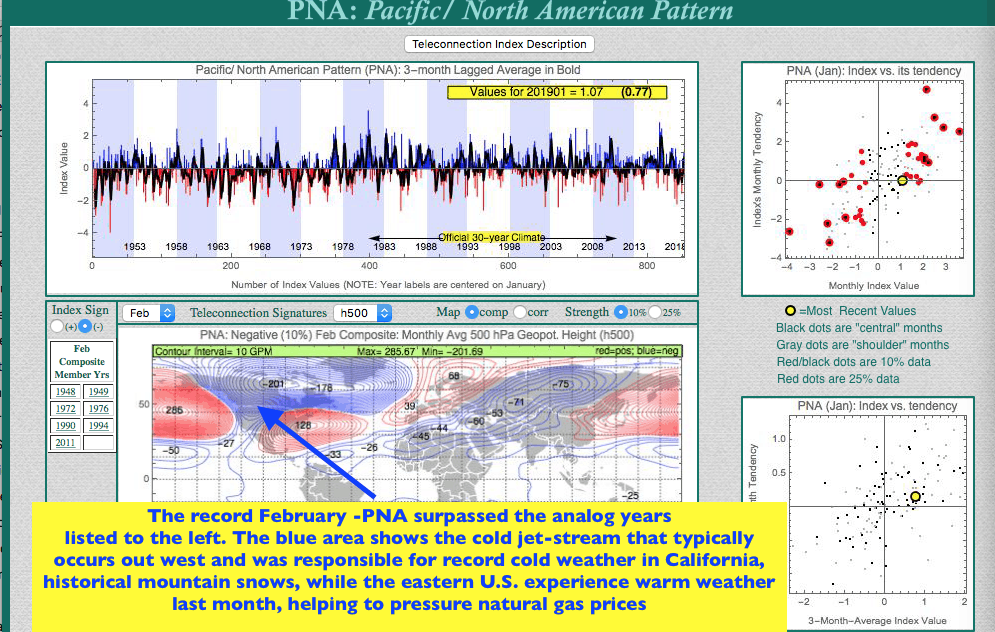
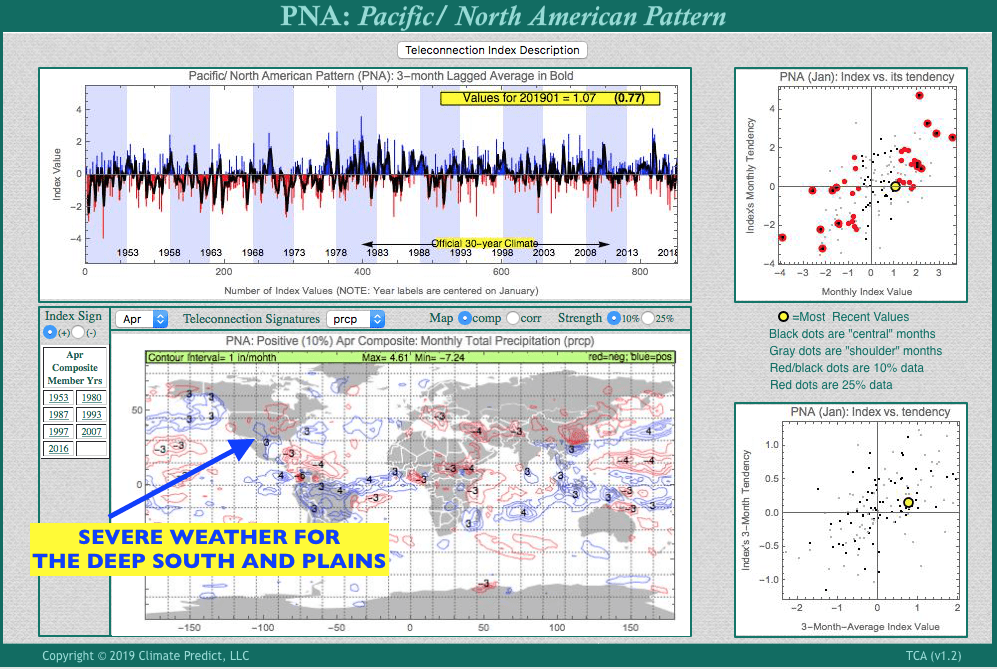
The PNA in February was the most negative in history helping to bring record cold and snows out west. Great for ski resorts. With the cold air bundled up out west last month, this pressured natural gas prices. However, this pattern has changed in early March.
Typical winter jet-stream pattern with a negative PNA index. February was the most negative on record and an “anomaly” of what typically happens during weak or strong El Nino events.
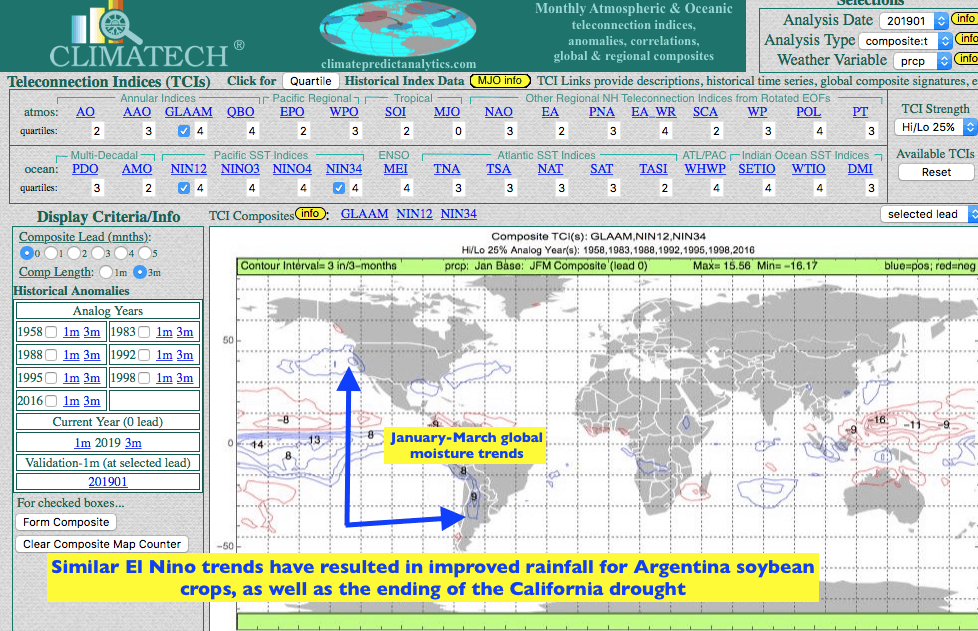
Climatech (below) illustrates how complex this winter’s weather pattern has been across the United States. Close scrutiny of analog years of both El Nino events top map) vs winters with extremely negative PNA values (2nd, bottom map), shows “no two analog years” the same. In other words, it has been extremely uncommon for the PNA index to be negative last month when an El Nino is present. This tells me that while occasional El Nino conditions have existed, globally, we really HAVE NOT had an official El Nino phenomenon.
Comparing all February analog years that had an extremely negative PNA (top map) and trends of some similar El Nino trends (bottom map), show that analog years between both of these teleconnections were completely different. This is extremely unusual and explains how unusual this winter’s weather pattern has been.
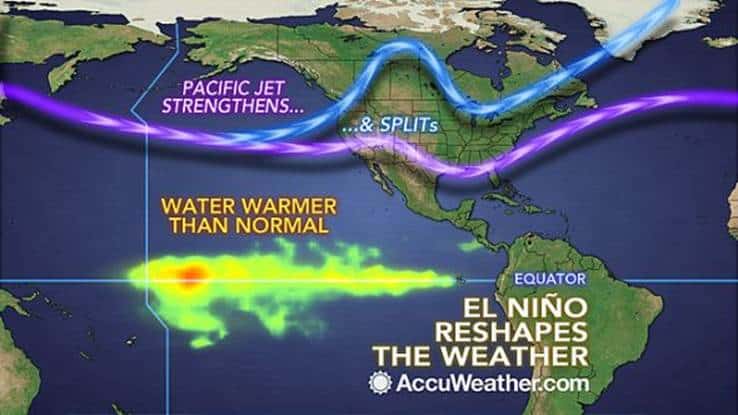
A very wet early spring is likely for much of the country and severe storm activity could really continue. While Tornado Alley (Kansas, Nebraska, Texas and Oklahoma) is most notorious for severe storms during spring, the lingering weak El Nino signal could result in more of a “split” flow in the jet-stream. This would open the door for more tornado activity in areas further east along the Mississippi, Gulf Coast and Southeast U.S. A nice graphic from Accu-Weather, reveals the typical El Nino type weather pattern during spring.
EARLY SPRING OUTLOOK BASED ON THE PNA INDEX FLIPPING.
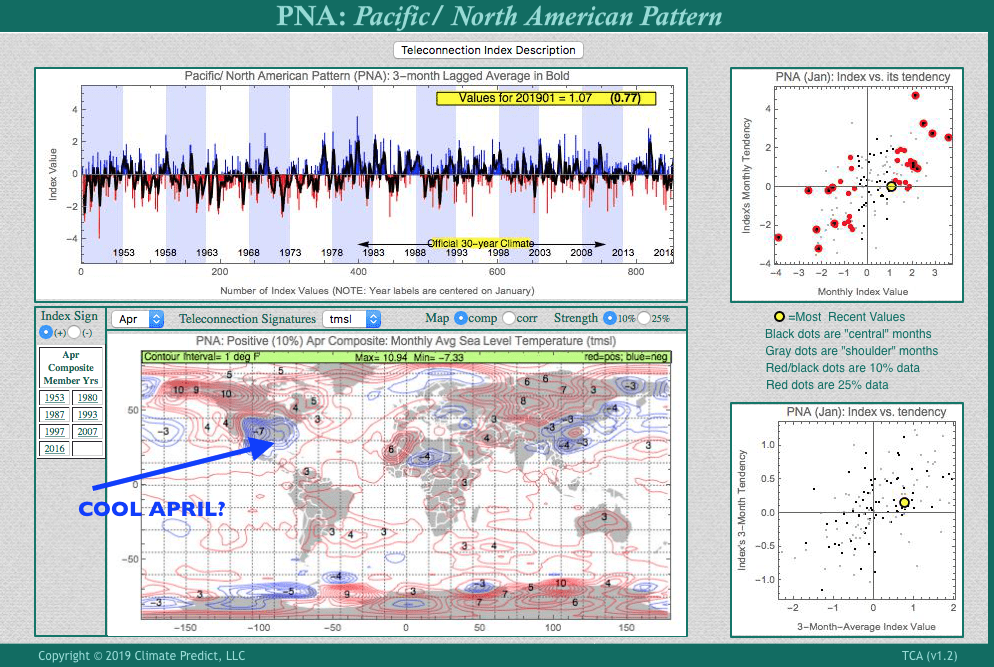
While I employ a ton of different long range weather forecast techniques, one particular teleconnection I have been looking at is the PNA index. Let’s focus in on those years which had the most historically negative February PNA values, which appears to be “flipping” to positive in March
NEGATIVE PNA values tend to flip come spring towards positive. If so, one can see the trend for April temperatures are cool for the southern and eastern U.S. with some of the analog years listed; weak El Nino events.
The Climatech chart above shows April rainfall trends when the PNA is positive, not negative, in April. One can see that above normal rainfall (blue) could dominate the deep south and the Plains. That portends an active severe weather season, with above normal tornadoes and potential planting delays for corn and cotton in the Deep South. In contrast, generally good spring conditions for winter wheat, in contrast to last springs drought from Kansas to Texas. In addition, Texas cotton production could make a big rebound barring any severe weather, hail damage during planting.
Models aside, we have been forecasting a cold U.S. winter for a while looking at a variety of factors from low solar to a weak El Nino Mokadi and Climatech now helps us compare historical weather events (such as the California drought or wet eastern U.S. summer and fall) to find analog years that match the current global teleconnection features.
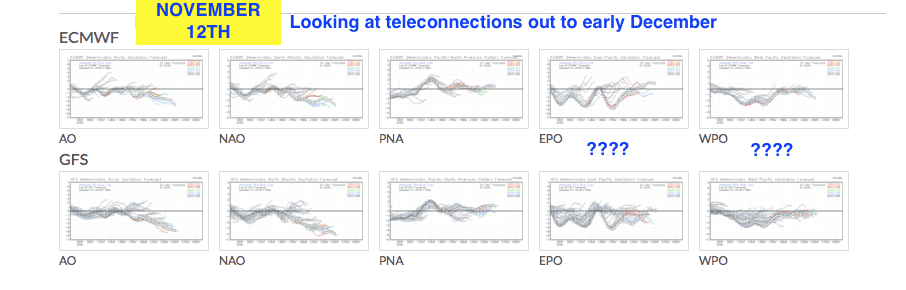
In this example below, we are faced with a small dilemma in early November of trying to figure out if the EPO and/or WPO index will be positive or negative in early December.
The AO/NAO index will be clearly negative, but what about the winter driving pattern of the EPO/WPO index?
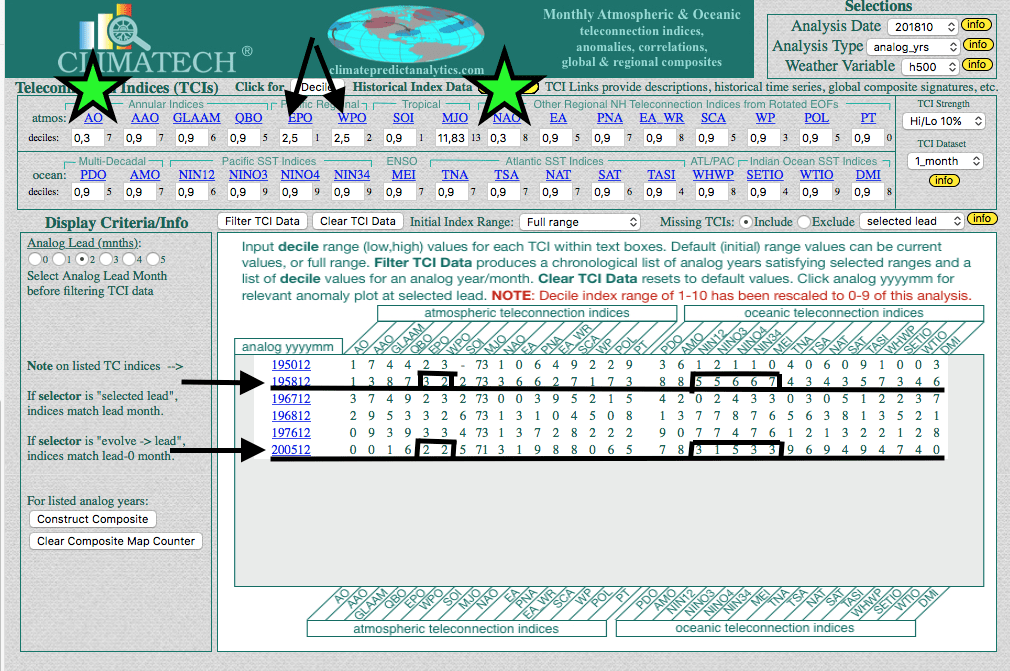
Our analog tool on Climatech lets us find the solution. The stars (charts below) illustrated are values I put in to show the AO/NAO index in the lowest 30% (most negative) range since 1950. I put the EPO/WPO somewhere in the middle between the 20-50% range. Out pop up the analog years with this scneario below it. December 1950; 1958; etc……
Notice only 2 analog years came up (1958/2005) when there was either an El Nino neutral or a weak El Nino.
From here you can see that in these two years the tendency was for the WPO index to be negative (a value of 2 and the (lowest 20-30%) based on the historical data base, and the EPO index at 3 (slightly negative and lowest 30-40%).
What does this tell us? That given the -AO/NAO pattern coming up and a neutral or weak EL Nino, that the WPO and/or EPO will have to at least slightly negative? The result would be a cold outlook for the eastern U.S. for December
CLIMATECH’S ANALOG TOOL (JUST ONE OF 6 TOOLS):
This helps all meteorologists 1)2nd guess computer models; 3) Predict weather and crop yields for crops and energy markets around the world, months in advance; 3) Gives major insurance, food and commodity companies a HUGE edge in forecasting weather risk and commodity market moves
(SHOWN ABOVE) ARE ANALOG YEARS WHEN THE NAO/AO IS NEGATIVE BY EARLY DECEMBER AND WHY THE EPO/WPO INDEX WILL TREND NEGATIVE IN DECEMBER RESULTING IN A COLD SOLUTION
Below you will see a sample of what you will receive each week. This particular report was written in June and caught the bear move down in several commodities such as corn and soybeans. Wheat currently has a bullish signal that has been updated in our most recent issues in the last couple of weeks.
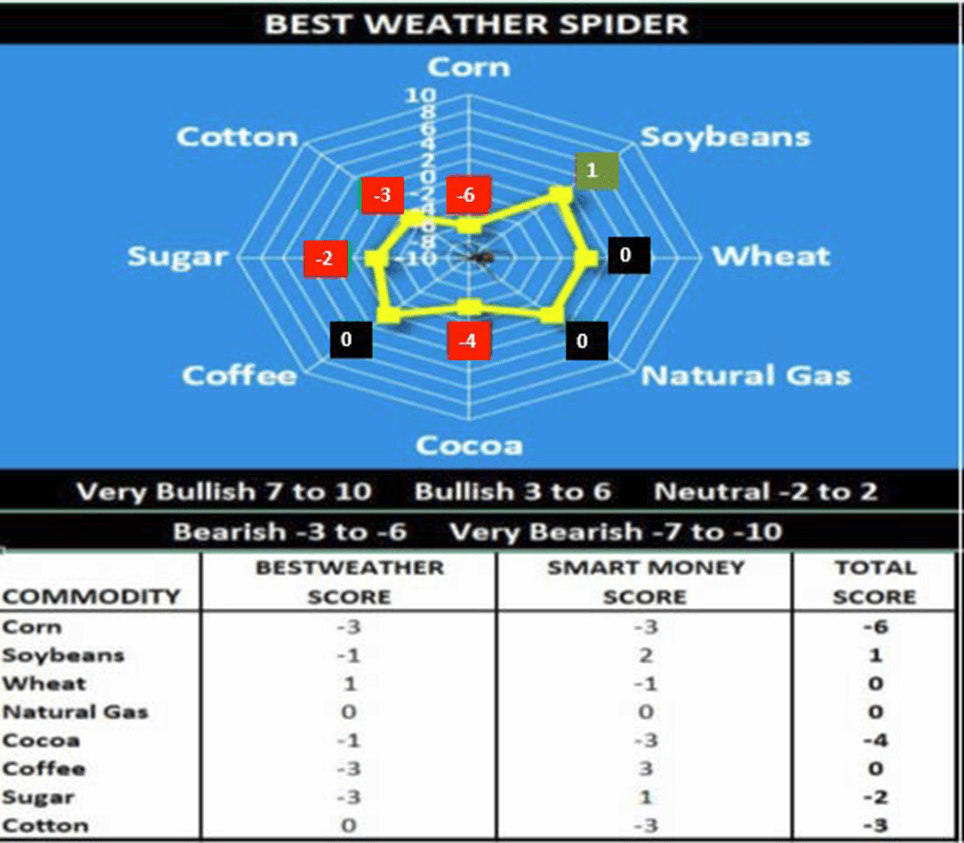
Climatelligence Rankings Spider (excerpt from the 6/20/18 issue)
The Climatelligence rankings tables were created by Jim Roemer and Shawn Hackett to help commodity traders, farmers and agribusinesses quantify the influence that U.S./global weather and capital flows have on the prices of agricultural products. The Climatelligence rankings (below) weight weather (Climatech/BestWeather) and capital flows (Informed Smart Money Algorithm) equally to formulate bullish and bearish readings.
Commodities Overview
(as published on 6/20/18)
Soybeans: (+1) Like many Ag commodities, soybeans got caught up in the on-going trade war with China. Close to 70% of all U.S. soybean exports go to China. Ideal Midwest weather keeps us bearish, but farmers should hold off making additional sales due to at least one potential weather scare and the possibility of an over-reaction on the trade war news.
Corn: (-6) In contrast to many other analysts, we became bearish corn a few weeks ago around $4.10 due to the heavy long position and ideal early season growing conditions. We advised farmers sell 50% of their 2018 crop either with put options or by shorting forward contracts.
Wheat: (0) Seasonal harvest pressure may offset some of the weather issues for crops in Russia and Australia for now.
Cocoa: (-4) A volatile market since the winter, the potential for El Niño later this year and stronger grind data out of Europe and Asia keeps us slightly bullish at these price levels.
Cotton: (-3) Trade war concerns are keeping us from being overall bullish, as well as seasonally lower prices during post La Niña years, as winter nears. However, tight global stocks and the on-going drought in Texas keeps us slightly bullish.
Coffee: (0) No freeze for Brazil and big global stocks has kept us slightly bearish. However, dryness developing in Brazil, plus a heavy short position in the market and SMART MONEY’s more neutral bias, have somewhat lessened our bearish stance. A potential bull market could ensue later for Brazil, due to El Niño.
Sugar: (-2) Prices got caught up in the crashing Brazilian Real. Huge global supplies and benign weather this past year helped us become bearish around 20 cents about a year ago. However, the heavy short position in the market and potential Pre-El Niño dry concerns in Brazil, could affect the third quarter sugar cane crop.
Focus on Coffee (as per the 6/20/18 issue)
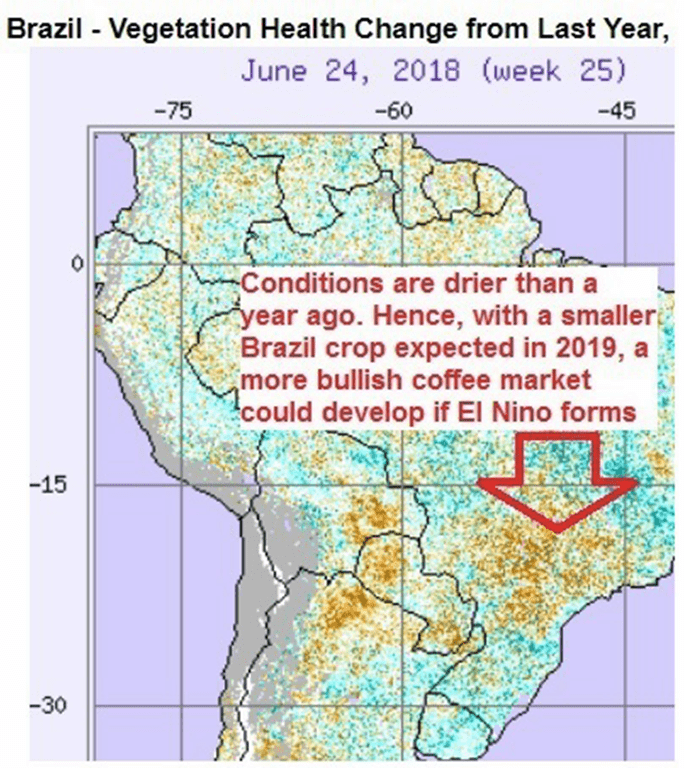
Coffee has always been one of the most sensitive Ag markets to movements in the Brazilian Real. While a heavy speculative short position exists in the market and Smart Money suggests a possible buy, the weather in both Colombia and Brazil continue to be mostly beneficial with no freeze scares for now. The Bestweather weather spider score is slightly bearish (-3), while the Smart Money score is +3, netting to a zero score. Nevertheless, growing dryness in northern Brazil could cause concern for the 2019 crop turning us more bullish, soon.
Brazil’s Vegetative Health – According to BestWeather:
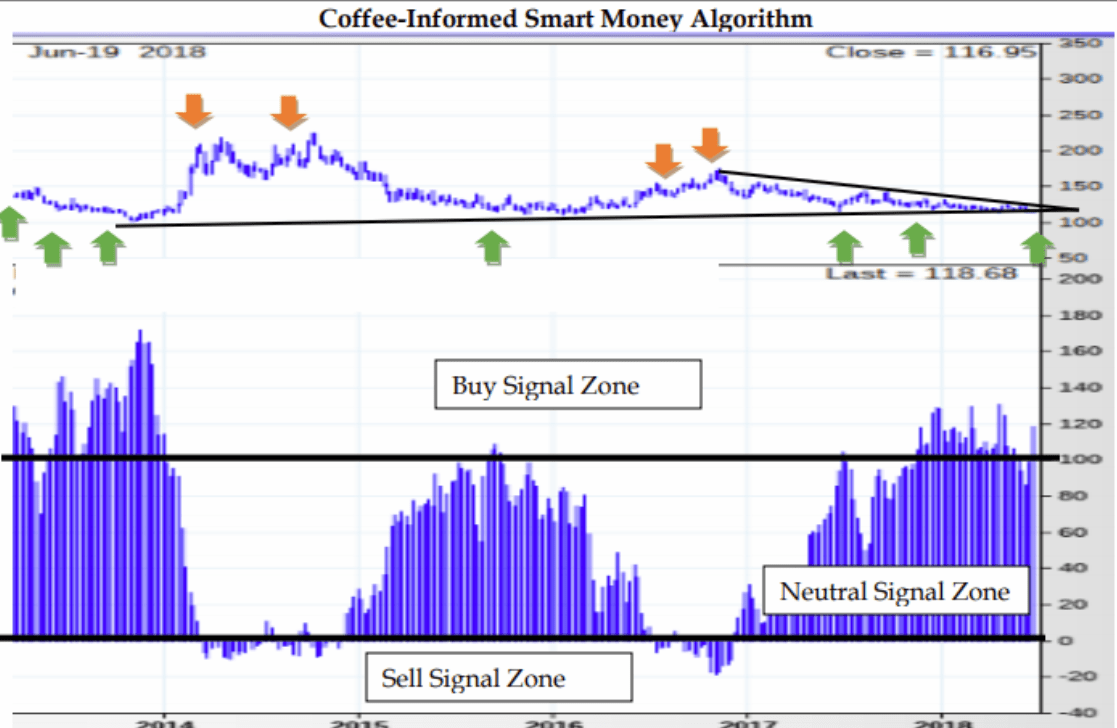
The blue lines above show the Smart Money Chart, developed by Shawn Hackett. It has to do with a complex Algorithm related to the commitment of traders reports (“COT”), seasonality and technical factors. One can see that coffee is slowly edging into the buy zone. It will take fundamental weather related weather issues to cause a strong buy signal, but this could well happen, by the fall. The Brazilian Real may be be bottoming out, as well.
Smart Money Summation (6/20/18):
A new informed smart money indicator algorithm buy signal has been triggered in the coffee market. We have seen a series of buy signals over the last year whenever prices have fallen under $1.20/pound. Given the historical upside volatile nature of coffee price rallies, patience is usually a virtue. This supports optimism on an intermediate term basis and meshes well with our longer term bullish weather outlook. End users, longer term hedgers and positional traders should be considering protecting upside price risks at this time.
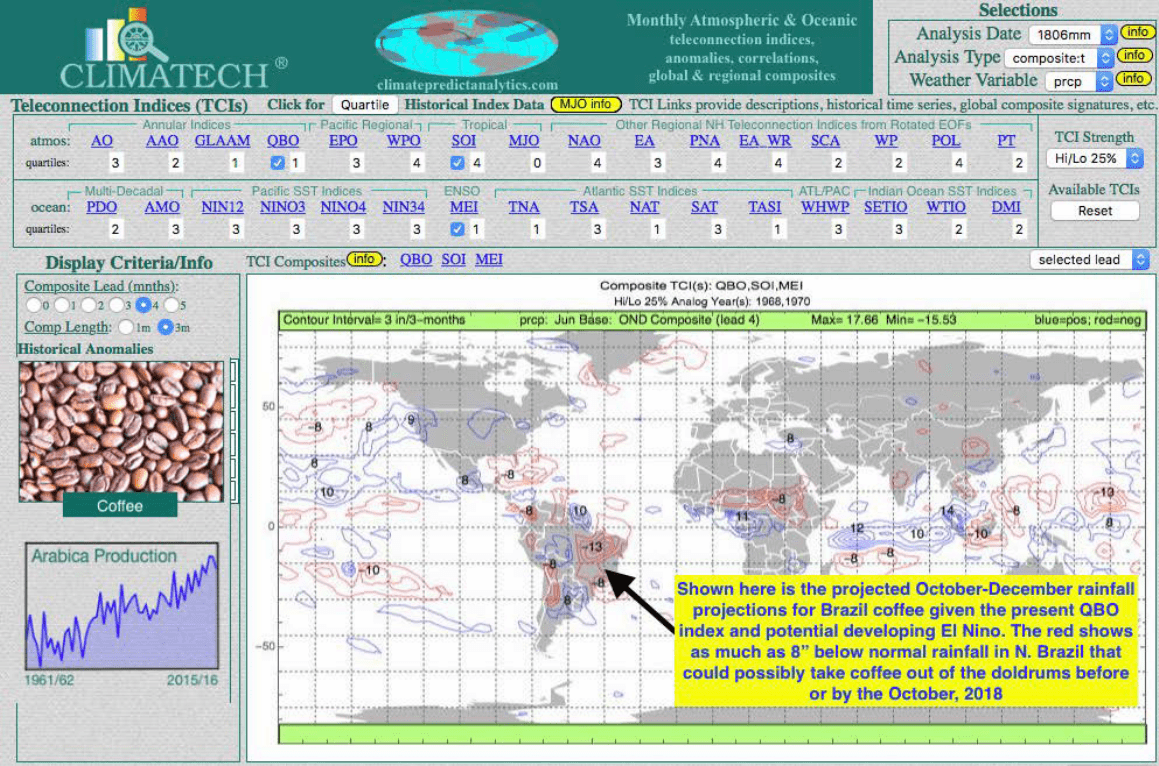
Climatech (6/20/18):
Our proprietary long, range weather forecast software illustrates below the potential for some fall dryness to the Brazil coffee crop later this year. The three checked boxes represent one solution our program comes up with. Climatech found some of the most important “similar” teleconnections (https://en.wikipedia.org/wiki/Teleconnection) critical to Brazil’s coffee weather. Currently, the very negative QBO index (stratospheric winds blowing east to west (https://en.wikipedia.org/wiki/Quasibiennial_oscillation) and a similar weakening La Niña that may turn into an El Niño Modoki later this summer or fall.
Coffee Conclusion on June 20, 2018
The Climatelligence rankings table above shows a neutral bias in coffee. The score combines both present weather fundamentals, which have been bearish (-3) and the Shawn Hackett Smart Money algorithm that is a (+3) and turning bullish.
The Smart Money algorithm is based on the heavy short position in the market and seasonal factors that portend possibly higher prices in the months ahead. In addition, the Brazil Real seems to be bottoming that could help coffee later this summer or fall. Our bias is for traders to begin looking at the long side of coffee, in a longer term call option position expecting some sort of rally later this fall.
FOR MORE INFORMATION ABOUT OUR SERVICE, CLICK HERE
The statements below also apply to The Climatelligence Report, BestWeather, Inc. and Jim Roemer The information, tools and material presented on HACKETTADVISORS.COM (this web site), in the HACKETT MONEY FLOW REPORT and in the HACKETT STOCK REPORT are provided for informational purposes only and are not to be used or considered as an offer or a solicitation to sell or an offer or solicitation to buy or subscribe for securities, investment products or other financial instruments, nor to constitute any advice or recommendation with respect to such securities, investment products or other financial instruments. The information presented on HACKETTADVISORS.COM (this web site), in the HACKETT MONEY FLOW REPORT and in the HACKETT STOCK REPORT is prepared for general circulation. It does not have regard to the specific investment objectives, financial situation and the particular needs of any specific person who may receive this information. You should independently evaluate particular investments and consult an independent financial adviser before making any investments or entering into any transaction in relation to any securities mentioned on HACKETTADVISORS.COM (this web site), in the HACKETT MONEY FLOW REPORT and in the HACKETT STOCK REPORT. The use of HACKETADVISORS.COM is at your own sole risk. HACKETTADVISORS.COM is provided on an “as is” and “as available” basis. Hackett Financial Advisors, Inc. makes no warranty that HACKETTADVISORS.COM will be uninterrupted, timely, secure or error free. No charts, graphs, formulae, theories or methods of securities analysis can guarantee profitable results. This document does not purport to be a complete description of the securities or commodities, market or developments to which reference is made. The information contained in HACKETTADVISORS.COM (this website), in the HACKETT MONEYFLOW REPORT and in the HACKETT STOCK REPORT has been taken from trade and statistical services and other sources, which we believe are reliable. Hackett Financial Advisors, Inc. does not guarantee that such information is accurate or complete and it should not be relied upon as such. The HACKETT MONEY FLOW REPORT and the HACKETT STOCK REPORT are written as weekly tools to help investors make better financial decisions. Any opinions expressed reflect judgments at this date and are subject to change without notice. The principals of Hackett Financial Advisors, Inc. and others associated or affiliated with it may recommend or have positions which may not be consistent with the recommendations made. Each of these persons exercises judgment in trading and readers are urged to exercise their own judgment in trading. Past Performance is not indicative of future results. . FUTURES AND COMMODITIES TRADING AND STOCK INVESTING AND TRADING INVOLVES SIGNIFICANT RISK AND IS NOT SUITABLE FOR EVERY INVESTOR. INFORMATION CONTAINED HEREIN IS STRICTLY THE OPINION OF ITS AUTHOR AND IS INTENDED FOR INFORMATIONAL PURPOSES AND IS NOT TO BE CONSTRUED AS AN OFFER TO SELL OR A SOLICITATION TO BUY OR TRADE IN ANY COMMODITY OR SECURITY MENTIONED HEREIN. INFORMATION IS OBTAINED FROM SOURCES BELIEVED RELIABLE, BUT IS IN NO WAY GUARANTEED. OPINIONS, MARKET DATA AND RECOMMENDATIONS ARE SUBJECT TO CHANGE AT ANY TIME. PAST RESULTS ARE NOT INDICATIVE OF FUTURE RESULTS.
This material has been prepared by a sales or trading employee or agent of Hackett Financial Advisors Inc. and is, or is, a solicitation. This material is not a research report prepared by R.J. O’Brien’s Research Department. By accepting this communication, you agree that you are an experienced user of the futures markets, capable of making independent trading decisions, and agree that you are not, and will not, rely solely on this communication in making trading decisions. DISTRIBUTION IN SOME JURISDICTIONS MAY BE PROHIBITED OR RESTRICTED BY LAW. PERSONS IN POSSESSION OF THIS COMMUNICATION INDIRECTLY SHOULD INFORM THEMSELVES ABOUT AND OBSERVE ANY SUCH PROHIBITION OR RESTRICTIONS. TO THE EXTENT THAT YOU HAVE RECEIVED THIS COMMUNICATION INDIRECTLY AND SOLICITATIONS ARE PROHIBITED IN YOUR JURISDICTION WITHOUT REGISTRATION, THE MARKET COMMENTARY IN THIS COMMUNICATION SHOULD NOT BE CONSIDERED A SOLICITATION. The risk of loss in trading futures and/or options is substantial and each investor and/or trader must consider whether this is a suitable investment. Past performance, whether actual or indicated by simulated historical tests of strategies, is not indicative of future results. Trading advice is based on information taken from trades and statistical services and other sources that Hackett Financial Advisors Inc. believes are reliable. We do not guarantee that such information is accurate or complete and it should not be relied upon as such. Trading advice reflects our good faith judgment at a specific time and is subject to change without notice. There is no guarantee that the advice we give will result in profitable trades.
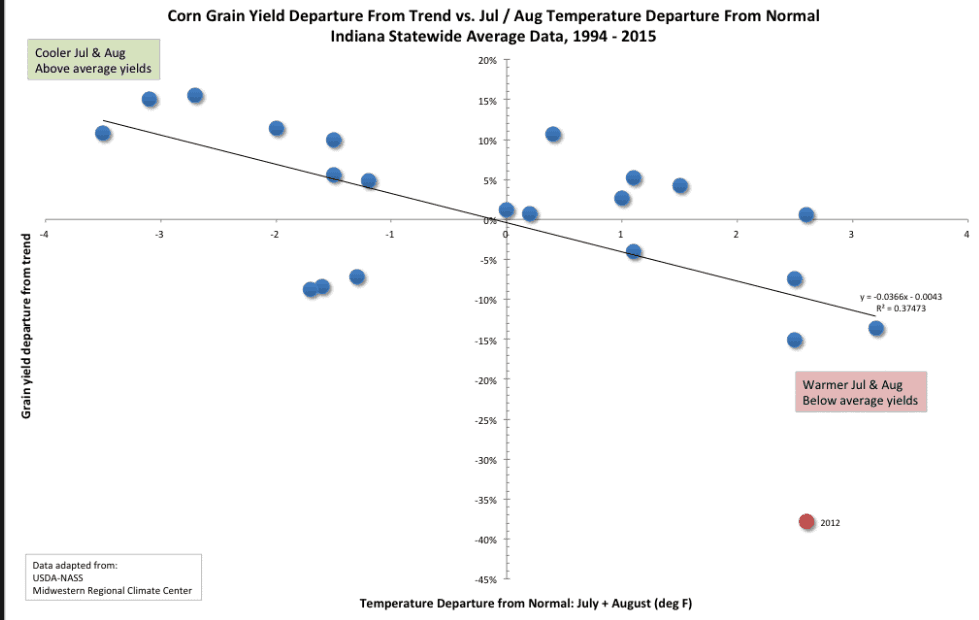
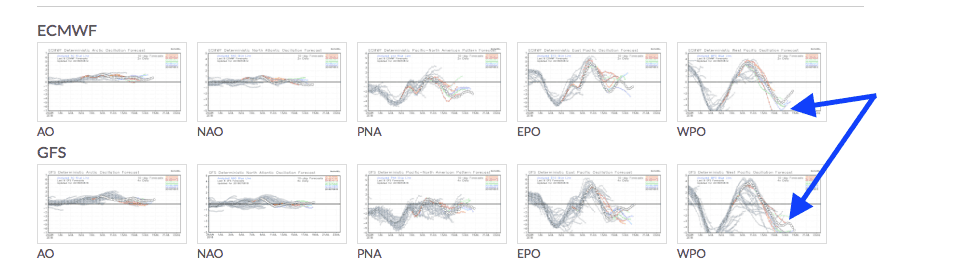
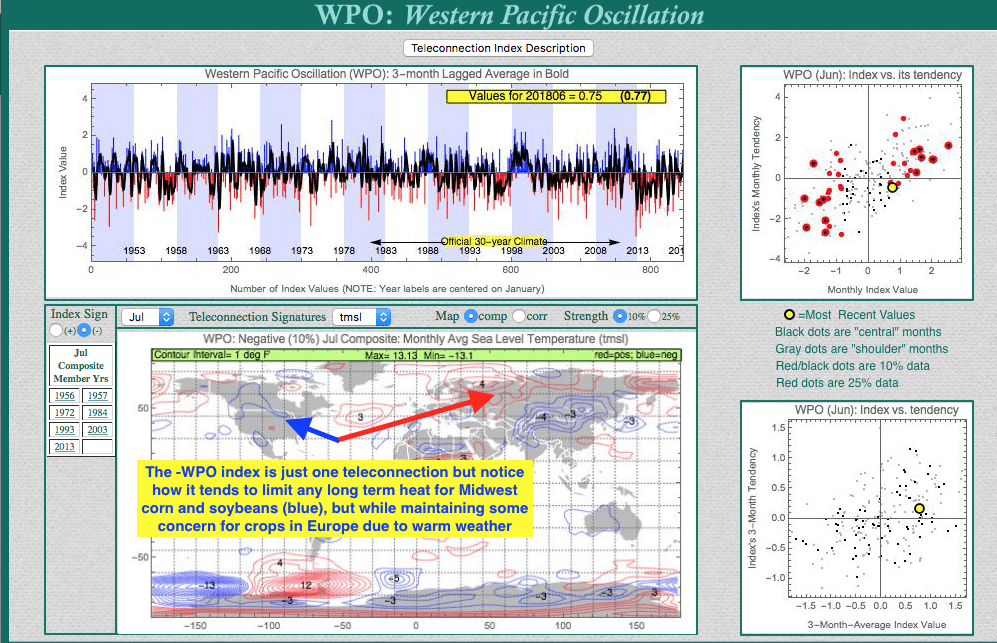
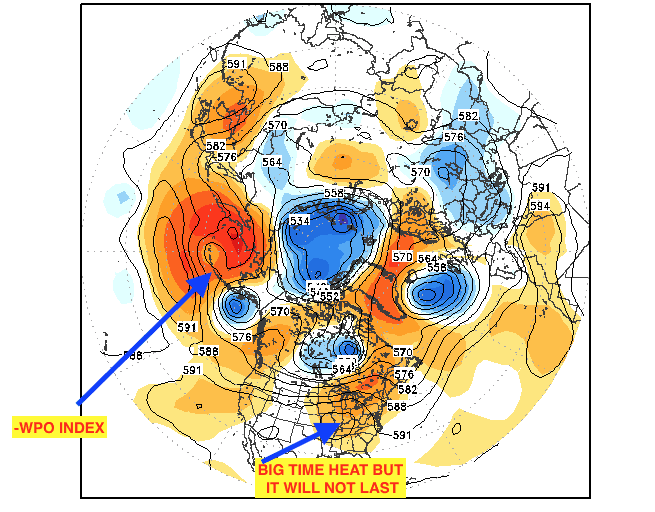
There has been some talk about lower corn yields in the Midwest. This stems from warm night-time low temperatures. As shown in the maps below, something we call a negative WPO (Western Pacific Oscillation index) is just one among several teleconnections that will NOT result in any prolonged Midwest heat in July. The bottom line is that U.S. corn yields are heading towards a record that may be close to 180 bushels per acre. Ideal conditions also apply for soybeans.
For more information about how you can soon purchase a subscription to a unique weather-commodity newsletter and get the very best short and longer term weather forecasts and market sentiment in the industry, please email us at:
While not cool weather by any means, ample soil moisture and generally normal to above normal Midwest temperatures during the critical pollination is still ideal for Midwest crops
The WPO index (blue arrows) will go off the scale to negative territory as we head deeper into July. We alerted clients about this last week. CLIMATECH, our proprietary program, shows why sustained hot weather will not continue in the Midwest. It also shows why Europe will have some hot weather and potential lower wheat yields.
SARASOTA, Fla.—(BUSINESS WIRE)–Commodity markets across the globe will be greatly affected by weather and crop conditions in the months ahead.
Most recently:
Droughts were devastating wheat crops
Cotton prices were making new highs on weather issues in Texas and China (though Trade War concerns and some rains in Texas have caused a short-term sell off)
Hurricane season is fast approaching (Mr. Roemer’s research suggest a weaker than normal season)
Months in advance, CLIMATECH® has assisted hedge funds and companies in the insurance and food industries to anticipate weather issues and price movements. It is also a highly effective tool in school and university classes and labs by teaching students about climate change, and how climatic events that are thousands of miles away can help predict the weather with more precision.
“Teleconnections and analogs” are the key elements in a new hurricane feature that greatly improves accuracy in predicting hurricane tracks and intensities.
“We are very excited about our new hurricane module, which can be used across multiple industries. Our product is a “must” for any meteorologist. We are working to find the “Holy Grail” in long-range weather forecasting,” saidJames Roemer– President of BestWeather, Inc.
CLIMATECH® subscribers will receive updated teleconnection data twice a month with many other features that help determine long range weather trends impacting various industries.
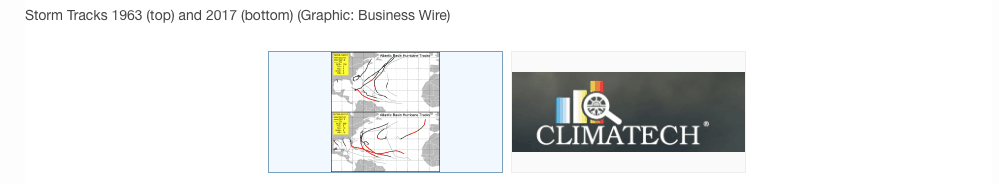
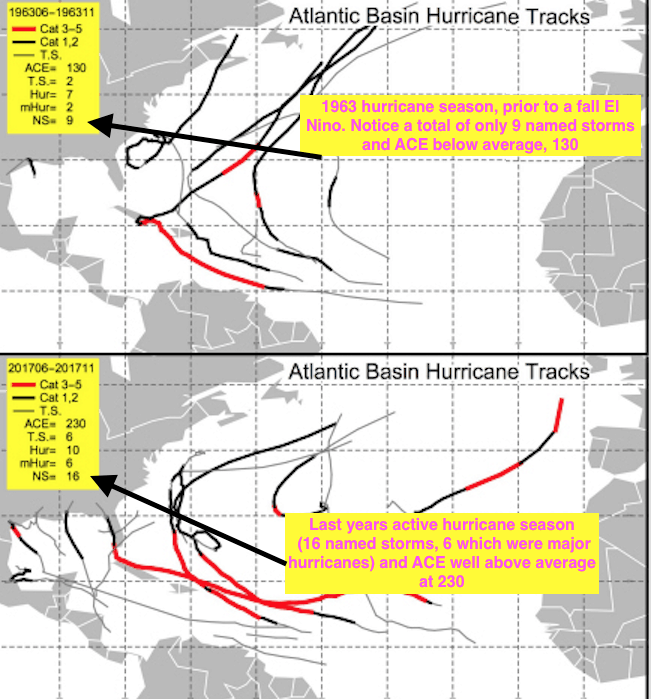
For comparisons to current conditions, two of the most significant analog years identified by CLIMATECH® for hurricanes are 1963 and 2017(shown above). The 1963 teleconnections having the greatest similarity to those prevailing today are:
The negative QBO index (winds some 30-50 MPH up in the atmosphere that are blowing from east to west)
Neutral El Nino conditions (La Nina has weakened)
The cool ocean temperatures in the South Atlantic (this tends to reduce hurricane activity)
Notice that in 1963, total Accumulated Cyclone Energy (ACE) was 130. This is below historical standards and much less than in 2017, when total ACE was 230 with 16 named storms, 6 of which were major hurricanes. Our expectation is that the hurricane season will be weaker than the historical averages, with the Gulf coast likely NOT having a major strike this year. For additional information about hurricane impact on commodities, and our analog years, please visit our blog page at https://www.bestweatherinc.com/best-blog/.
To inquire about CLIMATECH® subscriptions, and for information about a unique weather/commodity investment newsletter that we will begin offering this summer, please email us at the address below.
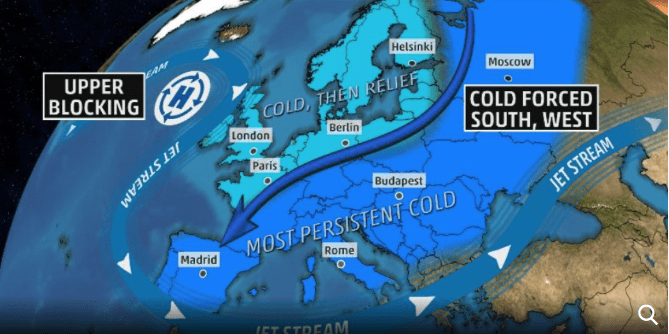
The warming Arctic this winter has resulted in incredibly cold weather in parts of Europe and Northeast Asia. Another symptom has been unusual March snowstorms in the Northeast U.S., the likes of which are unprecedented. Although four Nor’easters have clobbered the Eastern U.S., I do not agree with the forecasters who attribute this to La Niña.
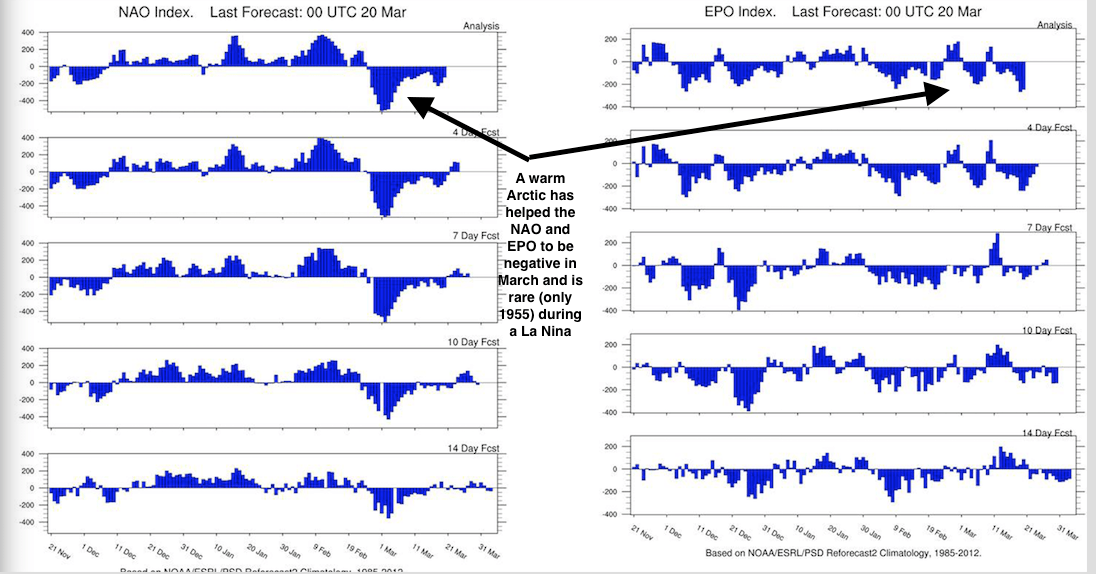
Once again, the “warming planet” signals are the handwriting on the wall. They read “the Arctic is warming” and “the Atlantic ocean temperatures are rising.” As far as the energy markets are concerned, the UK natural gas futures contract reacted extremely to the cold weather. The U.S. has not had nearly the consistent cold winter as observed in Europe. The negative NAO. Index (warm block near Greenland) and warming near Alaska (negative EPO) have resulted in this “Beast from the East”. For more information about this incredible European cold and some changing feelings about global warming, Please click the following link: Here
a rare coincidence of the NAO and EPO indices
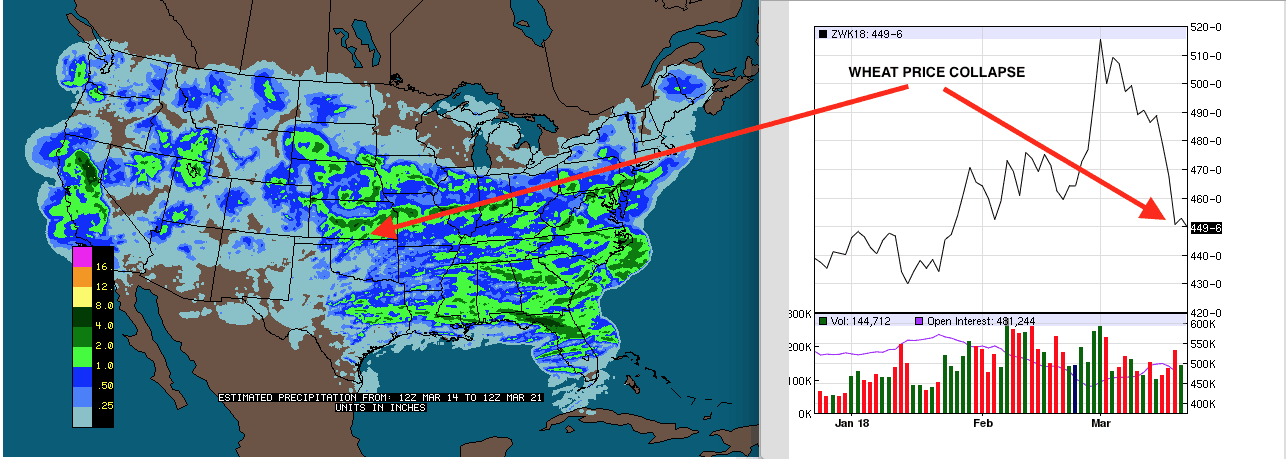
WHEAT PRICE COLLAPSE DUE TO SUDDEN SHIFT IN U.S. PLAINS DROUGHT
Wheat prices have had a steady climb during January and February, as the chart reveals below (right). However, it usually takes some other weather disaster somewhere in the world to have a longer term bull market in wheat prices. Two fundamental factors are brewing in the world of wheat:
a) The U.S. has not been competitive in the world market, and
b) Russia is sitting on huge global stocks.
These realities began to increase wheat market volatility long before we changed our forecast views presented to private clients on March 15th. We issued a heightened alarm for a potential easing of the Plains drought.
Due to weather factors not related to La Niña, there has been a precipitous drop in wheat prices.
CLIMATECH (below) shows how the present La Niña is similar to 1955. Back then, “normal” dryness continued in the Plains wheat areas (red). Based on these teleconnections below, this should have happened. However, computer models, along with our forecast, began changing on March 15th. This prompted us to alert private clients about a potential change in wheat price direction. If you would like more information, please email us at
As wheat prices have taken it on the chin, one of the lone bull markets in agricultural commodities recently has been in cocoa. Dry, hot weather did cause some minor reduction in the west Africa cocoa crop this winter. This is quite is unusual for La Niña. However, the main reason for the bull move is far too many short futures positions. This high level of commercial hedges are bumping up against rising global demand. In addition, there is press coverage pointing out that cocoa farmers in Ghana will see lower production in coming years due to the “illegal gold mining boom.”
Here is an excerpt from the current issue of National Geographic:
“Gold mining has always been a part of Ghana, from the ornate jewelry of the Ashanti kings to British colonization. In the last several years, largely unregulated galamsey (informal, illegal) mining has ramped up, due in part to Chinese investors who bring in sophisticated equipment and a lagging economy that makes the prospect of striking gold too sweet to pass. These often illegal operations can result in contaminated water, deforestation, and a rise in violent crime.”
“In 2011, Ghana produced a record-setting amount of cocoa, weighing in at over one million tonnes. Since then, as illegal mining steadily ramped up, cocoa production has trended downwards, with a drop to 740,000 tonnes in 2015.”
For the full, interesting article about this from National Geographic, please click here
HELPING YOU MAKE THE BEST INVESTMENT DECISIONS BASED ON THE WEATHER
We use cookies to ensure that we give you the best experience on our website. If you continue to use this site we will assume that you are happy with it.OkPrivacy policy