US farmers have not been able to get a break. First it was the Trade War that shows no signs of ending anytime soon, then this past spring was one of the wettest on record compromising millions of acres of US corn and soybean crops. Nevertheless, poor global demand and a generally non threatening global summer has kept prices of most agricultural commodities in a sideways to lower price trend.
There was a very interesting story on 10/6 on “60 minutes” with regards to the difficulties American farmers are having, as well as new technologies that may change the way farmers assess crop yields and how they grow their crops. For this very interesting story, please click here.
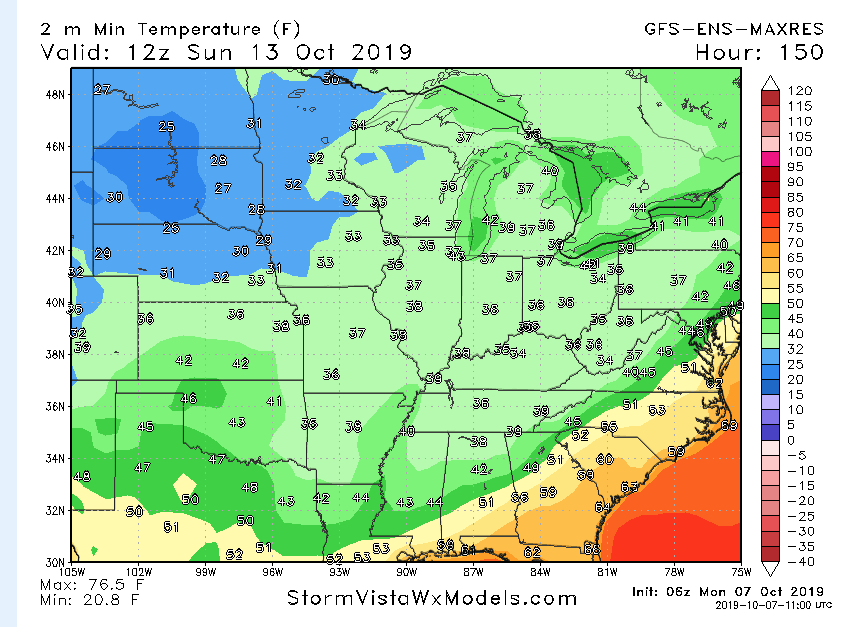
The normal first frost date in the NW corn belt and northern plains is usually in late September. Hence, normally the temperature forecast you see above would not be a big deal for crops. However, a wet spring and cool summer could still jeopardize some 5-10% of the corn, and a smaller extent soybeans, in the areas shaded in blue (frost-freeze). This area will also see 30-50 mph winds later this week and some snow causing more havoc for far NW corn belt farmers.
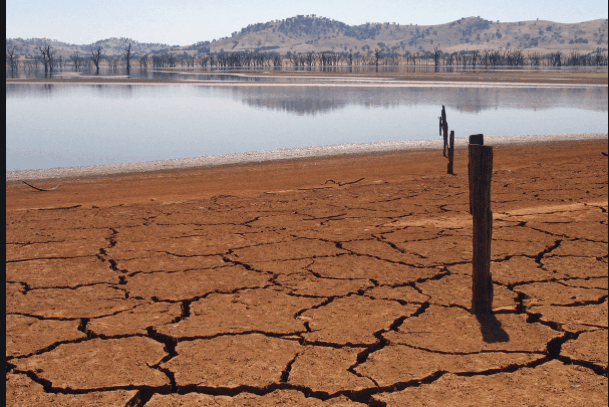
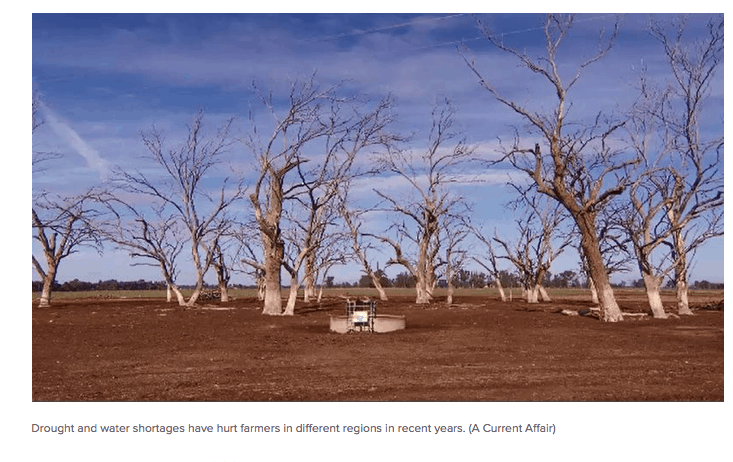
Australia seeing a different plight– a once in 120 year drought
One of the worst standing Australia droughts in history occurred during an 8 year period between 1895 to 1903. These droughts had a devastating effect on Australia’s economy and resulted in more than 50% of all cattle and sheep being lost. Then came the droughts from 2001-2009 which devastated one community after another bringing dust storms, crop failures and brush fires. Now we have the present 3 year drought. What makes this more unusual than some of the other droughts in the past is the persistent of record high temperatures. This tells me that while droughts are nothing new for Australia, that climate change definitely has something to do with it. Please read an interesting article here about the super drought
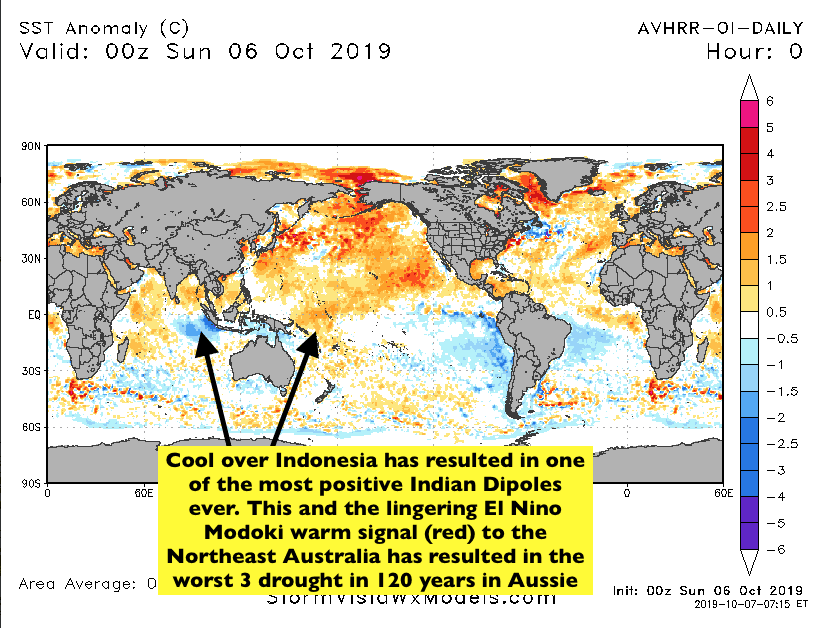
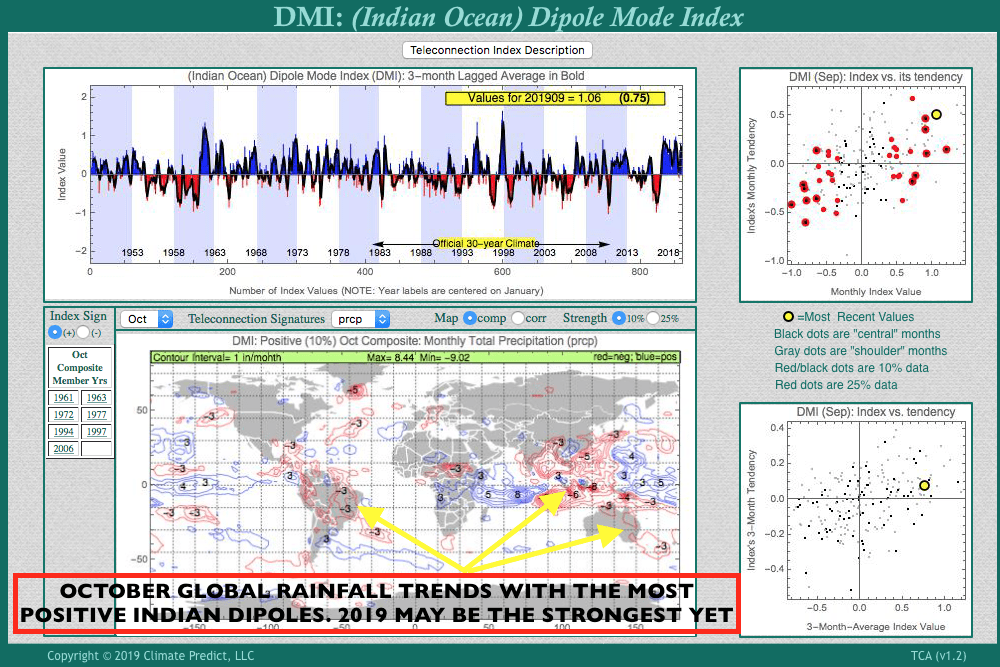
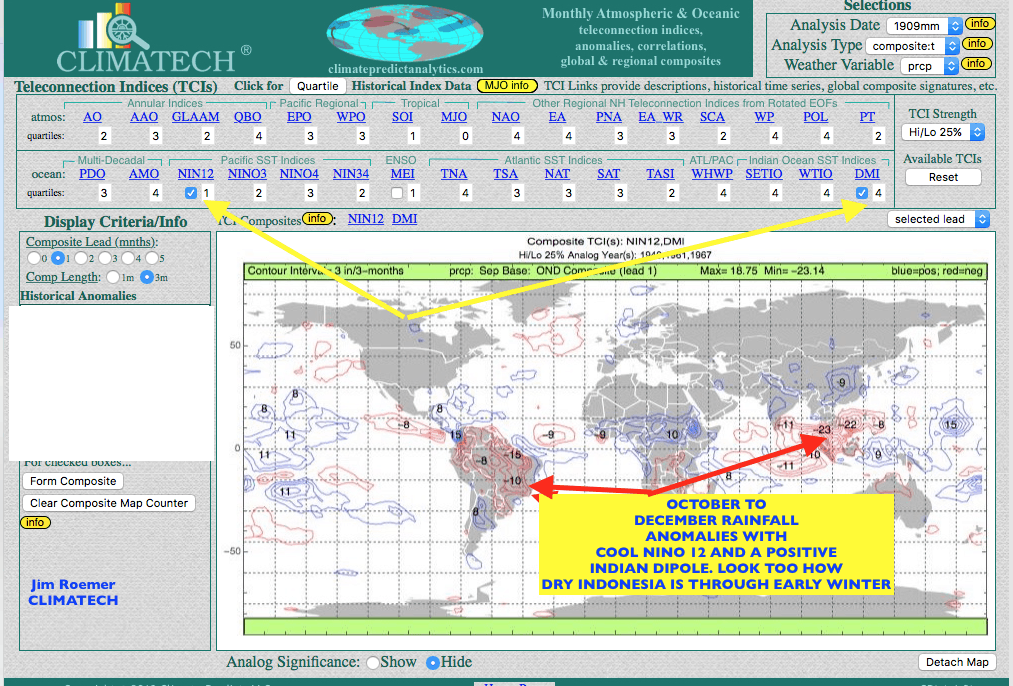
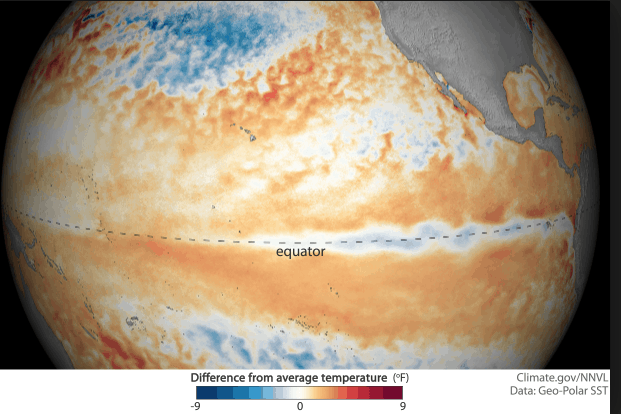
From a climatological perspective, something we call a positive Indian Dipole has a high correlation with below normal rainfall in Australia as well as Indonesia. When this weather variable coincides with an El Nino, then these two phenomena’s together present the most dire consequences for Australia. Though El Nino is pretty much dead, the warming over the western Pacific (see map, below) represents that parts of the globe can still exhibit El Nino conditions. It is possible El Nino could make a comeback sometime in 2019 and contrary to what many other weather forecasters have been suggesting. The bottom line is that Australia may be in dire straights well into 2019.
You can see how a positive Indian Dipole (below) has dry weather risks (red) continuing for much of Australia, as well as Indonesia. While parts of northern Brazil also could become dry, currently , an improved rainfall outlook for Brazil coffee has been in my forecast the last 2 weeks. It may take more serious dryness in N. Brazil or Argentina this winter (their summer) to take grain prices out of the doldrums and help American farmers receive better prices.
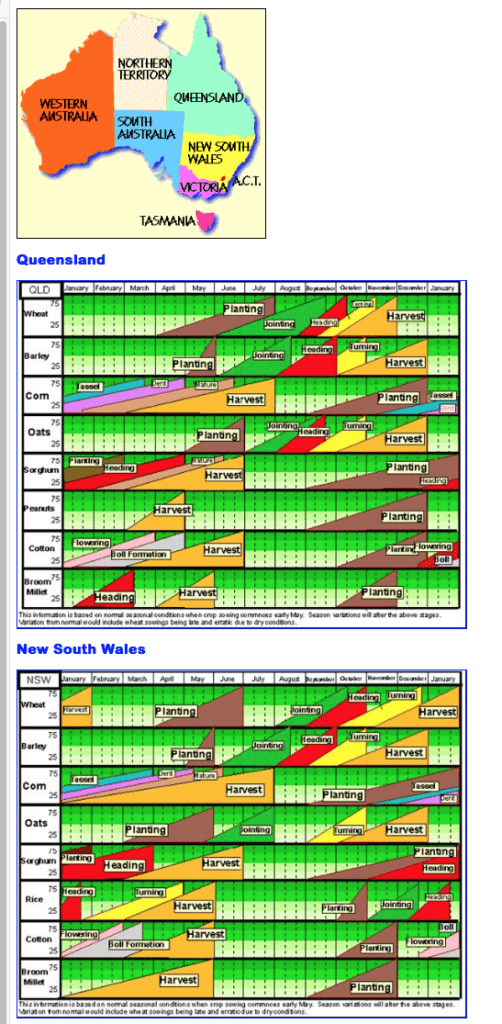
The Indian Dipole by itself must be used in conjunction with other weather forecast techniques. Currently my biggest concern is for the continuing drought for Australia and possibly a worsening situation for Indonesia by winter or next spring. Cotton is normally planted in November in Australia, and this will be at least the 2nd straight year that lower acreage should result due to drought.
I appreciate the hundreds of requests and comments around the world from twitter, linkened and other sources with regards to my offering a weather commodity newsletter. This would be simple to understand, timely, and offer the best long range weather forecasts in multiple industries from commodities, to global climate concerns, ski weather, weather and health and travel ideas.
There are grave concerns about China not working with Trump (for good reason) to settle the Trade War dispute. These have helped to pressure grain prices again. Many analysts keep talking about millions of acres of corn not planted, thus preventing the planting insurance option. These statistics may show up in the USDA crop report to be released on the 12th of August. This report promises to have plenty of fireworks in it, as it is almost impossible for the USDA to estimate corn and soybean yields with an accurate accounting by farmers deeper in the summer and fall. So the USDA report may not be accurate as far as final yield and production for corn and soybeans. There are several firms that disagree with much lower corn acreage
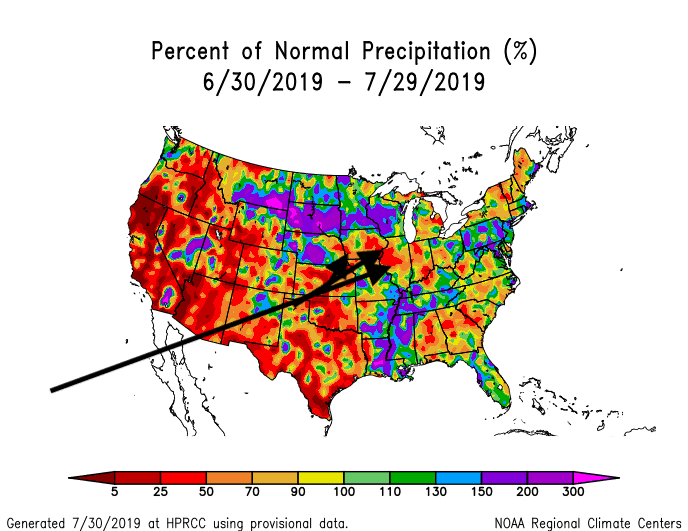
For the past few weeks, my opinion has been that of a slowly improving weather pattern through August for Midwest corn and soybeans. However, growing dryness is mounting for Iowa, Illinois and Indiana, though the cool weather has certainly reduced crop stress.
That is what grain traders are looking at right now; not “what ifs” about the USDA and their data. Will it rain in Iowa into central Illinois, Missouri and Indiana? CLIMATECH (see below) has the answer, some 1-3 weeks ahead of standard forecast models. My feeling is we will see important rains fall for drought stricken areas of Illinois, eastern Iowa into Indiana. While this could help soybeans recover deeper into August (the crop has been slow to develop so rains could benefit things), the corn crop is likely seeing some irreversible damage in the eastern belt.
El Niño, and its family
So which weather forecasting techniques do I use? Besides looking at standard computer models (that are wrong more often than not), favored by most meteorologists who forecast, I have my own favorite technique.
I am a devout believer in teleconnections such as El Nino, the QBO, the Arctic Oscillation index and many more. A teleconnection is a climatological feature that can influence the weather in a location, or region, that is thousands of miles away. When several teleconnections come together and agree, they can be used to formulate analog years in predicting weather months in advance.
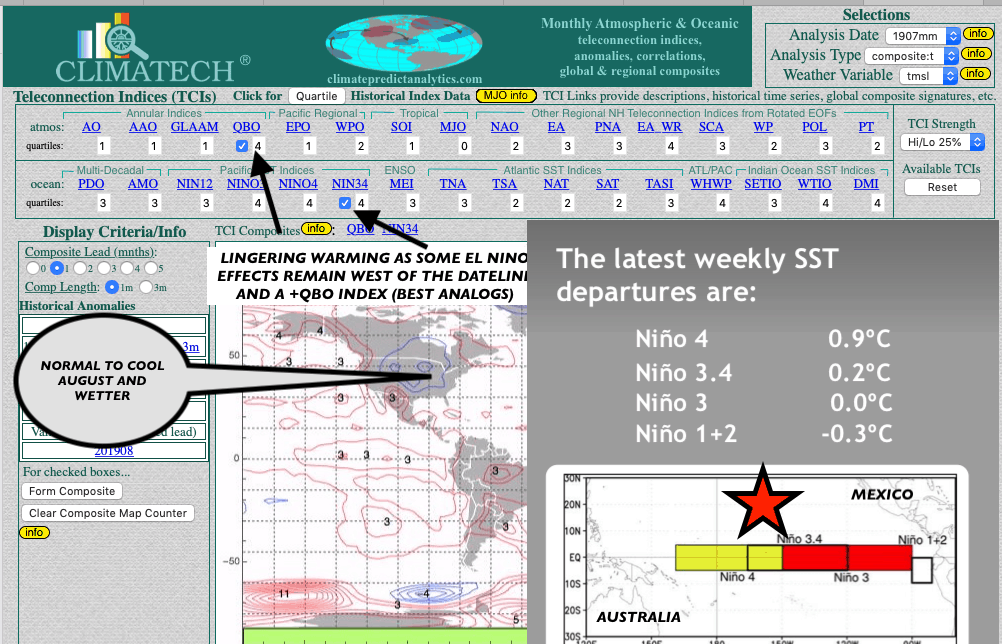
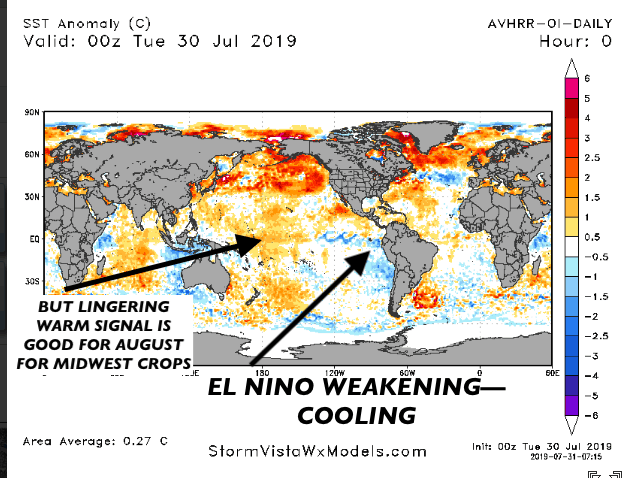
My in-house weather forecast program CLIMATECH (above) has been looking at teleconnections, such as the lingering warm signal in the western Pacific and also the positive QBO index in the upper stratosphere. The lingering El Niño Modoki (an unusual phenomenon of warm water the western Pacific and cool seas in the east) and the QBO, helped us predict a cool late July and early August for Midwest crops. It also indicates improved chances for rain as we head deeper into August for most of these dry areas you see in red, on the chart below.
(MAP ABOVE) Area of concern in red–only continued dry weather and a return to heat would be bullish corn and soybeans in the absence of a Trade War Agreement. Lingering dryness remains but most teleconnections discussed above suggest some improvement over some 60-80% of the U.S. corn/soybean belt as we head deeper into August. Otherwise, grain prices would explode.
El Nino Modoki continues with warming west around the dateline.
Many commodities have been in the tank due to a combination of renewed Trade War concerns with China and a growing glut for such commodities as corn, wheat, soybeans, coffee and others. Global weather patterns have been mostly beneficial to agricultural interests over the last year, but don’t tell this to Midwest farmers who are having one of the most difficult times in planting corn since 1993 and 2008. The Midwest and parts of the Deep South will continue having issues with planting and germination as we head deeper into May.
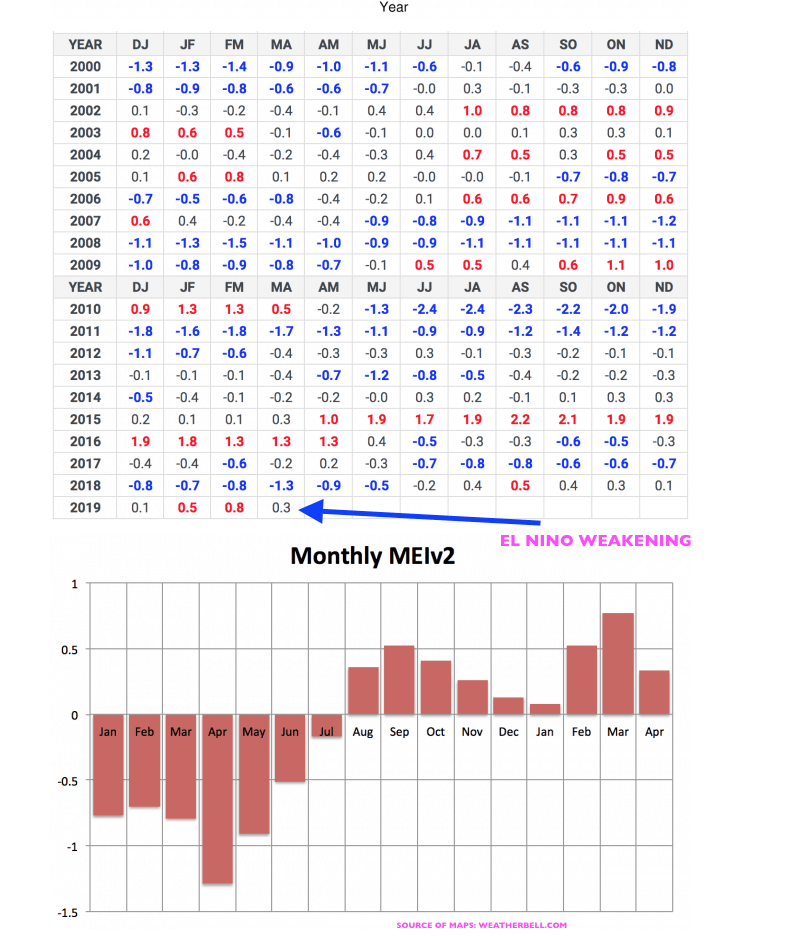
El Nino is weakening, which is not unusual this time of the year. However, this does not mean that some global weather issues to crops will not pop up along the way through springtime and into summer. West African cocoa and Indian Monsoon weather will be important to the cocoa and sugar market in the months ahead.
The above table and chart show the newly constructed MEIv2 index, which replaces the old MEI calculation method. You can see how the values have been weakening, especially plunging in recent months. This implies changes in ocean temperatures in the Pacific, as well as other criteria such as the SOI index and global angular momentum. This indicator is a key in predicting El Nino or La Nina.
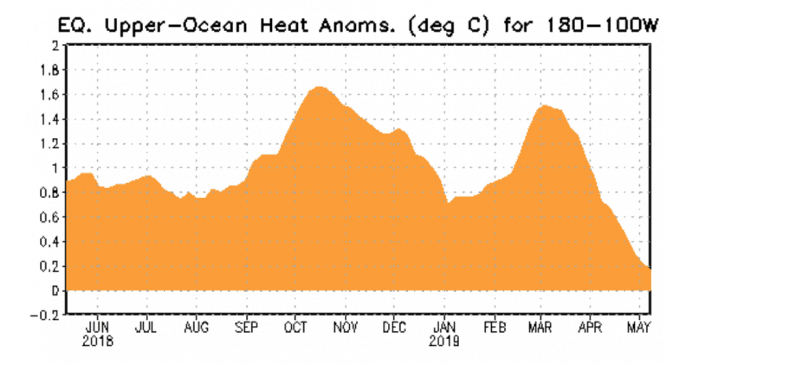
The above chart shows how the upper ocean heat content along the Pacific Equatorial region is sloping downwards (cooling a bit from the warm levels). This implies a weakening of El Nino. The huge record snows out west this past winter, severe weather and tornadoes and flooding to Midwest crops were signs of El Nino conditions and lingering wet weather effects from El Nino should still continue for at least another few weeks.
The 1993 severe Midwest flooding occurred with a weakening El Nino, as did summer dryness to west Africa cocoa. Hence, it does not take a full fledged El Nino to create some global weather havoc. I will be watching
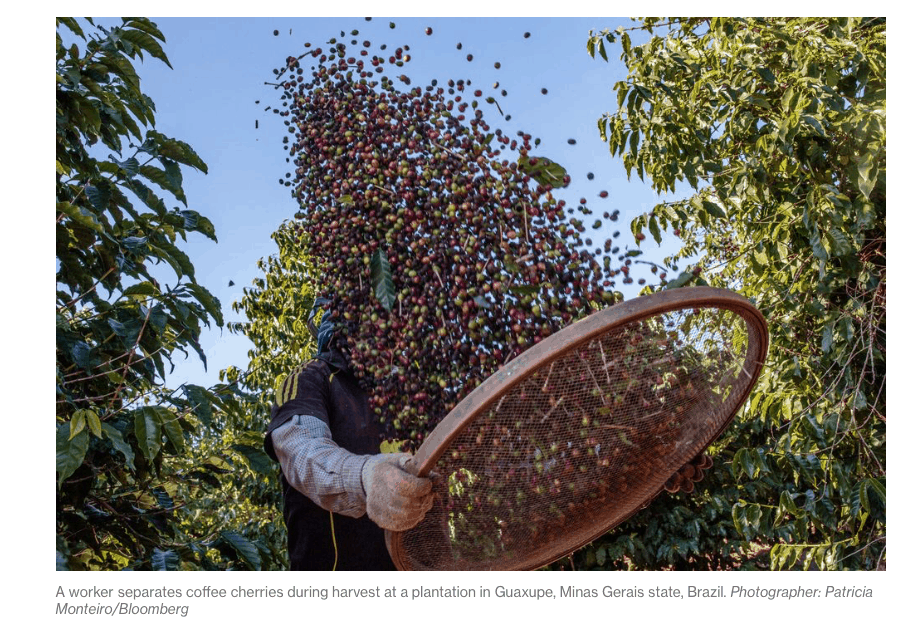
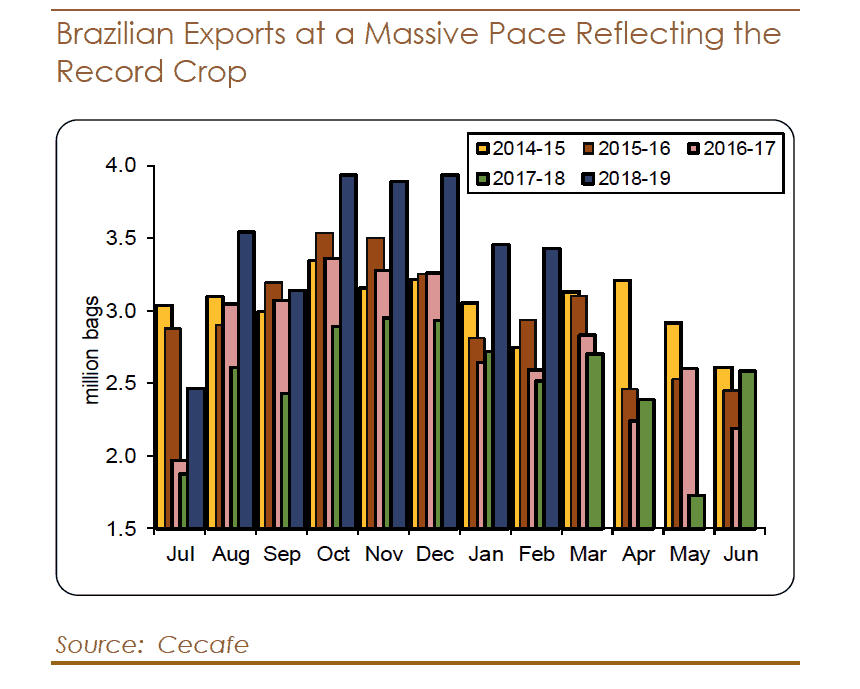
There are some theories by meteorologists and commodity traders that El Nino can reduce Brazil and other producing countries’ coffee production resulting in a surge in prices. However, if this season was any indication, this has been far from the truth. Timely rains, a fall in the Brazilian Real and increased Brazilian coffee plantations have resulted in a collapse in prices, even as El Nino appears to be making a rebound.
The two biggest Brazilian coffee droughts of the past several decades were from October-December , 1996 and most recently January-February, 2014, in which coffee prices soared above $2/lb. Presently, coffee prices have fallen close to 90 cents/lb.
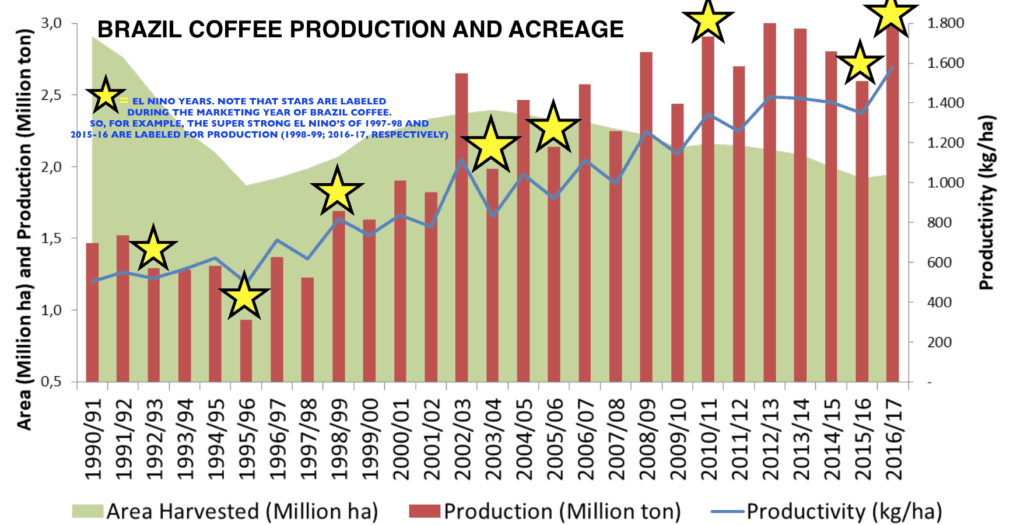
Some of the low coffee production years on this chart (above) are due to the typical off-cycle production years that occur every other year. This chart does not include Brazil coffee production the last two years, which has increased substantially resulting in the present surplus of global coffee supplies. The stars represent coffee production of El Nino years. The big fall in the 1995/96 crop was due to the severe freezes in June/July 1994 and not El Nino.
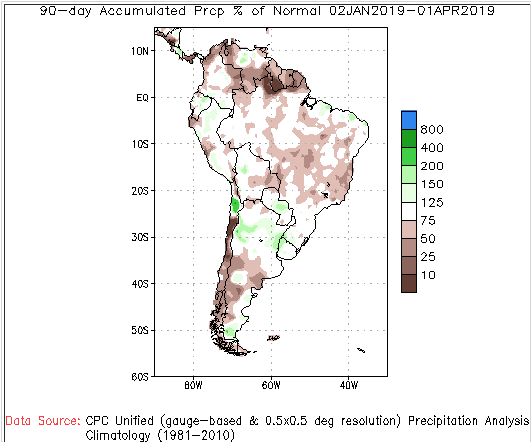
A look at rainfall trends the last few months would appear to illustrate that some weather problems might have occurred in Brazil this winter (their summer). This chart represents the 90 day % of normal totals for South America.
The brown regions in northeast Brazil represent below normal rainfall the last 90 days. So why has coffee production not fallen? Increased plantings, plus rainfall coming at critical times has been enough to prevent any decline in coffee production this year.
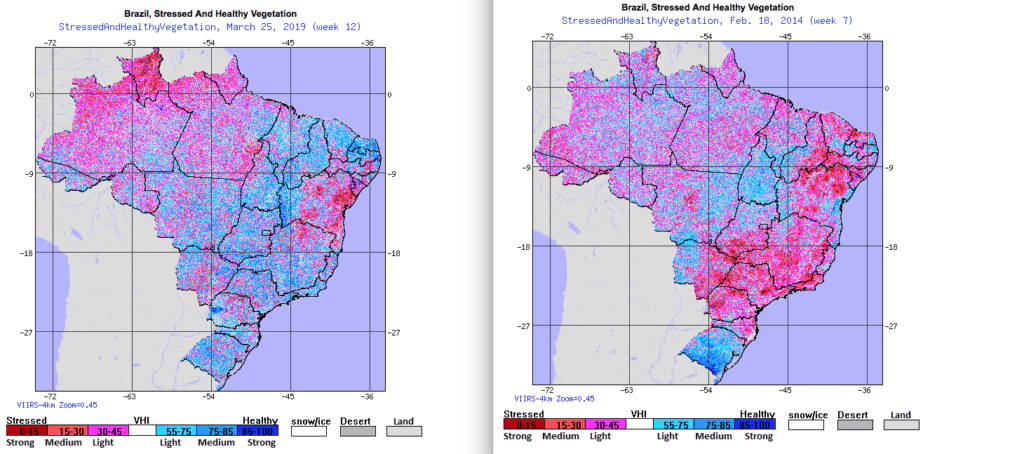
Closer scrutiny of actual moisture stress conditions (below) better explains why some bouts of dry weather in Brazil’s coffee area has not be a big deal. The charts below show the generally favorable growing conditions in Brazil recently (left) vs. the last coffee drought from January-March, 2014 (red). Early 2014 was an El Nino neutral year (no La Nina, nor El Nino). Hence, there can be no general conclusion that El Nino in itself causes a reduction in Brazil coffee production, nor subsequent higher prices.
The blue (left) crop conditions in Brazil’s northern coffee areas illustrate the generally favorable growing conditions vs early 2014 (right) when drought sent coffee prices soaring.
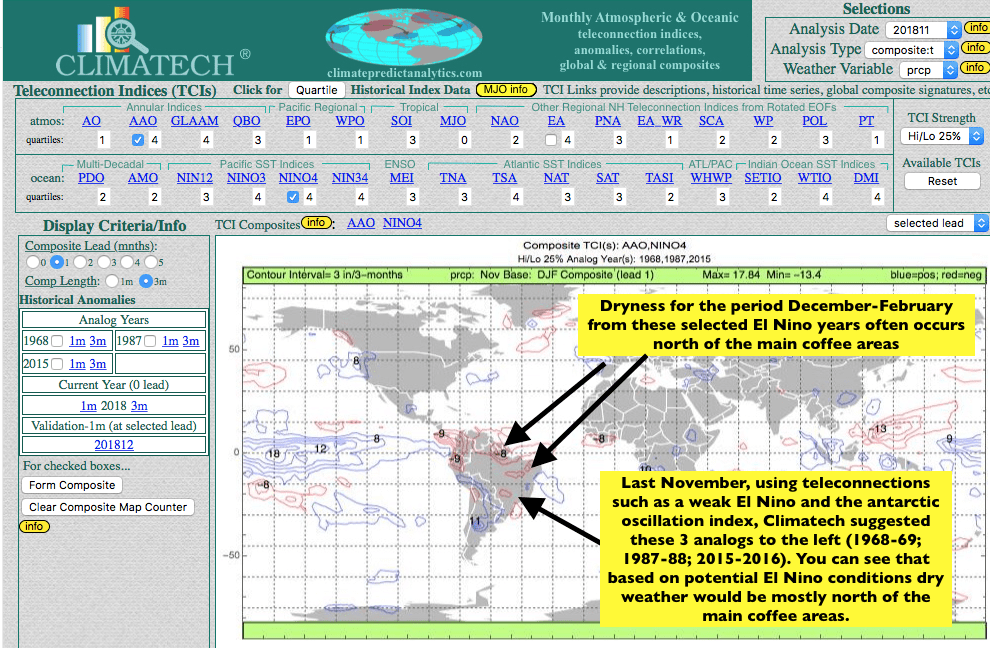
My proprietary program suggested last November that even if El Nino was to form, the predicted December-February rainfall trends would not be dry enough to warrant any serious concerns to Brazil’s coffee crop. A rally sometime between May-July would be possible if there was a legitimate freeze scare and/or severe wet weather delaying the coffee harvest. A sudden surge in the Brazil Real could also set a floor on prices if this was to occur.
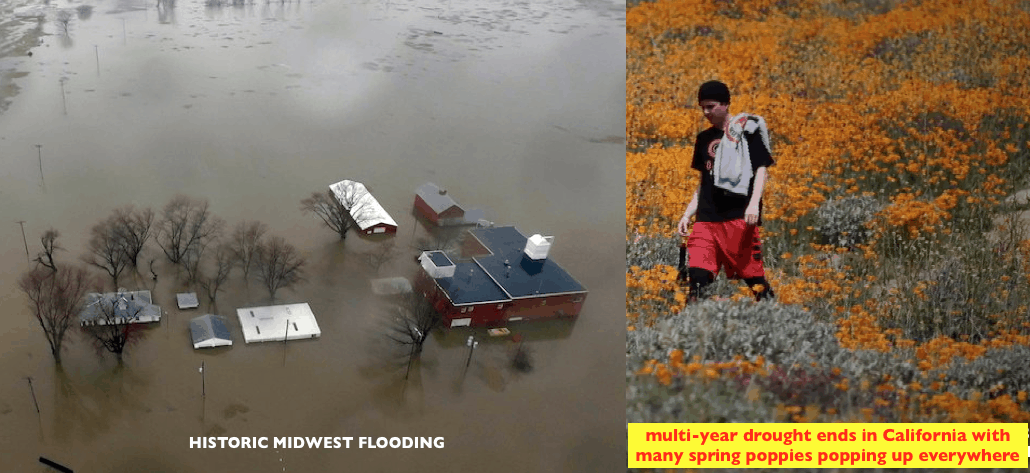
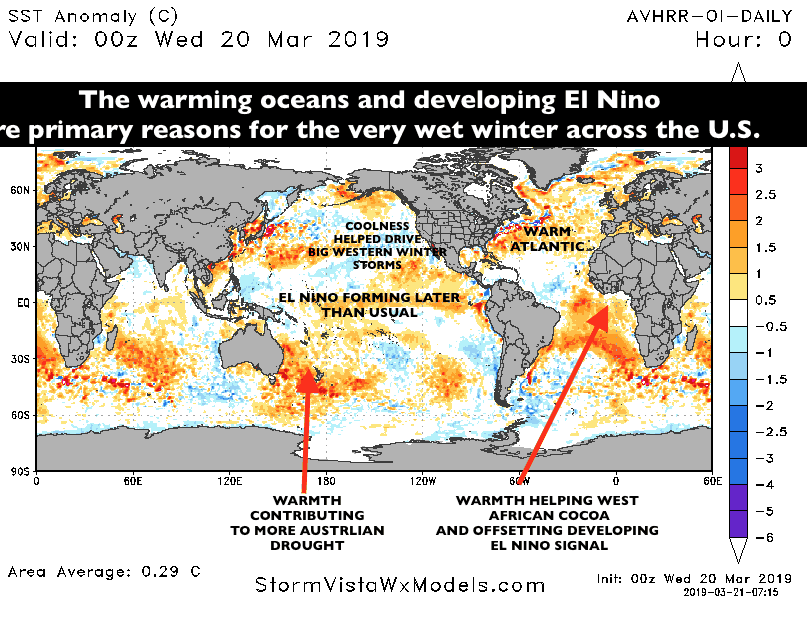
Thousands of livestock killed and millions of acres flooded in the Midwest and Plain States poses a multi-billion dollar threat to agriculture and other industries. This comes at the worst possible time given the Trump Administration’s trade tariff war with China, in which any truce and Agreement is moving at a snails pace. While some meteorologists and other scientists believe that low solar activity (sunspots), combined with a reversal in the sun’s magnetic field might be causing all of this wild weather, I believe that typical “cyclical activity”, the warming oceans and an unusually late developing El Nino are mainly to blame. For California, incessant rains and snows have created havoc for homeowners but the storms and record winter snowpack will have the opposite effect after years of drought. The incessant moisture will be a big plus for California agriculture and the economy.
Over the couple months, I will have several segments (blogs) discussing El Nino vs solar activity and climate change, with respect to the United States planting season and its potential impact on agriculture and the commodity markets. For now, the corn market is beginning to react to potential planting delays and livestock and spring wheat crops are at risk if things do not dry out soon.
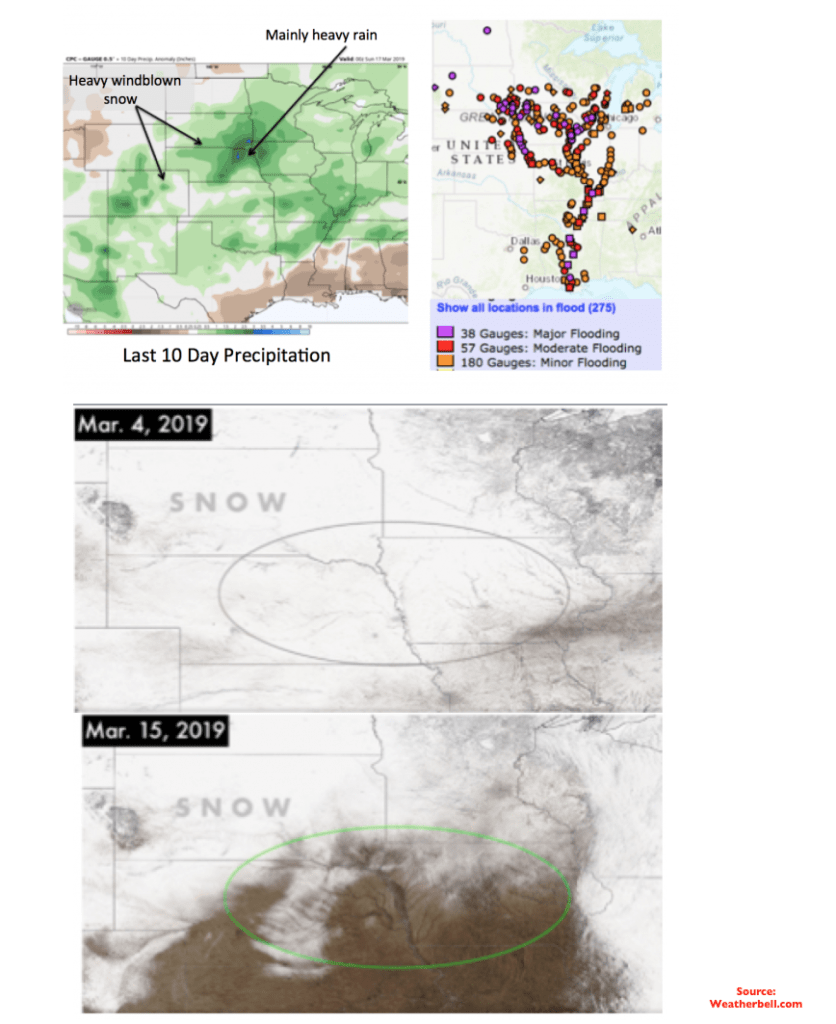
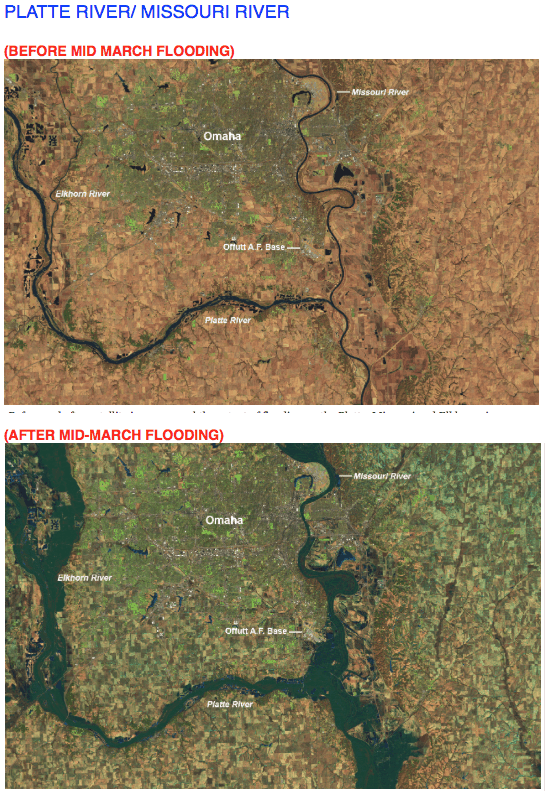
The images above show the flood risk in the Midwest brought on several “super storms” this winter, which have blessed western ski resorts with 15-30 feet of snow the last 2 months. Melting snow cover and more rainfall has been the issue. The images below show how the Platte River in Nebraska and the Missouri River has swollen in recent weeks from the flooding posing major transportation and farming risks.
Historial Midwest Flooding
The flooding extends far beyond the area you see above as heavy snowfall and rainfall is also threatening the Des Moines River and all along the Tennessee Valley.
By now you’ve seen the photos. Vast fields covered in water, with grain silos and barns sticking up through the glassy surface. Warming temperatures melted hard-packed ice, and, in combination with recent rains, have caused a deluge that has overwhelmed rivers and levees and spread across the plains.
Nebraska has been hit hardest. The strongest, most intense waters have come from the failure of the 90-year-old Spencer Dam. After the “bomb cyclone” poured rain across the state, the failure of the dam ignited a flash flood that emptied into the Missouri River, and linked up with snow melt. Now, large swaths of the state are underwater.
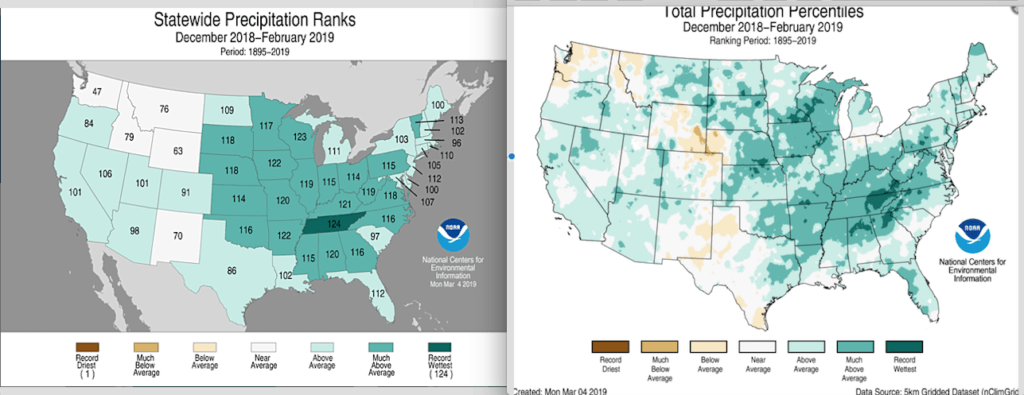
The image above shows how the country as a whole has been the wettest in 124 years worth of weather data going back to the 1890’s. The table on the left depicts how Tennessee is ranked 124th (wettest) ever.
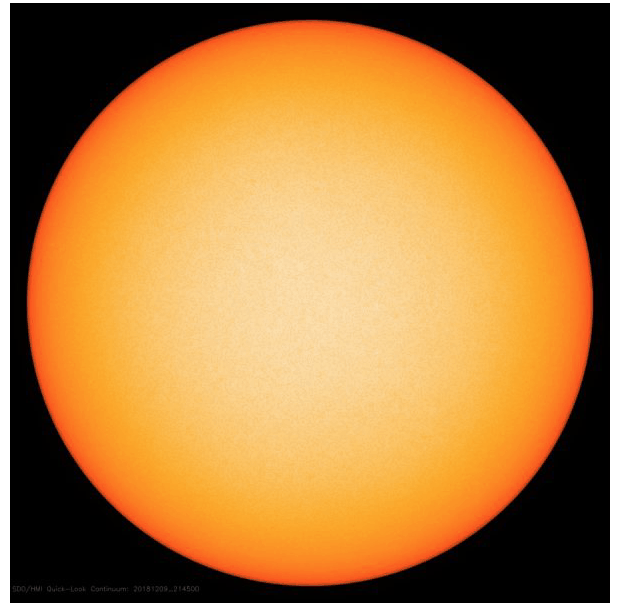
So what is causing all of this wild weather? Is it the lack of sunspots shown on the image below? Or is El Nino and a combination of other climatological variables?
On December 6, 2018, the Center of Excellence in Space Sciences India (CESSI) reported that two of its scientists have made a prediction for the upcoming sunspot cycle. Solar physicist Dibyendu Nandi and his Ph.D .student Prantika Bhowmik devised a new prediction technique, which simulates conditions both in the sun’s interior, where sunspots are created, and on the solar surface, where sunspots are destroyed.
Earlier predictions have suggested the coming sunspot cycle 25 will be weaker than the current cycle 24. But, based on their model, Nandi and Bhowmik believe cycle 25 might be similar to or even stronger than 24. They expect the next cycle to start rising about a year from now and to peak in 2024. Their work was published December 6, 2018, in the peer-reviewed journal Nature Communications.
Why should we care about the low solar cycle coming up? Many people do care about solar activity, due to the sun-earth connection and potential implications to offset man-made global warming; negatively impact earthly technologies (electric grid); and changes in climate. Low solar activity can prevent major disruptions in the nation’s electric grid and according to some scientists result in severe global cooling. High, active solar activity results in the beautiful “Northern Lights” at the higher latitudes (Vermont, Canada, Finland, etc.) but also cause havoc with electrical grids.
I will present some evidence in coming weeks, why “putting to much’ faith into the present solar minimum offsetting global warming and creating extreme weather—(such as the present Midwest flooding) is likely over blown.
Weather is cyclical. The great 1993 floods that helped grain prices soar and wrecked havoc in the Mississippi and Illinois’ rivers actually had higher solar activity than we are presently witnessing. Hence, making a direct correlation to the present flooding to solar activity, is incorrect in my opinion. It may be one factor, but not the only one.
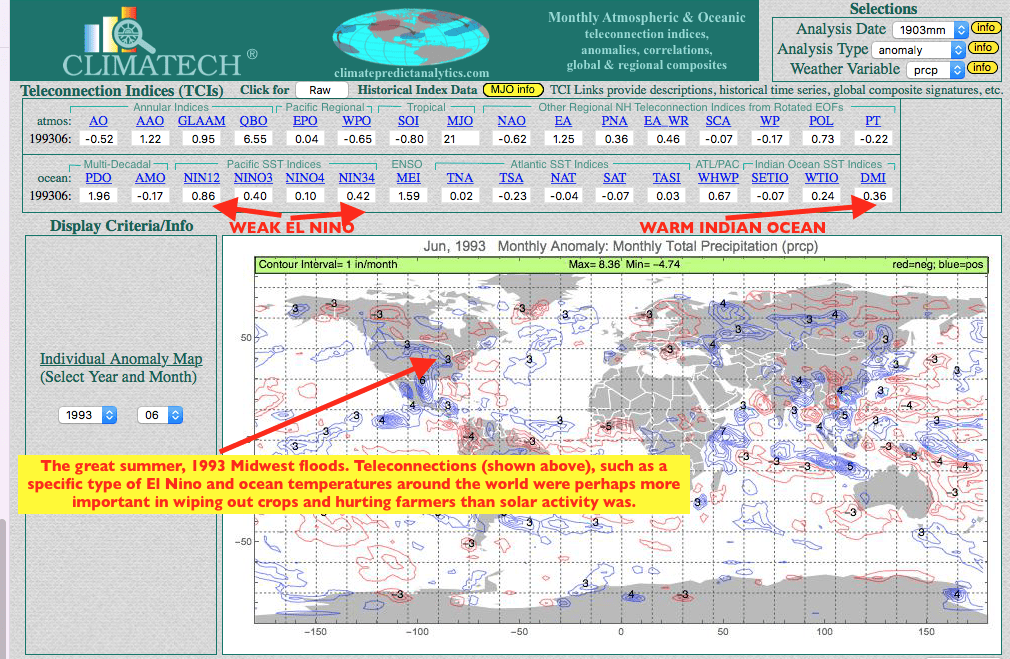
Climatech (above), shows the teleconnections associated with the intense corn and soybean belt rainfall in June, 1993.
1993 was the last time Midwest flooding was as severe as today. However, back then the flooding occurred, later on, during the growing season when crops such as corn and soybeans were developing. I believe that much of this flooding back in 1993 (much of it further east along the Mississippi and Illinois Rivers) was influenced by a combination of El Nino , as well as fall out and residue from Mt. Pinatubo more than any influence in solar activity.
HELPING YOU MAKE THE BEST INVESTMENT DECISIONS BASED ON THE WEATHER
We use cookies to ensure that we give you the best experience on our website. If you continue to use this site we will assume that you are happy with it.OkPrivacy policy