In late May, I turned bearish on US corn while many traders remained focused on strong export demand and the potential geopolitical risk premium from the Middle East conflict. My view was that those bullish factors had already been largely priced into the market. What was being underestimated was the weather.
From a meteorological standpoint, the atmosphere was lining up for one of the most favorable spring planting seasons across much of the Corn Belt in years. Timely rainfall, adequate soil moisture, and the absence of prolonged flooding or planting delays allowed producers to make rapid planting progress. History shows that when crops get planted on time under favorable early-season conditions, yield potential increases significantly. Markets quickly shifted their attention away from geopolitical headlines and back toward the prospect of abundant US production.
What resulted was a sharp 10–15% decline in corn futures, exactly as I anticipated.
The next major catalyst arrives with the USDA Planted Acreage Report on June 30. If planted acreage exceeds expectations, the market could remain under pressure. However, if acreage comes in below expectations or if the report reveals fewer corn acres than traders currently anticipate, prices could stabilize or even rally.
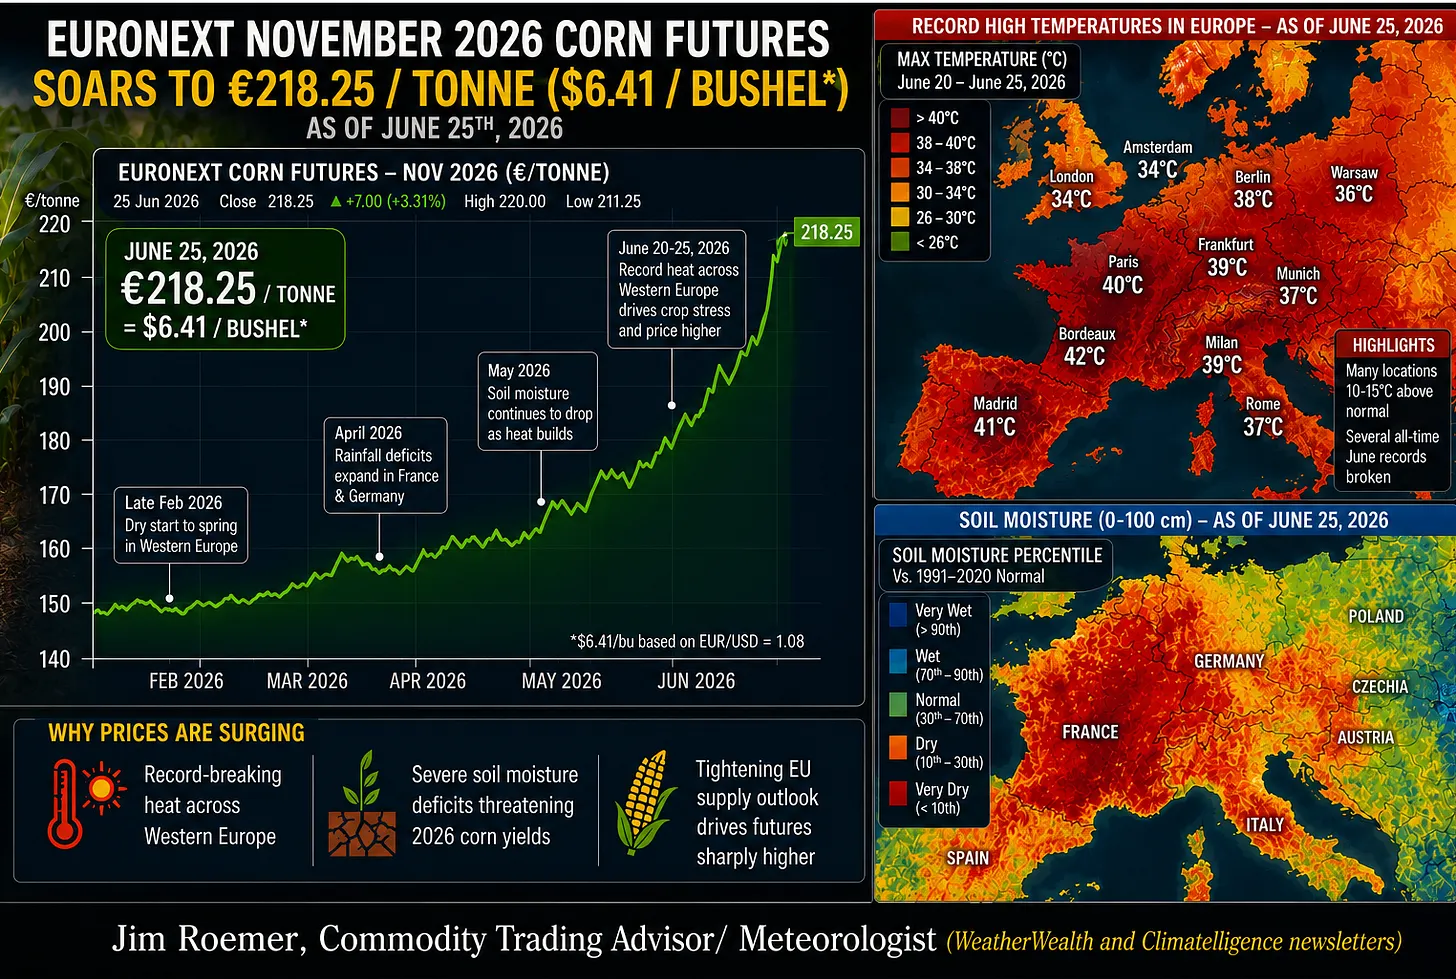
Another developing wildcard is Europe. An unusually intense early-summer heat wave is spreading across major agricultural regions, with temperatures exceeding 100°F (38°C) in parts of France, Spain, Italy, and the Balkans. Heat arriving this early in the growing season increases crop stress, particularly if accompanied by below-normal rainfall. European maize prices have already begun to climb as traders reassess production risks.
The key question now is whether Europe’s weather problems can offset the increasingly favorable US crop outlook. Corn markets often shift rapidly from local weather stories to global supply concerns. While the long-term US production outlook remains favorable, adverse weather in Europe—or later this summer in the US during pollination—could signal that corn has established an important seasonal bottom.
As always, weather remains the single most important variable determining grain prices. Understanding atmospheric patterns before they become widely recognized is often where the greatest market opportunities emerge.
To find out more about our global commodity weather forecast and market outlook, please upgrade below. (If you are already a Climatelligence subscriber, you can access our full report here.
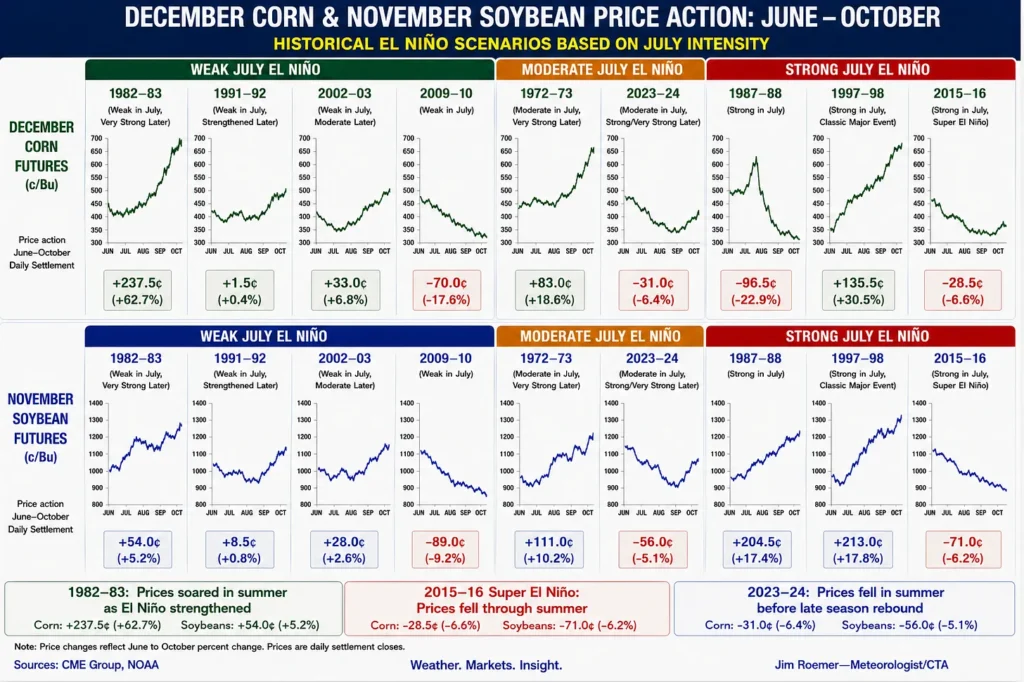
What About El Niño?
Not all El Niño events have the same impact on US corn. Strong El Niño events often leave behind abundant spring soil moisture and, as they weaken into summer, tend to produce cooler and less stressful conditions across portions of the Midwest. This generally favors above-trend corn yields and can keep prices under pressure.
Weak El Niño events, however, are much less predictable. As they fade, the atmosphere can become more volatile, increasing the risk of summertime heat ridges and localized drought during the critical pollination period in July. In those years, weather markets can quickly add a significant risk premium to corn prices.
For farmers, the decision to hedge depends on both weather risk and current price levels. After the recent decline in corn prices and with excellent crop conditions across much of the Corn Belt, many producers may want to consider incremental hedges—particularly if the USDA’s June 30 acreage report confirms a large planted crop. However, maintaining some upside flexibility is also prudent. Weather during pollination remains the single most important determinant of final yields, and a shift toward hot, dry conditions could trigger a sharp summer rally.
The bottom line: favorable weather has driven prices lower, but the weather market is far from over. July remains the most important month for determining whether this year’s crop fulfills its yield potential—or surprises the market. Some heat is likely next month, but I am not convinced we are looking at a major drought that would result in a massive bull market, such as what is currently happening in the European market.
We appreciate your interest and look forward to helping you gain a better understanding of the powerful connection between weather and global commodity markets.
Mr. Roemer owns Best Weather Inc., offering weather-related blogs for commodity traders and farmers. He is also a co-founder of Climate Predict, a detailed long-range global weather forecast tool. As one of the first meteorologists to become an NFA-registered Commodity Trading Advisor, he has worked with major hedge funds, Midwest farmers, and individual traders for over 35 years. With a special emphasis on interpreting market psychology, coupled with his short and long-term trend forecasting in grains, softs, and the energy markets, he commands a unique standing among advisors in the commodity risk management industry.
As a veteran in the commodity futures industry, Scott’s career has taken him from learning the business on Continental Grain’s New York trading floor and later co-directing Citicorp’s entry into the energy commodity business in the bank’s brokerage subsidiary Citicorp Futures Corporation.
As an early participant in the weather derivatives market, Scott consulted and advised the Chicago Mercantile Exchange in designing and launching the first weather-indexed futures contracts for temperature, precipitation, and hurricanes. For nine years, he produced Weather to Buy or Sell– a feature that appeared in the weekly edition of The Wall Street Journal. This “infomercial” covered the CME weather futures activity.
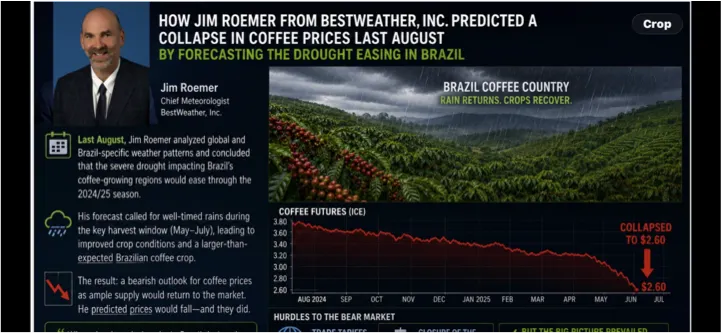
The illustration above reflects Mr. Roemer’s view in October of 2025 that Brazil’s coffee production would rebound and that we would enter a longer-term bear market.
Following back-to-back droughts and frost scares from 2023-2024 with surging coffee and cocoa prices, the coffee market fell back to earth. While some folks have felt that Brazil’s record crop could mean prices below $2 per pound, we have disagreed. These are the same traders who, at $3.50/lb. last year, were still bullish. They did not anticipate that a weak La Niña at the time would increase (not decrease) global coffee supplies.
Trade tariffs (the US war on Iran aside) had created incredible market volatility, and when Brazil’s record crop hit the market, prices fell below $2.50 a couple of weeks ago. Since that time, our view has been that disease issues from too much rain would hit key areas of Brazil. This caused us to recommend some cautiously bullish trade strategies for our subscribers. Coffee prices have since rallied 10% in the last few weeks.
To find out more about our global coffee weather forecast and market outlook, please upgrade below. (If you are already a Climatelligence subscriber, you can access our full report here.
More wet weather is coming for Brazil’s coffee crop – How El Niño may affect prices
Brazil’s coffee shifted from record-crop optimism to supply-risk concern.
Early on, traders expected a big 2025/26 Brazilian crop. This was because Arabica was in a favorable biennial cycle, and Robusta output was looking strong. That raised the hopes that global coffee supplies would loosen.
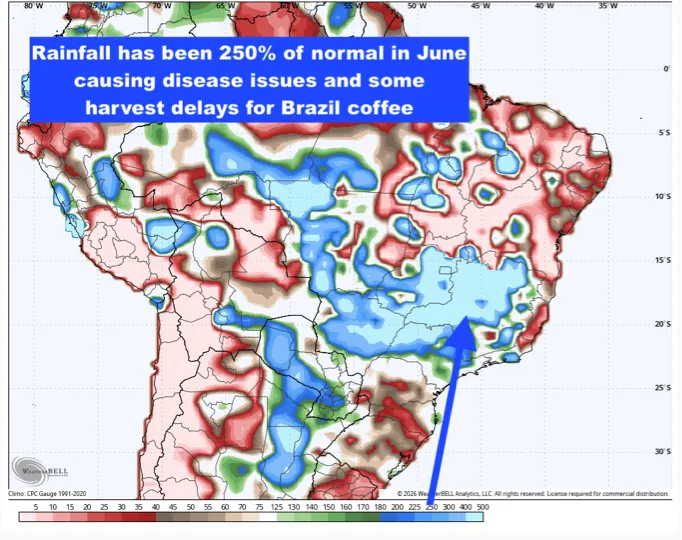
By June, the worry changed from too little rain to too much rain.Wet, cooler weather slowed harvesting, delayed ripening, limited fieldwork, and raised fears about bean quality.
We alerted our subscribers to this two weeks ago… and that it was likely that “the lows were in” for coffee prices.
Map Source: WeatherBELL
The rain also increased concern about fungal disease and pest pressure, including leaf rust, cercospora, and coffee borer issues.
Because global coffee inventories were already tight, even a modest threat to Brazil’s harvest triggered a strong market reaction.
The core narrative became:
→ big crop expected
→ weather damage trims potential
→ June rains threaten harvest pace and quality
→ prices rise on renewed supply fears.
We looked for a return of wet weather for the remainder of June to cause additional new concerns for Brazilian coffee.
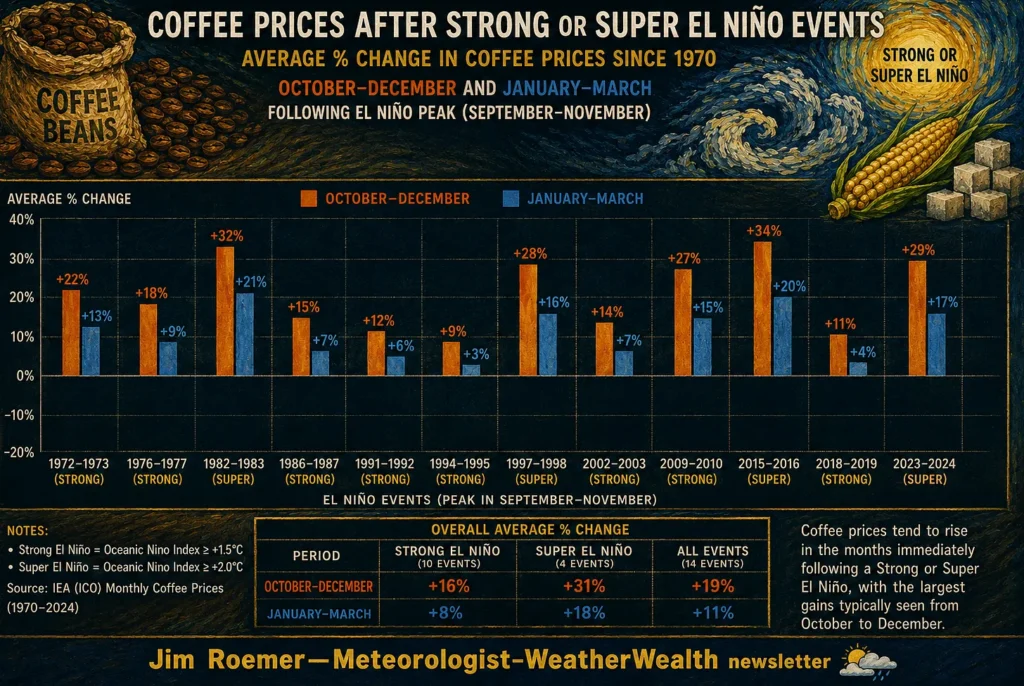
So… what about a longer view of coffee’s price? Well, just looking at El Niño events below, we can see how prices tend to go higher. Although Jim sees no frost potential for Brazil, a return of wet weather means prices should trend higher heading into July.
Image Source: WeatherWealth Newsletter
We appreciate your interest and look forward to helping you gain a better understanding of the powerful connection between weather and global commodity markets.
Thanks for your consideration in joining our followers.
Jim Roemer, Scott Mathews, and the Best Weather Team
Mr. Roemer owns Best Weather Inc., offering weather-related blogs for commodity traders and farmers. He is also a co-founder of Climate Predict, a detailed long-range global weather forecast tool. As one of the first meteorologists to become an NFA-registered Commodity Trading Advisor, he has worked with major hedge funds, Midwest farmers, and individual traders for over 35 years. With a special emphasis on interpreting market psychology, coupled with his short and long-term trend forecasting in grains, softs, and the energy markets, he commands a unique standing among advisors in the commodity risk management industry.
After rallying to near historic high prices a year ago, you may have had some relief at your favorite coffee shop recently: That precious cup of your favorite cappuccino or espresso has dropped a bit in price (Well, at least it costs your coffee shop less to buy it… your cost is between you and your barista.)
Why? The end of Brazil’s multi-year drought.
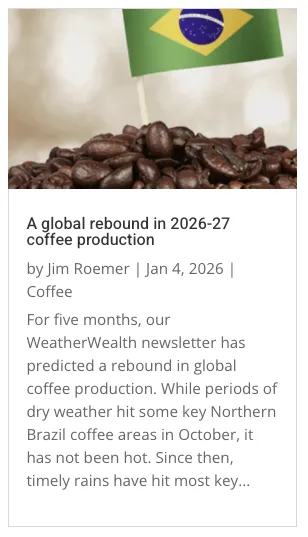
Jim Roemer nailed the coffee price crash earlier this year (early 2026) because he foresaw a massive supply rebound coming from healthy Brazilian trees.
However, the plot has twisted in June 2026: unexpected heavy rains will soon soak the harvest, threatening to lower the quality of the record Brazilian coffee bean harvest.
If you would like to find out about a new inexpensive commodity-weather service coming with stories like this and for many markets:
Anyway, Here is the breakdown of this coffee market drama for novice traders and weather geeks.
Part 1: The “Party Pooper” Prediction (Why Prices Collapsed)
Imagine the coffee market earlier this year was a balloon inflated by fear—fear that Brazil’s trees were still thirsty and damaged from past droughts. Jim Roemer popped that balloon.
· The Call: Starting late 2025 and into 2026, Roemer predicted a “bear market” (prices going down).
· The Reason: He saw that the coffee trees in Brazil had recovered beautifully thanks to “timely rains” earlier in the growing season. The trees were lush, green, and loaded with coffee cherries.
· The Result: Traders realized there was no shortage. The “fear premium” vanished, and prices dropped by roughly 30% as the market braced for a huge flood of beans to hit the warehouses.
Part 2: The “Soggy Plot Twist” (Why Wet June Weather is Bad)
Just as the “Bears” (traders betting on low prices) were celebrating, Mother Nature threw a curveball. It is currently June 2026—prime harvest time in Brazil—and the forecast has turned unexpectedly wet.
For a coffee farmer, rain is great for growing but disastrous for harvesting. Here is why a wet mid-to-late June is a nightmare:
· The “Gremlin” Effect: You simply cannot harvest coffee in the rain. Machines get stuck in the mud, and wet cherries are harder to pick, causing immediate harvest delays.
· The Mold Monster: Coffee cherries need to dry out in the sun after picking. If it rains on them while they are drying on patios (a common method in Brazil), they can ferment, rot, or get moldy. This ruins the flavor, turning “specialty grade” coffee into “cheap filler” or unsellable trash.
· The Supply Squeeze: Traders were expecting those millions of bags of coffee to arrive now. The rain delays the trucks and ships, creating a sudden, short-term shortage that sends prices spiking back up.
How do We do This?
Basically, we use teleconnections (not just standard weather forecast models) to make specialized global forecasts for farmers, producers, and commodity traders in multiple markets. For example, two weeks ago, we began using these three teleconnections to predict what may well be one of the wettest second-half of June periods in recent memory in northern Brazil.
There is a developing El Niño, a positive “AAO” (Antarctic Oscillation) over the South Pole, where the polar vortex remains stationary, and there is the likelihood for above-average surface temperatures in the Indian Ocean.
It’s Your Move!
If you would like to find out about a new, inexpensive commodity-weather service coming with stories like this and for many other markets, please sign up here: climatelligence.substack.com
Mr. Roemer owns Best Weather Inc., offering weather-related blogs for commodity traders and farmers. He is also a co-founder of Climate Predict, a detailed long-range global weather forecast tool. As one of the first meteorologists to become an NFA-registered Commodity Trading Advisor, he has worked with major hedge funds, Midwest farmers, and individual traders for over 35 years. With a special emphasis on interpreting market psychology, coupled with his short and long-term trend forecasting in grains, softs, and the energy markets, he commands a unique standing among advisors in the commodity risk management industry.
WEATHER WEALTH SAMPLE CONTENT
HELPING YOU MAKE THE BEST INVESTMENT DECISIONS BASED ON THE WEATHER
We use cookies to ensure that we give you the best experience on our website. If you continue to use this site we will assume that you are happy with it.