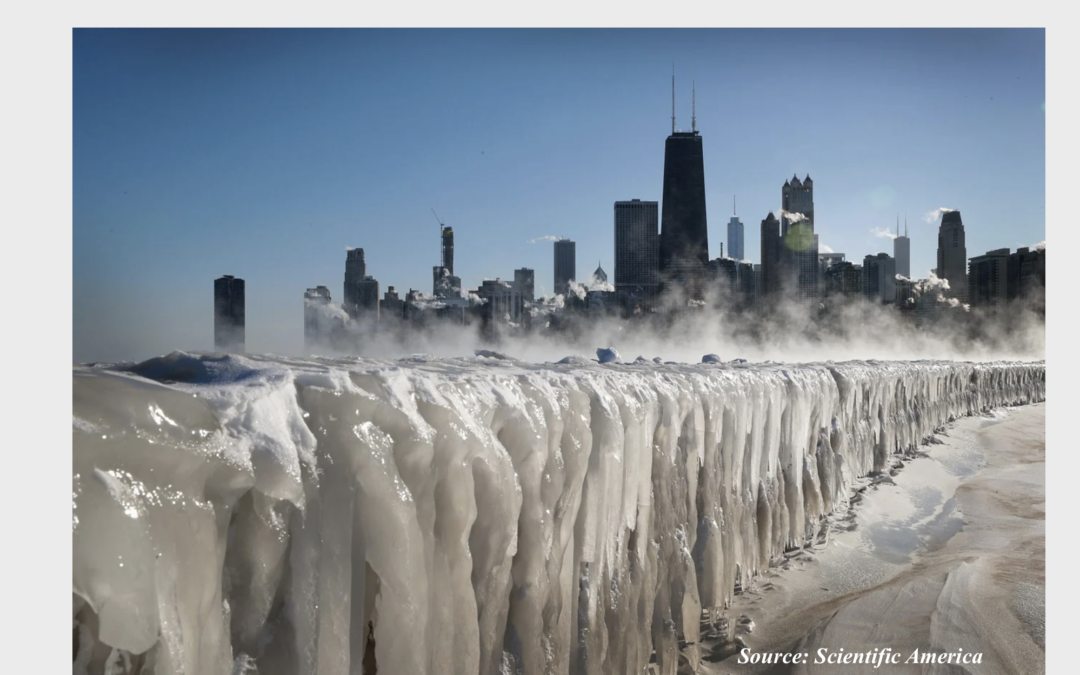
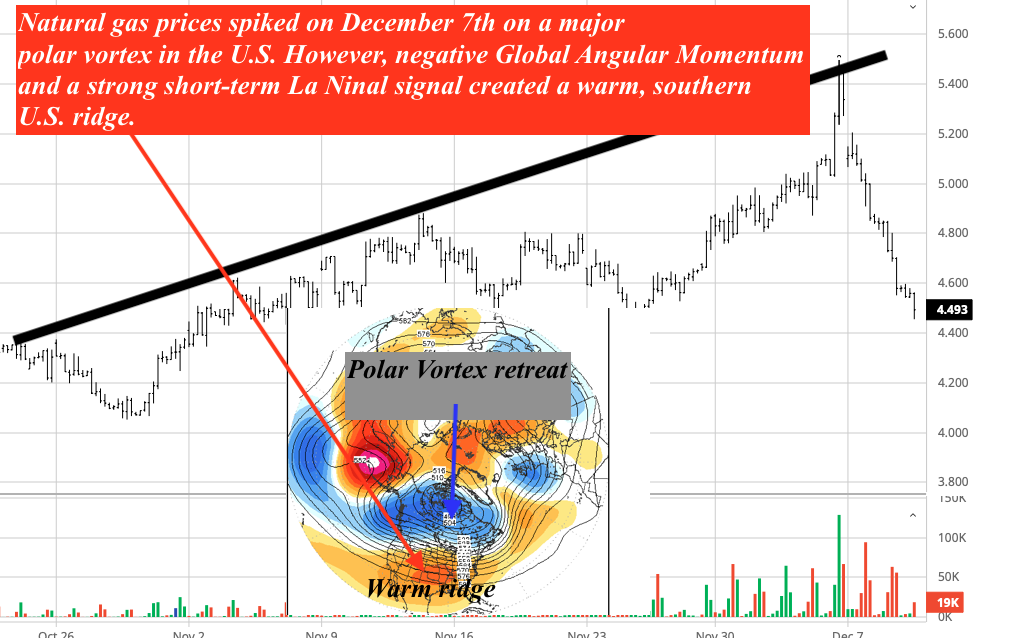
1)How stratospheric warming helped natural gas prices surge over $5.00 in early December, only to come crashing down on the warmer late month outlook. That warming aloft will begin to weaken.
2)What is a -WPO and -NAO index? It will bring much colder weather to Europe and perhaps New England as we head towards the end of the month, However, since the negative NAO will be more eased based, that would favor Europe seeing more consistent snows into January rather than much of the central and eastern U.S.
3)How a +EPO index (cold pool near Alaska) and strong western U.S. troughs (-PNA) will offset a potential cold January weather pattern for the U.S. This means that most U.S. natural gas areas will be warmer than normal.
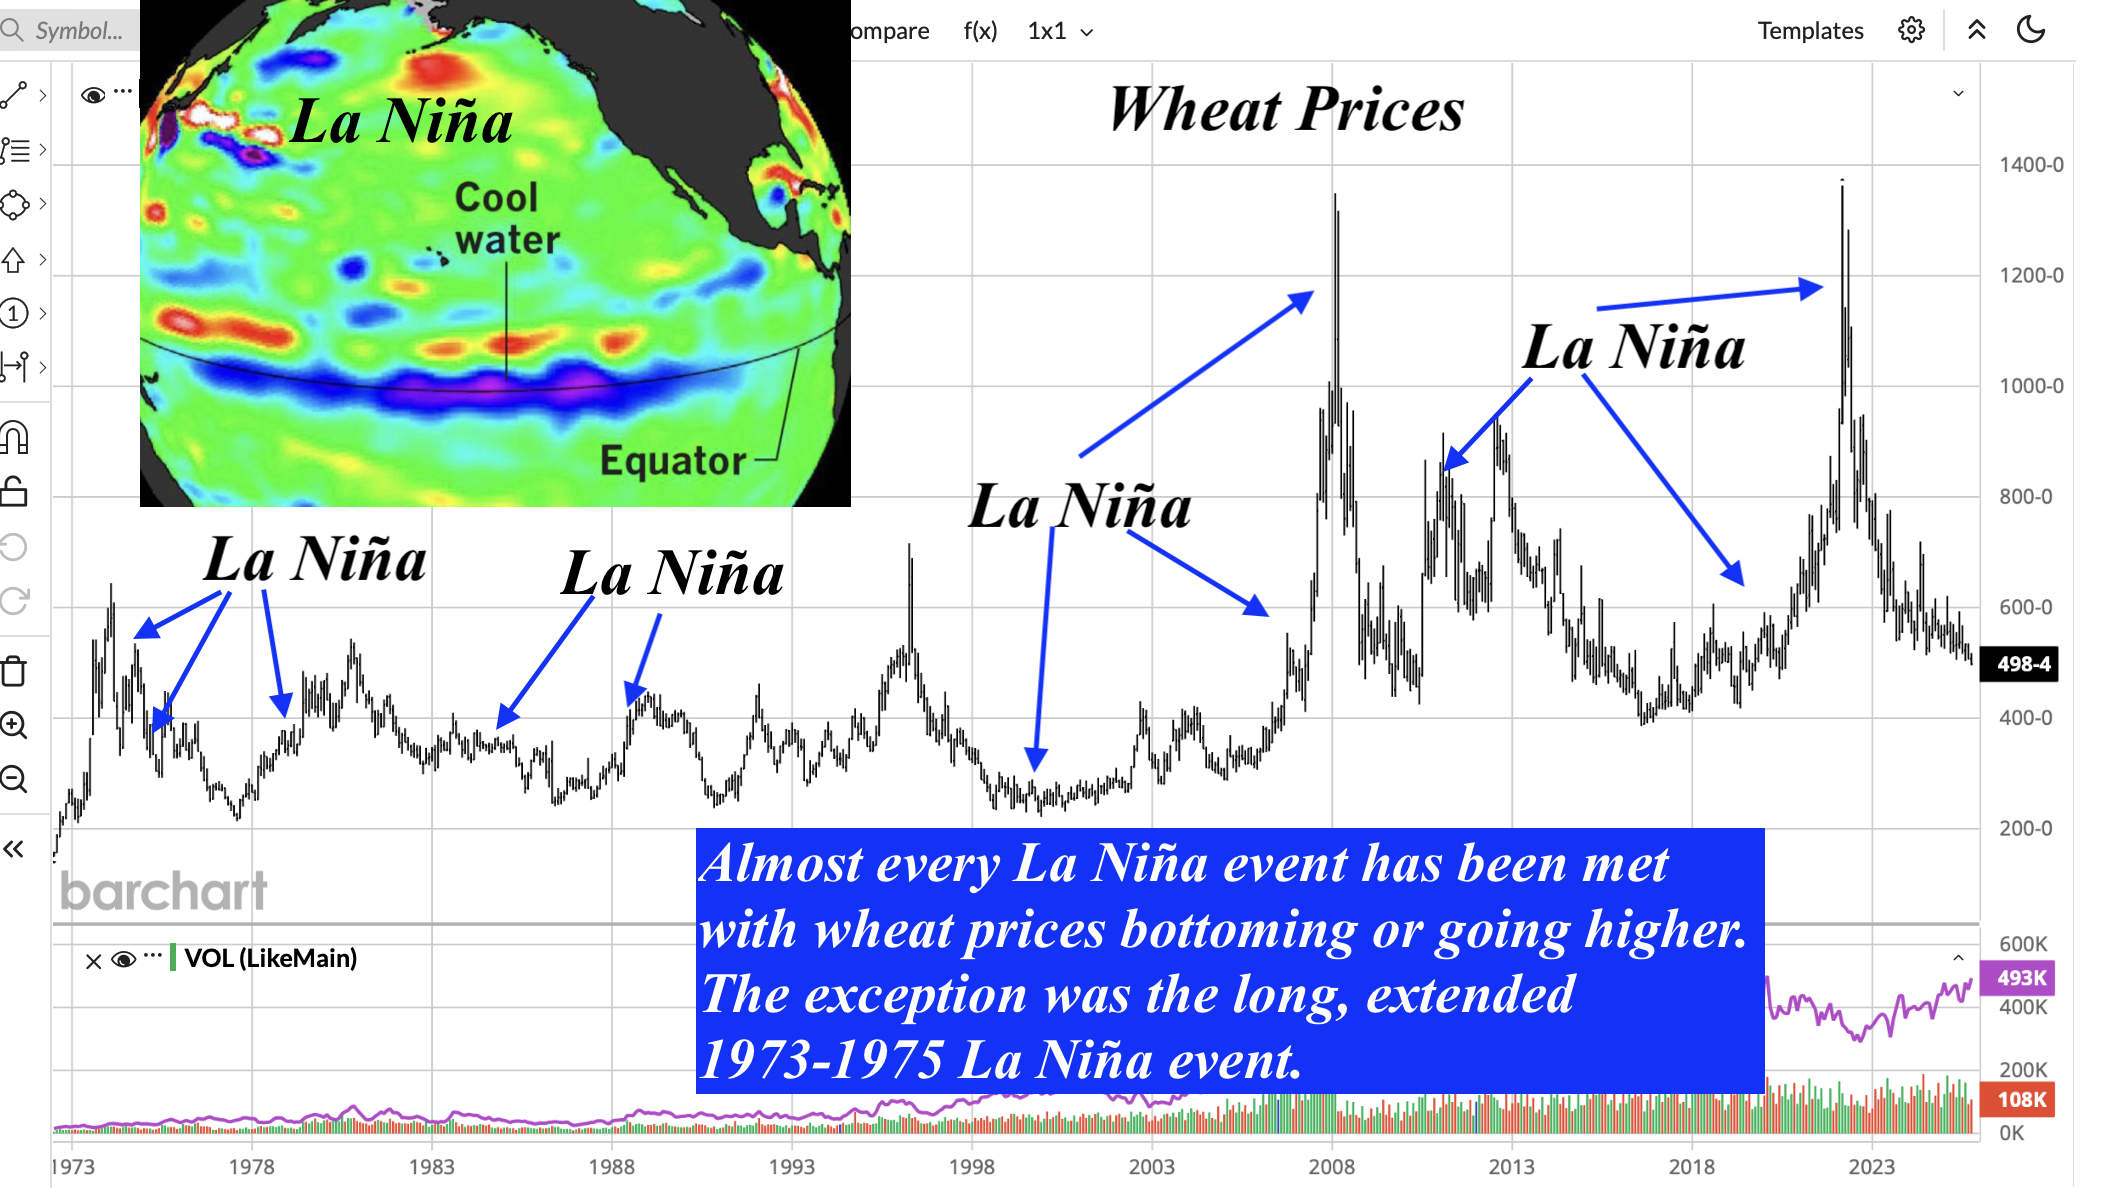
4)How strong vs weak La Niña events affect the weather in January
Following some free reports about weather and commodities here on Substack
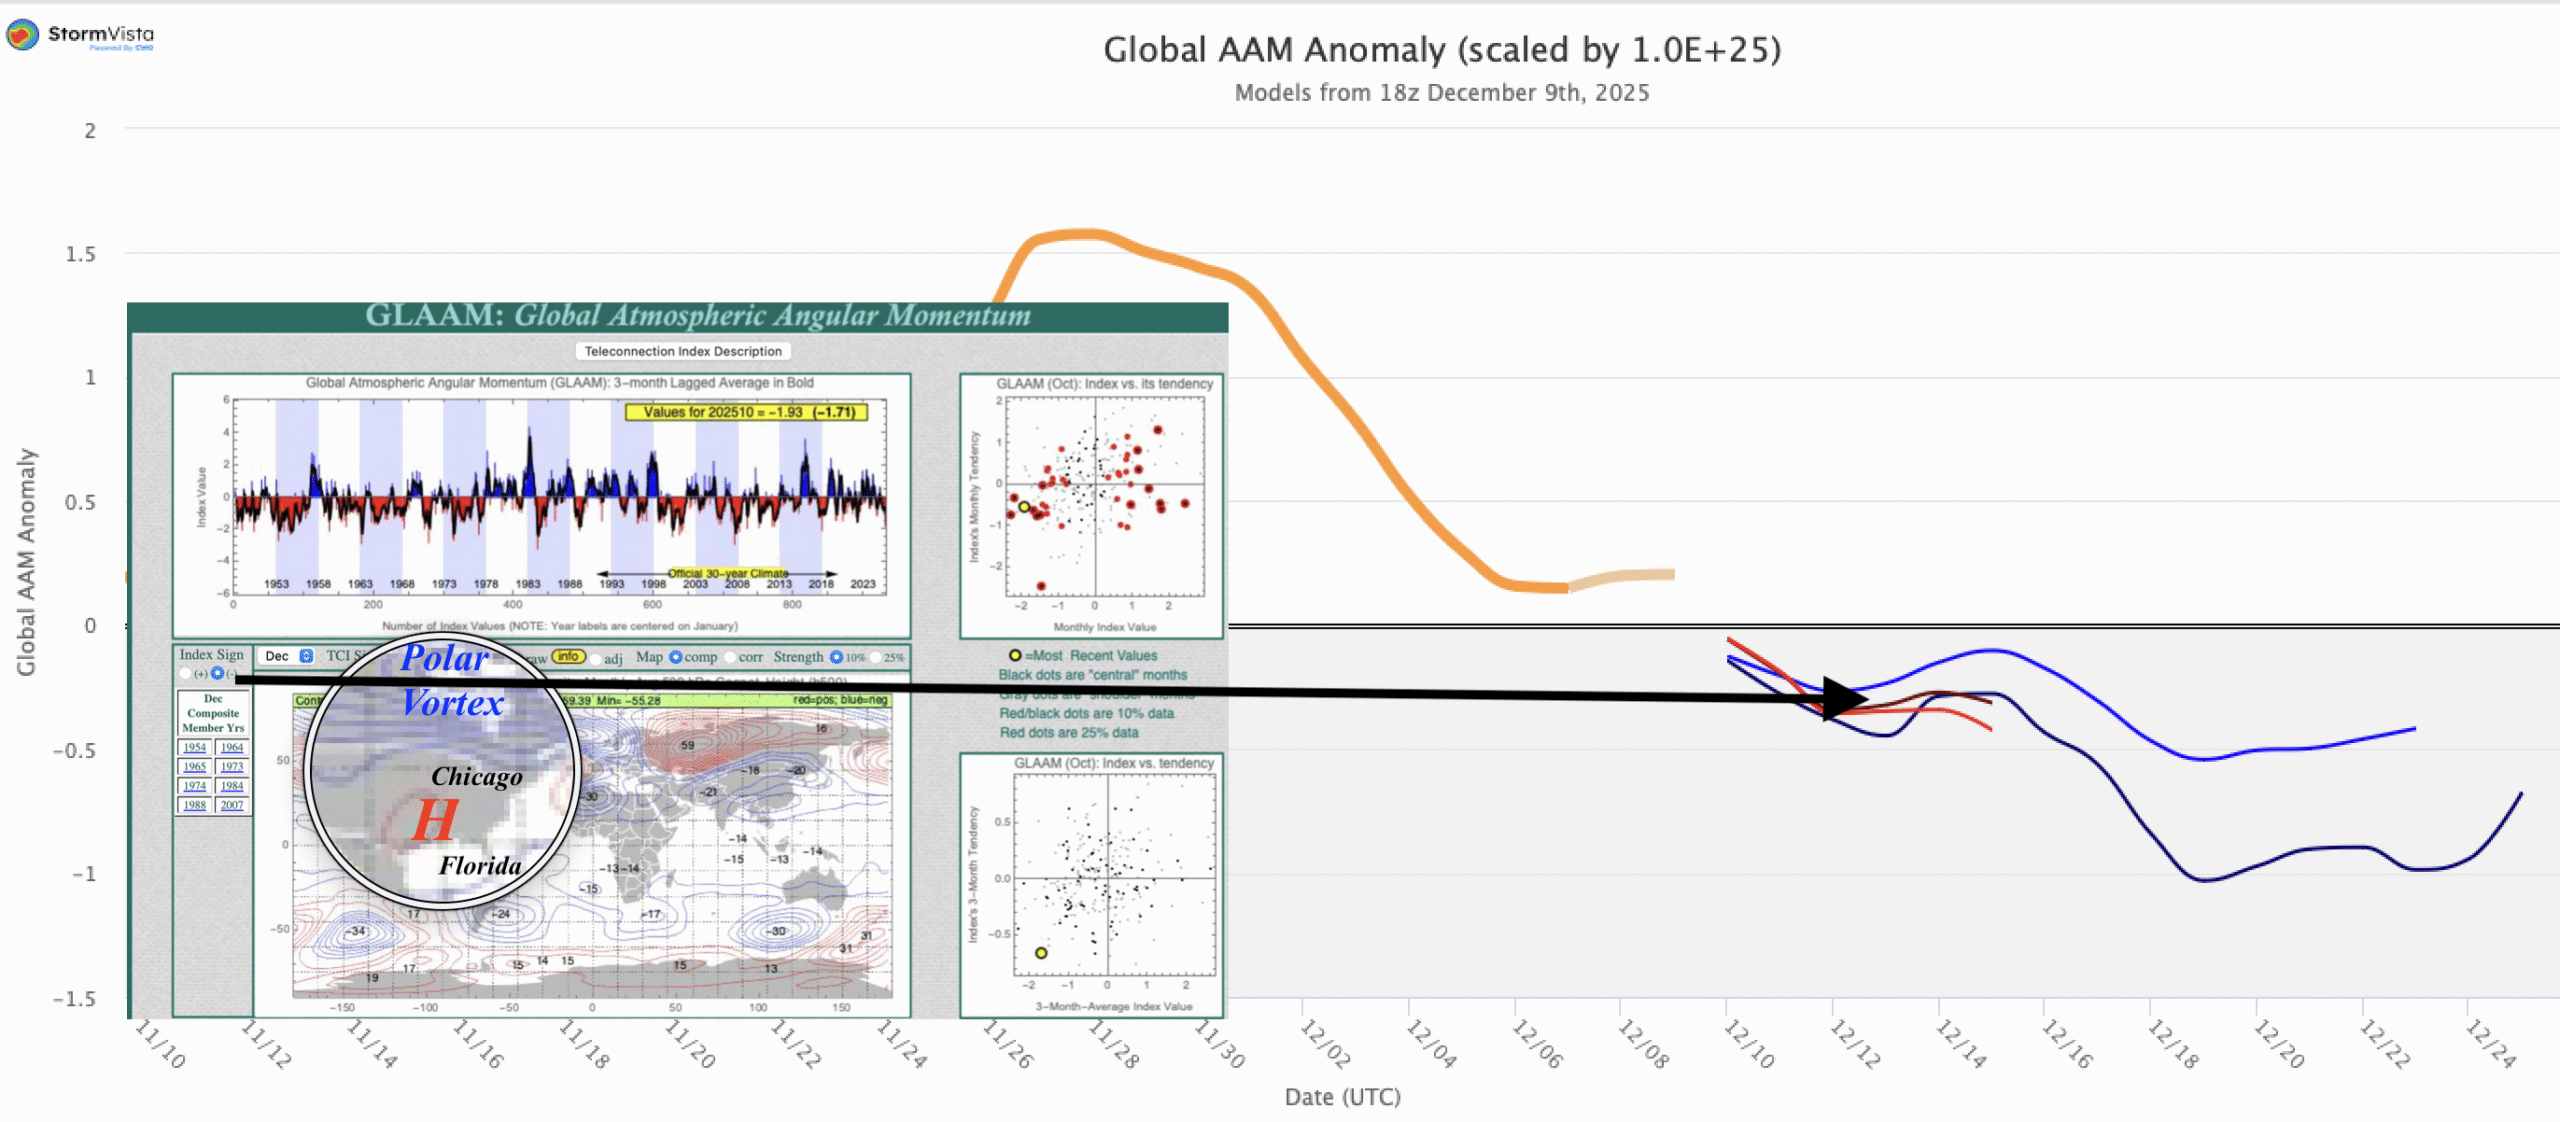
GLAAM stands for Global Atmospheric Angular Momentum in weather forecasting. It is sometimes referred to as GAM and/or GLAM, but they all refer to the same phenomenon. It measures the atmosphere’s rotation, combining Earth’s spin and wind patterns, acting as a crucial index for global circulation and Earth’s rotation, used to understand large-scale climate patterns like ENSO and predict seasonal changes, linking atmospheric shifts to length-of-day variations via numerical models.
There are both positive and negative angular momentum phenomena, and it is the negative GLAAM that is responsible for the mid-late December warm up over most of the United States and (as of this writing) the massive 20% sell-off in natural gas in just a few days.
Key Concepts
What it is: A measure of the total rotational momentum of the atmosphere around Earth’s axis, calculated by integrating wind speeds and densities across the globe.
Components: It includes the momentum from Earth’s own rotation (mass term) and the momentum from atmospheric winds (wind term), which vary seasonally.
Why it Matters:
Earth’s Rotation: Fluctuations in GLAAM directly affect the Earth’s rotation speed and thus the length of the day (LOD).
Atmospheric Dynamics: It helps study how mountains, surface friction, and jet streams influence global weather patterns.
How it is used in forecasting:
Monitoring: Atmospheric angular momentum is monitored in real-time using data from numerical weather models (like NASA’s GEOS models).
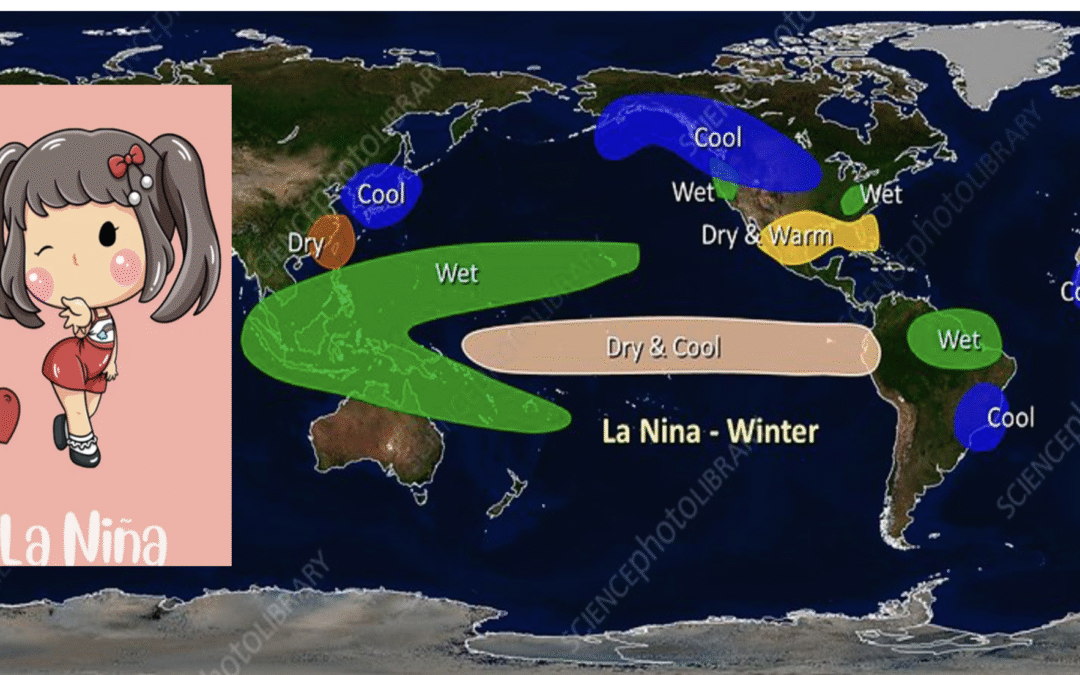
Seasonal Forecasts: Negative GLAAM often signals conditions favoring La Niña, potentially leading to cooler, snowier winters in certain regions, while positive GLAAM links to El Niño patterns.
Predictability: Studies suggest long-range forecasts of GLAAM (up to a year) are possible, offering insights into future climate.
In essence, GLAAM provides a unified view of atmospheric dynamics, linking winds to Earth’s rotation and helping forecast broader climate trends.
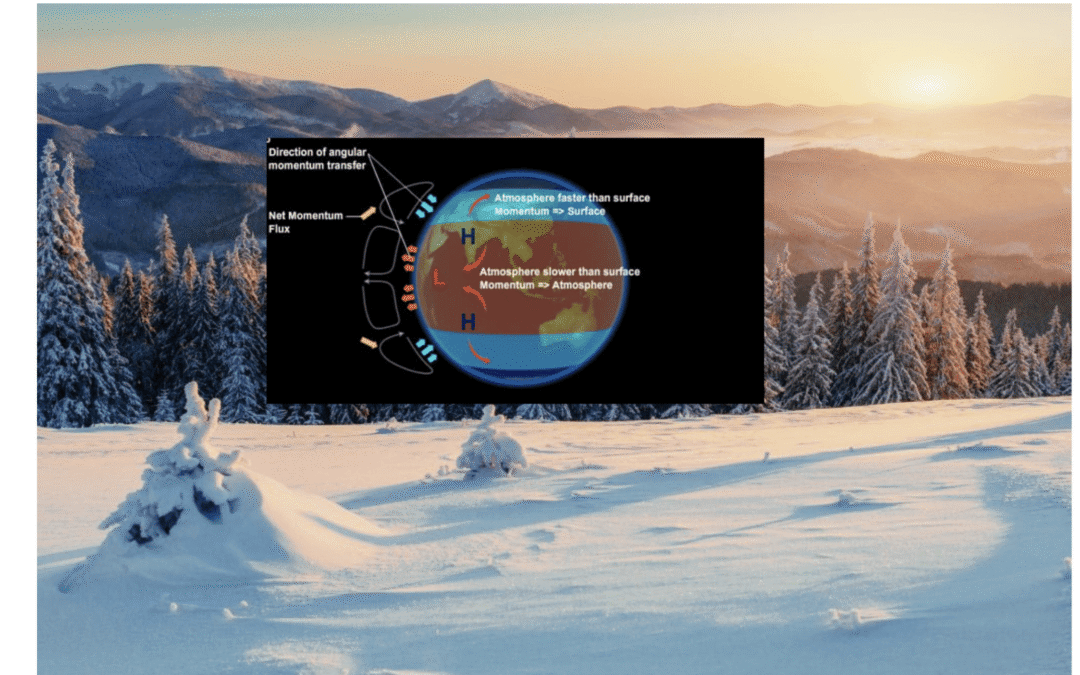
Negative global atmospheric angular momentum (GLAAM) is associated with La Niña conditions and can contribute to warmer winter weather in parts of the U.S. by altering global circulation patterns, particularly the jet stream.
During a negative GLAAM phase, the atmosphere moves more slowly relative to the Earth’s surface. Thinks of it like the skater to the right.
This change is consistent with and helps maintain La Niña conditions. During La Niña, the trade winds blowing east-to-west across the tropical Pacific are stronger than usual. These strong trade winds push warm surface water toward Asia, allowing colder, nutrient-rich water to upwell along the American west coast. This process is a key feature of La Niña, and the associated atmospheric circulation changes are reflected in the negative GLAAM.
Will the Polar Vortex come south again by January? Will GLAAM go in the opposite direction and become positive? If so, natural gas prices would rally again, as we approach January.
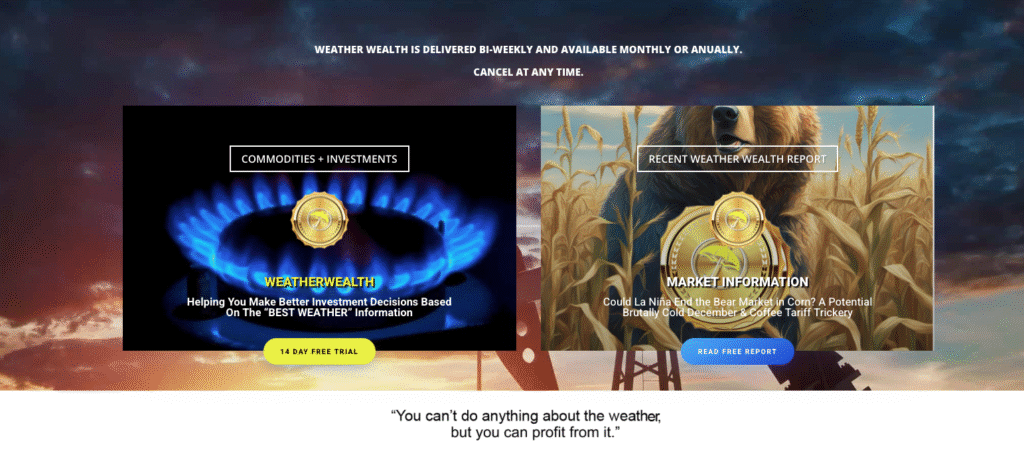
That is what we do at WeatherWealth: We “out forecast” standard weather models and making trade recommendations for clients in soft, grain and natural gas commodities on six continents.
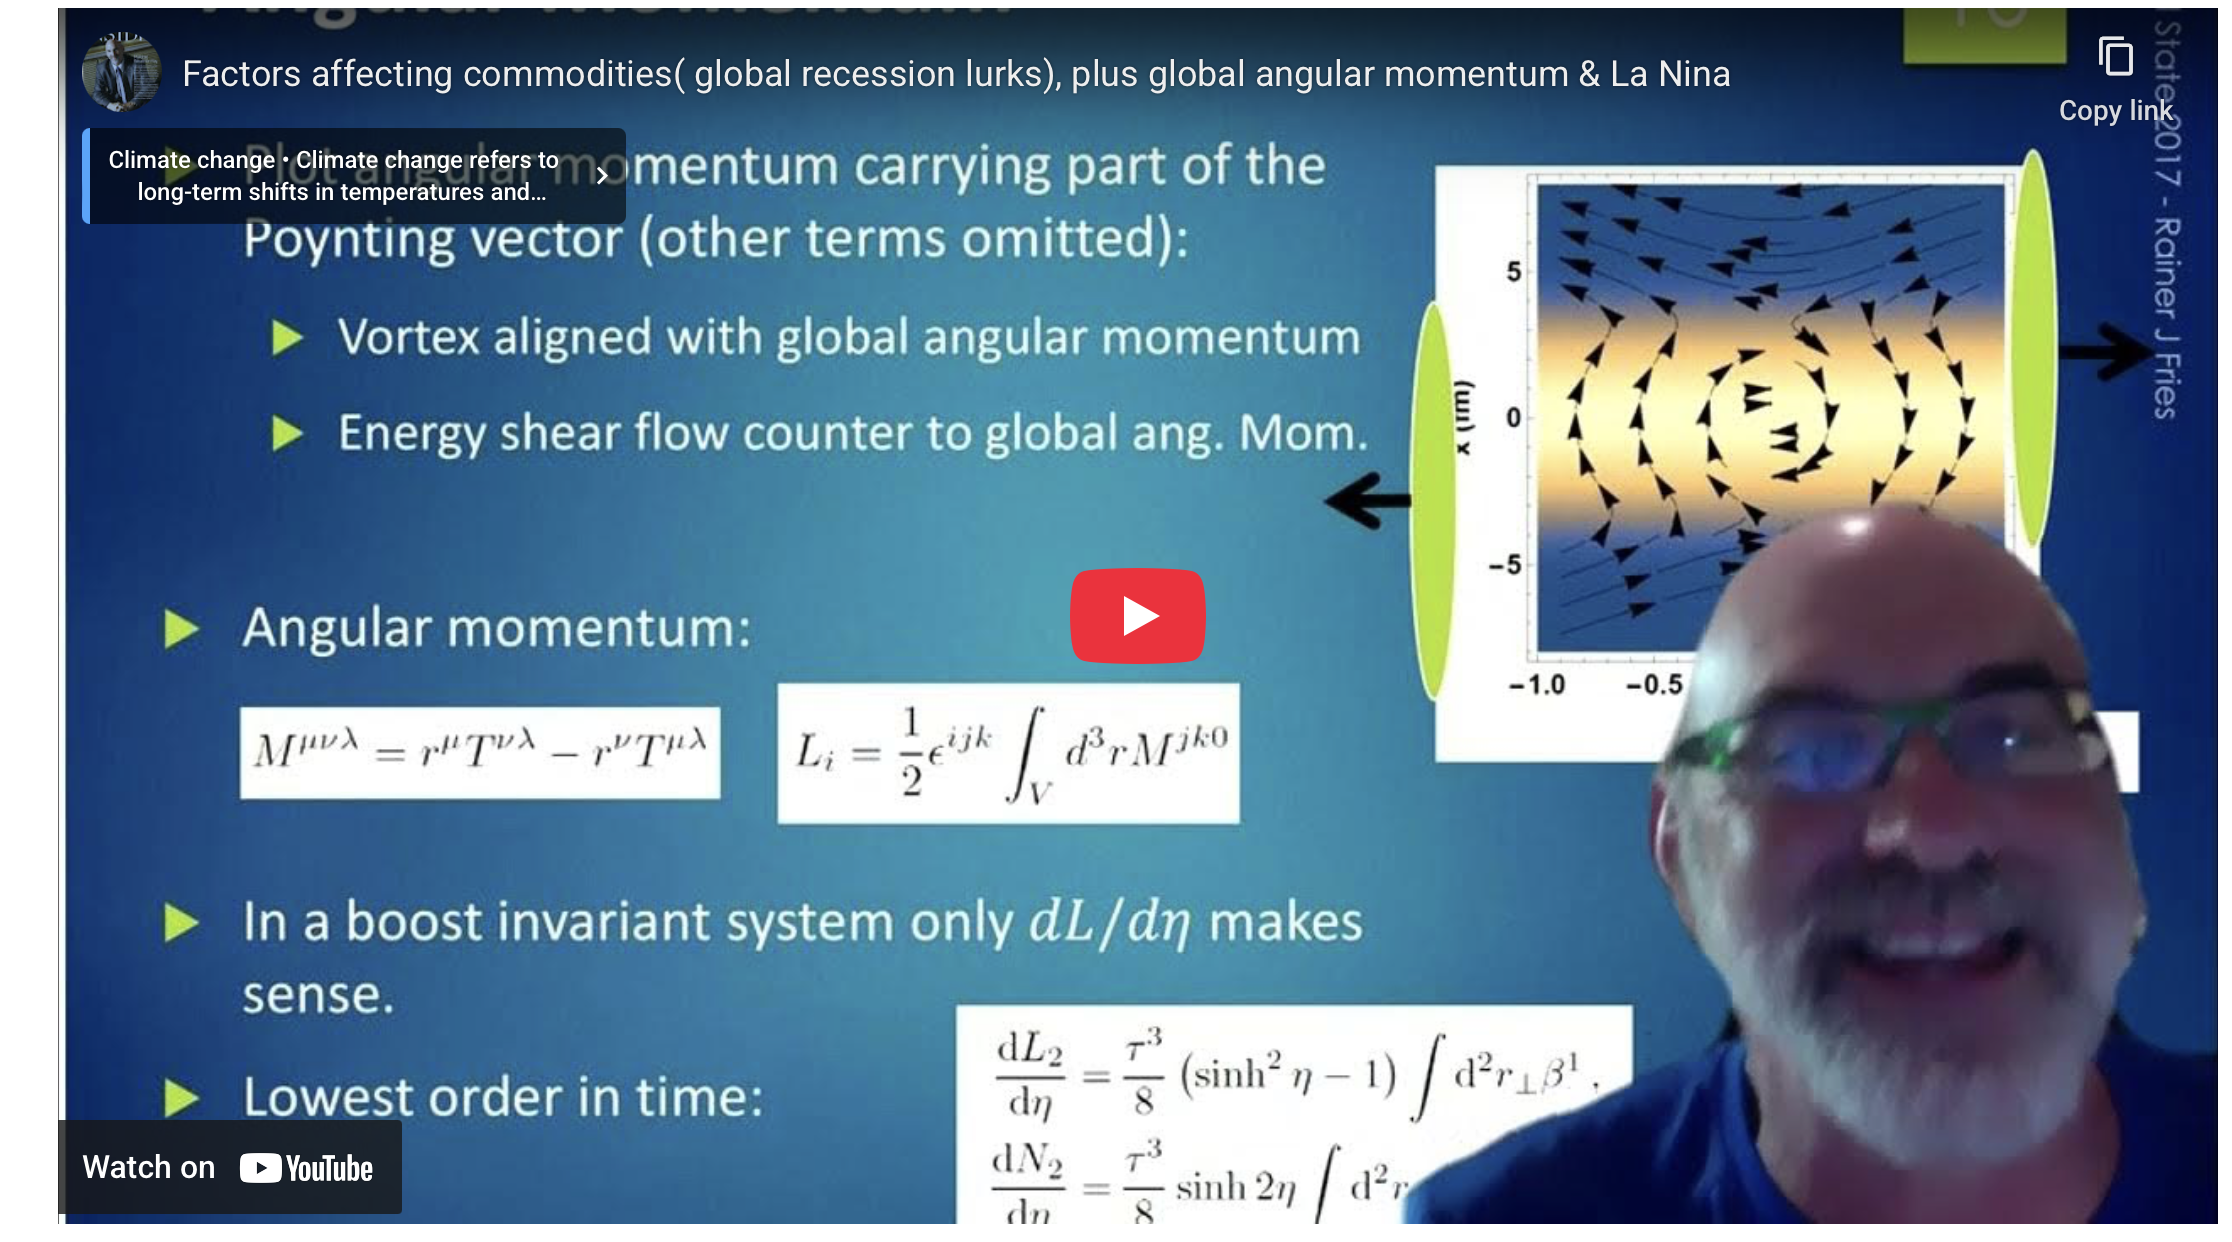
This video points out the power of weather on commodity markets. How can you potentially profit using the weather in your investment portfolio?
(click below)
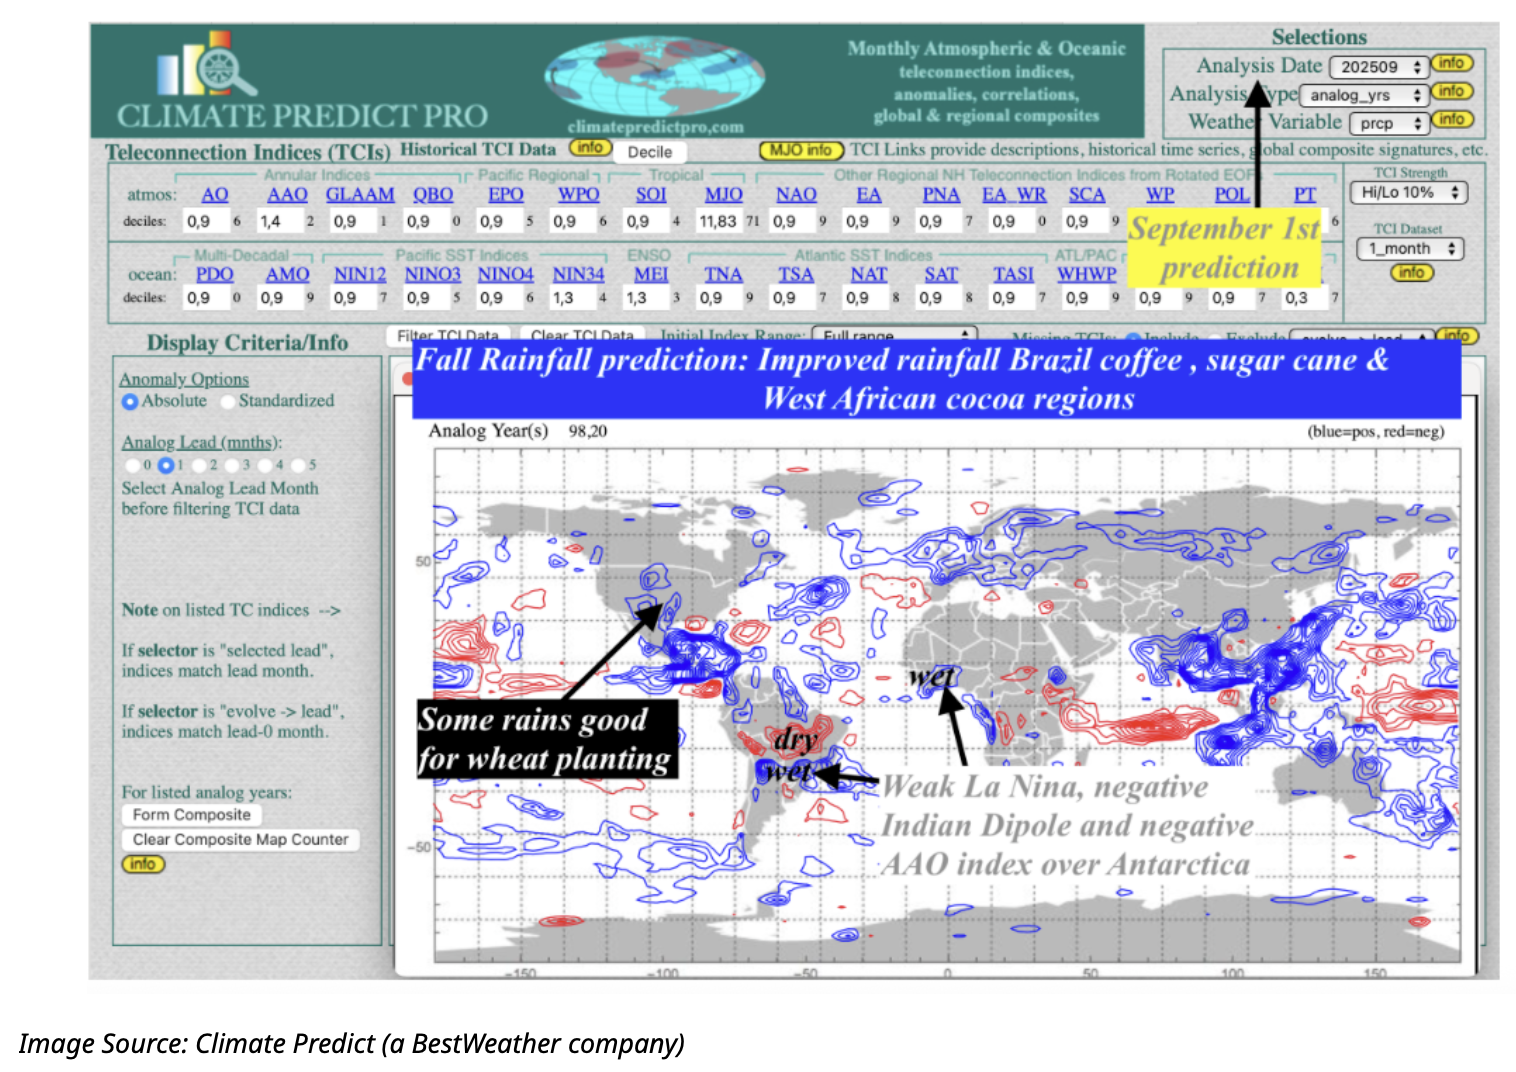
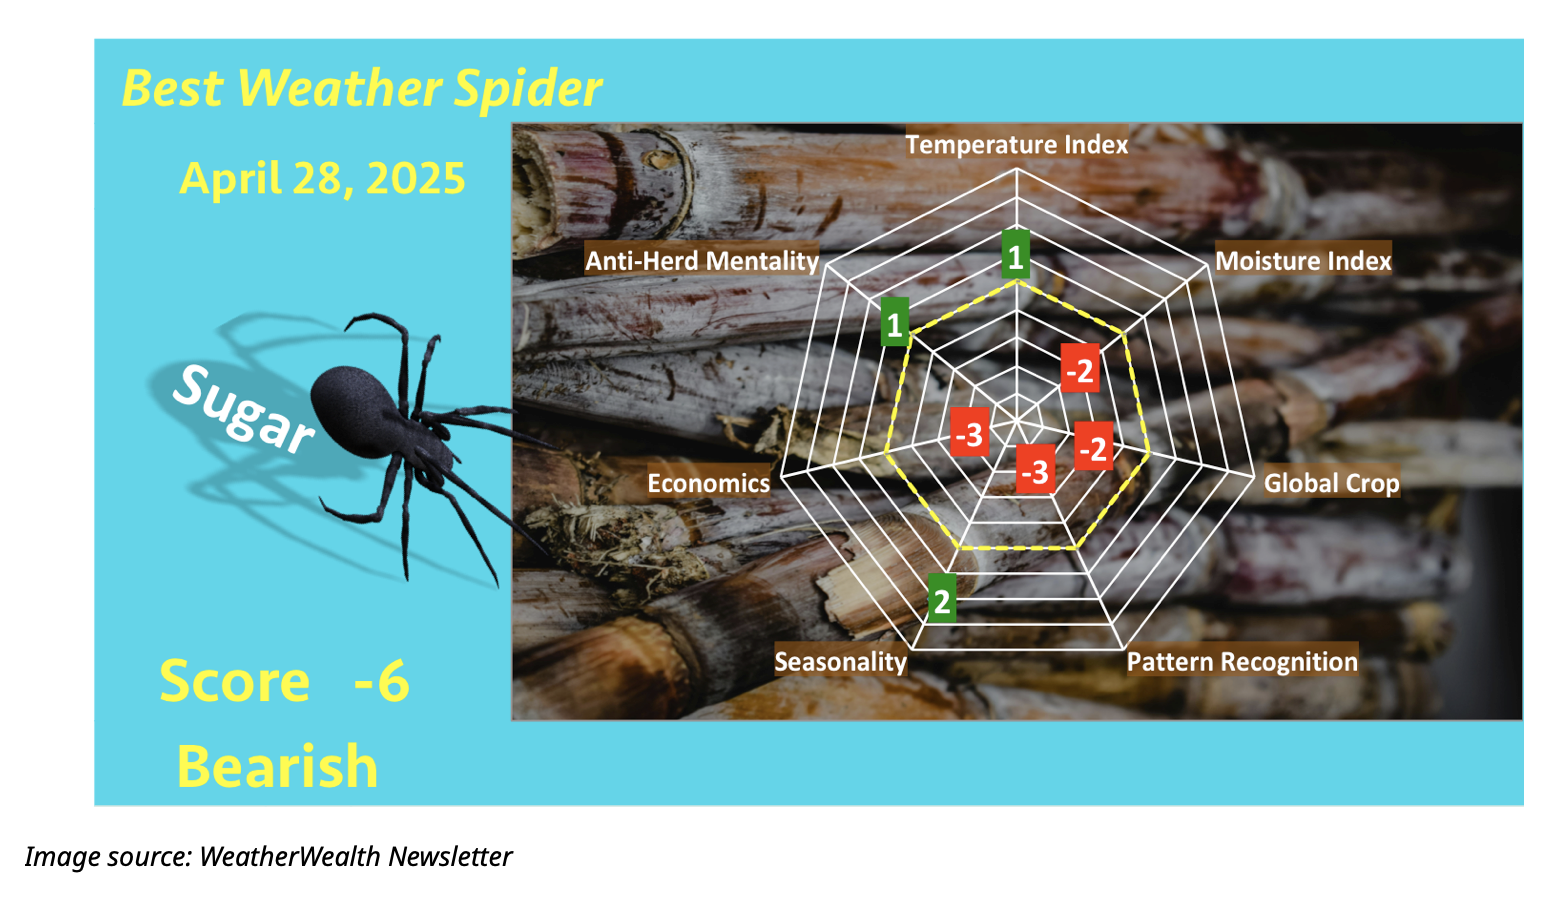
Most recently, a developing La Niña event combined with a negative Indian Ocean Dipole in the Pacific and a weak negative Antarctic Oscillation Index is causing bear markets in cocoa and sugar. Coffee prices may be next (especially if trade tariff tensions ease with Brazil), as we have been predicting the end of Brazil’s multi-year drought for two months.
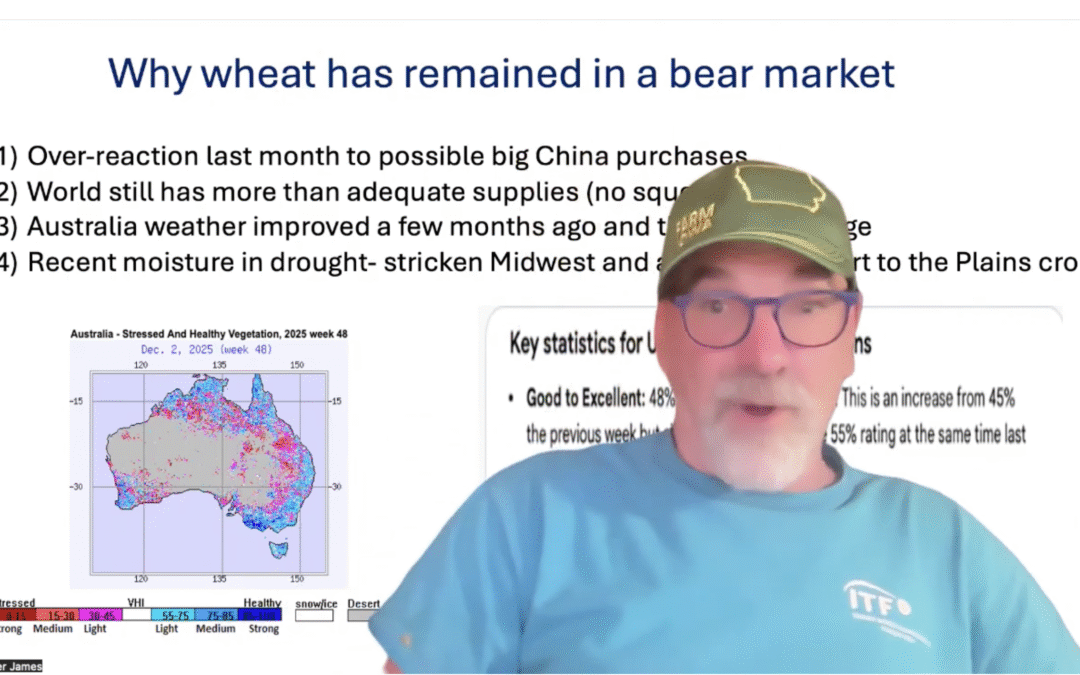
In addition, the rains in Australia and generally good global wheat crops have kept the wheat futures markets in a downtrend. Could that change next year with La Niña?
Screenshot
While the grain market has been hurt by more record global crops, trade tariffs, and poor demand, could La Niña end the bear market by 2026? It is possible.
The US corn crop has come down from a dry late summer and disease issues, and may be the one lone bullish Ag star after the US grain harvest.
You can now receive occasional free weather and commodity discussions on SUBSTACK (click below)
For specific trading and hedging strategies and much more frequent commodity weather ideas, and our BestWeather Spiders for all commodities:Click here for a two week FREE TRIAL for $1
It discusses all of Jim Roemer’s weather forecasting techniques he uses for multiple commodity markets. It is very detailed concerning the “complexities” of analyzing global cocoa production and the market. He discusses how a dry summer in West Africa has benefited the main crop (unlike the wet, disease-infested summer of 2024).
However, a potential drier than normal 2nd rainy season may be in the cards that could compromise the next crop if timely rains due not return by September.
HELPING YOU MAKE THE BEST INVESTMENT DECISIONS BASED ON THE WEATHER
We use cookies to ensure that we give you the best experience on our website. If you continue to use this site we will assume that you are happy with it.