New Orleans and Texas are no stranger to hurricanes. Hurricane Katrina in August, 2005 created one of the worst national disasters in history, while two years ago, the city of Houston witnessed more than 30″ of rain that temporarily put the nation’s refinery capacity out of commission. But how might tropical storm Barry affect commodities and especially the energy markets?
In this report below I discuss the implications to the energy market from tropical storm Barry, and what a weakening El Nino Modoki might portend for this hurricane season.
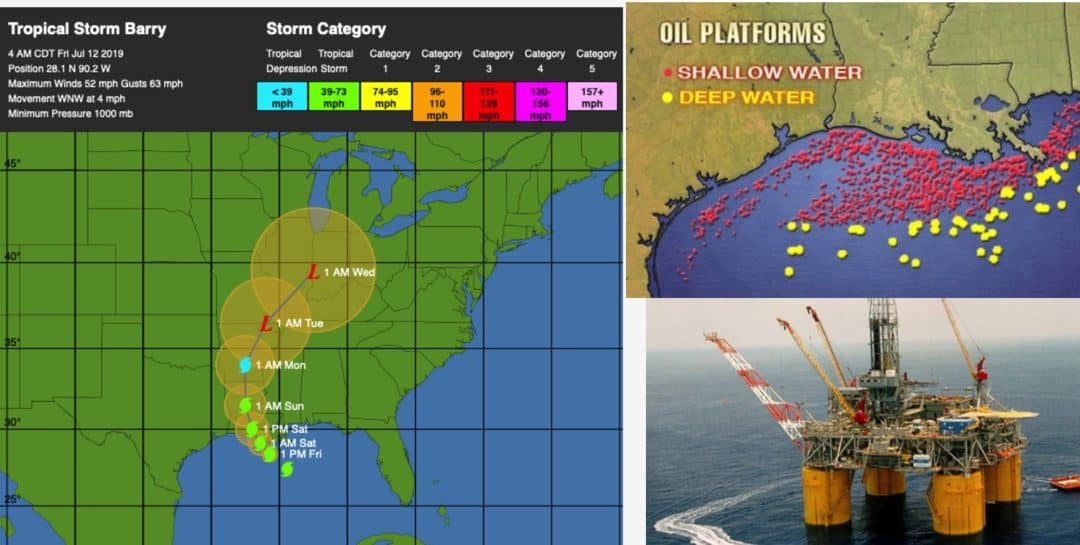
TROPICAL STORM BARRY
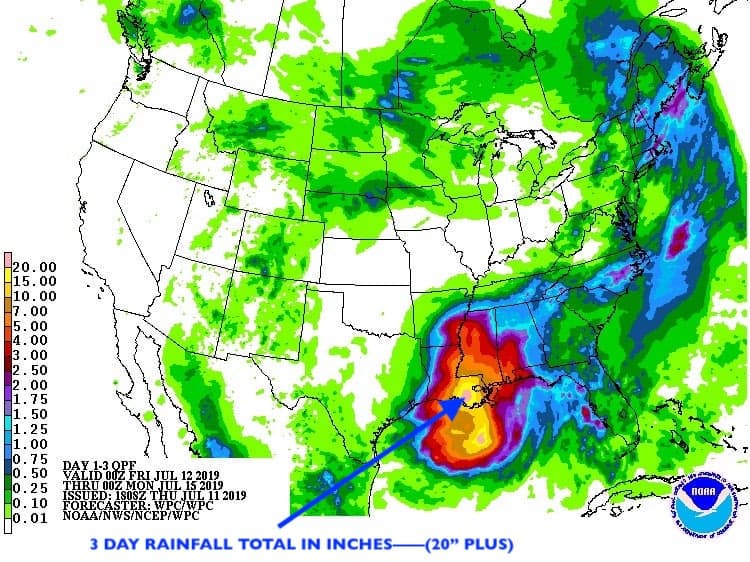
There remains the potential for some amount of storm surge to work its way up the Mississippi toward New Orleans, although this threat is diminishing as Barry struggles to organize. Still, the Mississippi has experienced record-prolonged flooding this year, and the arrival of an early-season tropical cyclone atop late-season flooding is an unusual and concerning prospect.
The Mississippi River, which is usually at 6 to 8 feet around New Orleans this time of year, it is at 16 feet after a year of record flooding. And 10-15+ more inches of rain are on the way.
ENERGY MARKETS
So what might be the implications for the energy markets? First of all, with respect to natural gas, prices have been under pressure since the end of winter due to a mild late winter and spring. Only recently have prices rebounded off three year lows, due in part to some hot Midwestern and eastern weather and the psychology of a potential hot summer. However, a tropical storm, if anything can actually hurt demand for natural gas in the South. Unlike the Pre-Katrina years, close to 80% of natural gas production is from shale and not in the Gulf of Mexico. Hence, Barry will have little affect in the market, even though there are some short term shut-downs in the Gulf. Hot weather is driving natural gas prices higher, for the moment.
CRUDE OIL, GASOLINE AND HEATING OIL
Hurricanes are simply not as bullish as they once were, unless you have a Hurricane Harvey situation (one in a 50 year event) the floods refineries for days on end. Even during Harvey in 2017, you saw crude oil prices collapse, while gasoline rallied due to refinery issues. While an estimated 53% of Gulf oil production is shut down, without major hurricane force winds, oil rigs in the Gulf can easily withstand just heavy rains and high seas for a couple days. With respect to crude oil, demand curtailment, from slow to return refinery problems, actually can be “bearish” the crude oil market. That is what happened in 2017 with Harvey as crude oil prices collapsed for several days, while gasoline prices soared due to refinery issues.
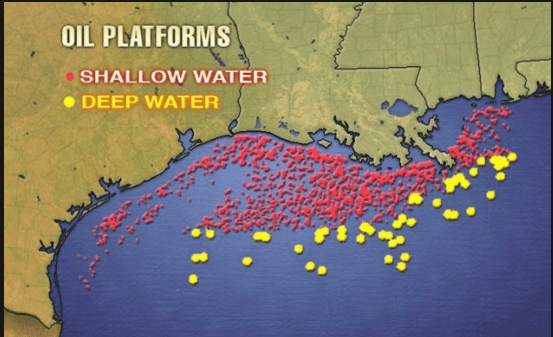
The map above shows the location of the majority of US oil rigs. It is much more important to the crude oil market what OPEC ends up doing with respect to their projected production cuts, as well as the global demand part of the equation and whether American shale production continues booming head.
There can be knee-jerk reactions in the energy markets from tropical storms and hurricanes, but often it is “buy the rumor”, sell the fact. Nevertheless, instances like during Hurricane Harvey can create major price spikes in gasoline because it hit during the heart of the summer vacation driving season and put many refineries in Texas out of commission for days. For an interesting article about Harvey and the surge in gas prices, click here
WHAT IS EL NINO MODOKI AND A LOOK AT SOME POTENTIAL HURRICANE ANALOG YEARS
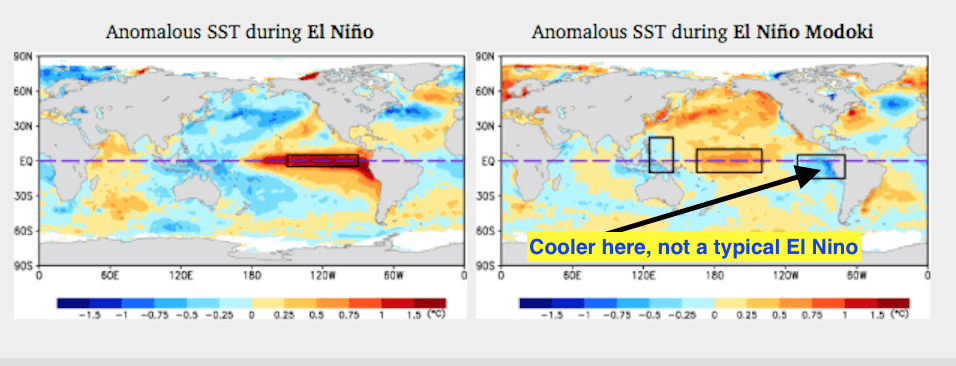
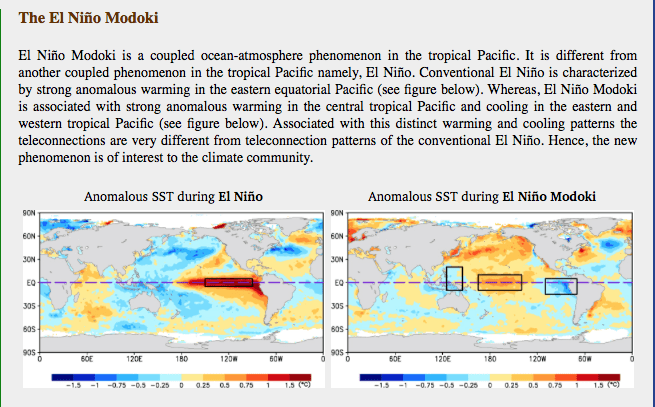
El Nino is weakening and that could enhance this season’s hurricane season because it reduces shear in the Gulf coast and Atlantic. Ocean temperatures in the eastern Equatorial Pacific, (near Peru) are cooler than normal, whereas in the western Pacific it is still warmer than normal. This is a bit unusual as most El Nino’s see warmer than normal sea surface temperatures closer to the West coast of South America. These warmer waters typically cause shear and reduce hurricane activity. The fact that hurricane Florence and David were so intense last year, was a sign that El Nino was weak last year and slow to develop.
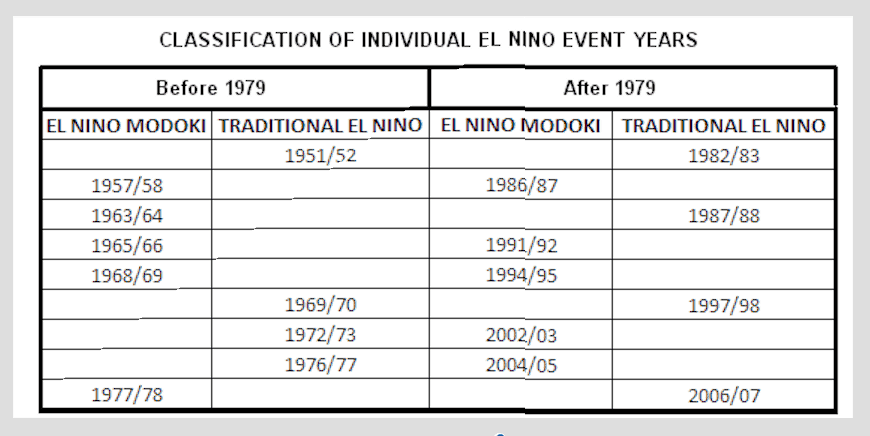
I took a look at 4 particular El Nino Modoki events since 1950 that seemed somewhat similar to today–An El Nino Mokadi that is slowly weakening and may even become a La Nina or El Nino neutral event by fall or winter.
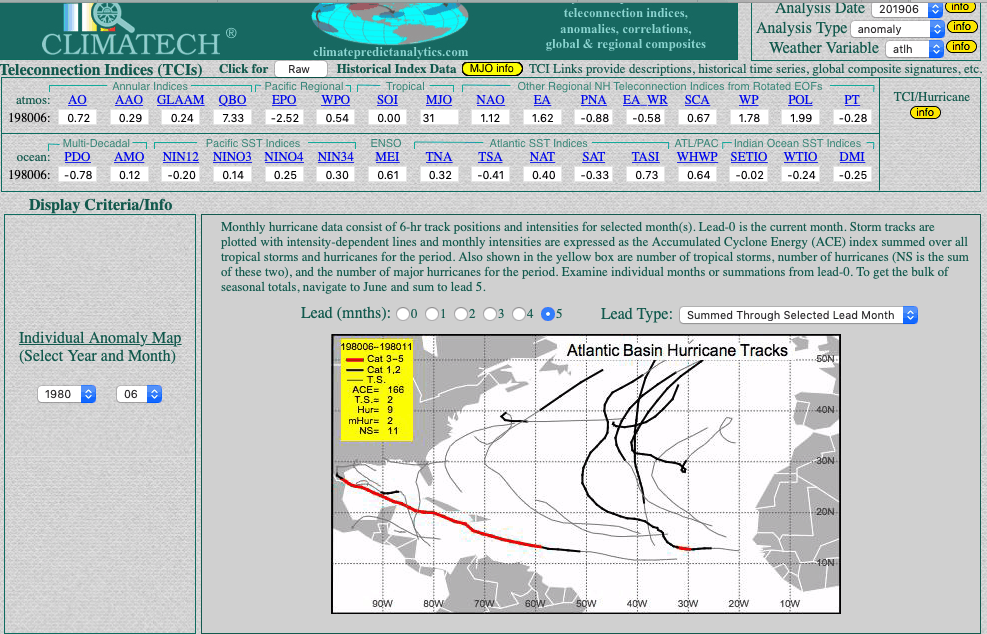
The years I found were 1958, 1980, 1992 and of course the infamous historical 2005 hurricane season.
–1958 had 11 named storms, in which 3 were major hurricanes. Most of these tropical storms or hurricanes “missed” the United States, though there were a couple tropical storms that hit Texas.
–1980 was the year of an infamous spring and summer drought across much of the country, following the eruption of Mt. Helen. Quite a contrast to this year’s historical wet spring and severe weather season. Nevertheless, here too there were 11 names storms and two major hurricanes.
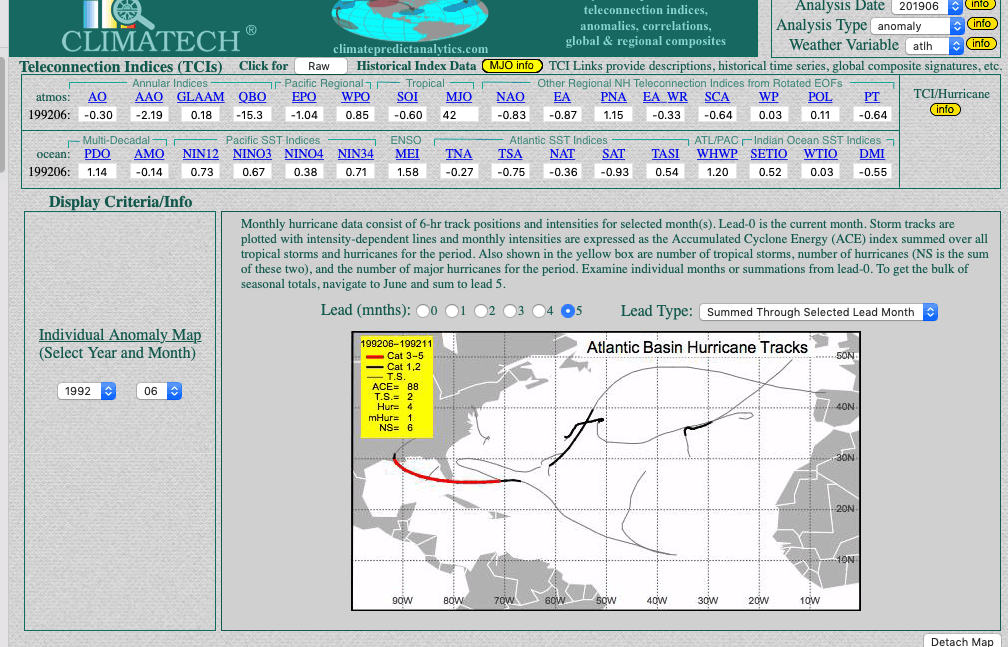
–1992 was a weak hurricane season with only 6 named storms. However, hurricane Andrew was a category 5 that wiped out south Florida and then the Gulf of Mexico (it only takes one). However, ocean temperatures then were a lot cooler than they are today.
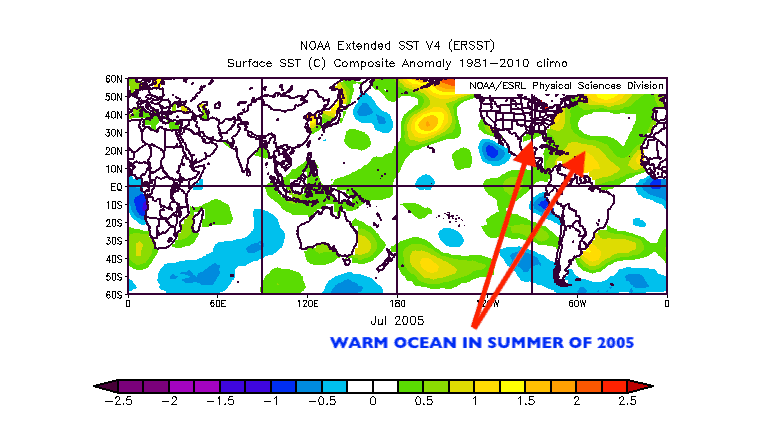
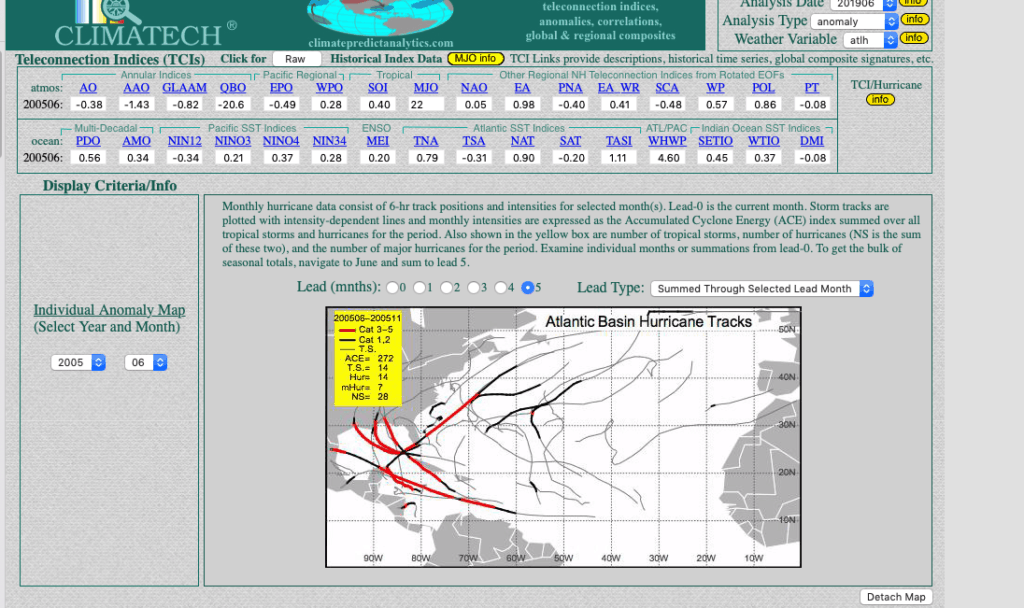
–Finally, 2005 had a record 28 named storms and 7 where major hurricanes with many of them hitting the United States.
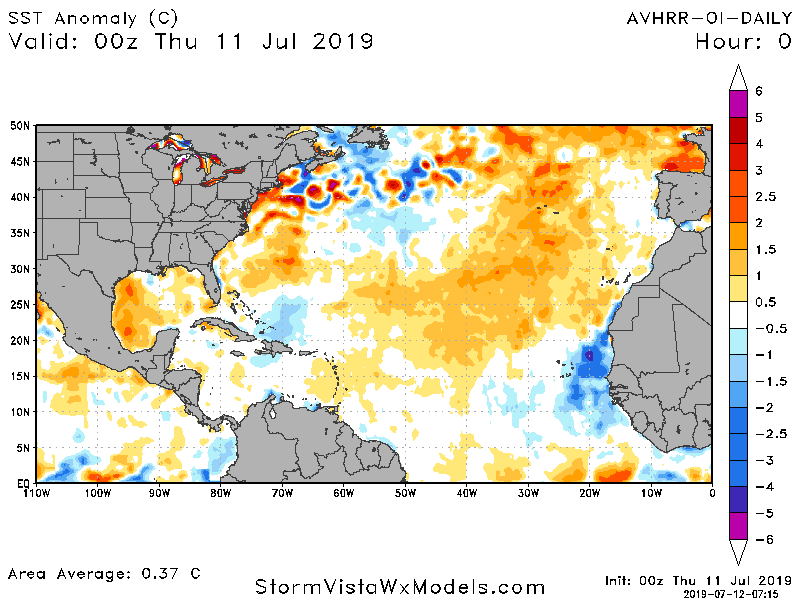
(map above) Plenty of warm water temperatures presently in the Gulf of Mexico and the Eastern Atlantic. The cool (blue) temperatures off the coast of West Africa could retard tropical waves coming off the West coast of Africa again this summer. This existed last year and was responsible for an inactive first half of the season.
BOTTOM LINE–With El Nino weakening and warm Gulf and Atlantic ocean currents , most of the analog years listed above , suggest a normal to active hurricane season with the potential for at least 3 major hurricanes later this summer and fall. Three of the 4 analog years listed above had at least one modest to major hurricane hitting the United States with the greatest risk being Florida and/or the Gulf.
WEAKENING EL NINO MODOKI YEARS AND ASSOCIATED TROPICAL STORM AND HURRICANE TRACKS (BELOW)
We produced this item on Dec. 7, 2018 – Jim Roemer
Our blogs are almost entirely weather related, discussing commodities and how weather can affect everything from natural gas to coffee, cocoa and the grain market. However, we occasionally cover the realm of economics beyond the commodity sphere. For nearly a month, we’ve held the personal sentiment that the hype in the stock market should soon be coming to an end. Signs of inflation in the broad economy have been elusive, but the lofty price of stocks and other assets proves that inflation is actually higher than is reported in the financial press.
It’s “in the mail”
A first class postage stamp is now 50 cents. In 2008 it was 42 cents. I’ll do the math for you: 19%
Inflation has persisted in many goods and services that are not represented in the Consumer Price Index. The Fed’s use of a truncated, subjectively crafted, CPI has serious repercussions on their activities with respect to money supply and interest rates. Common sense and observation tells us that cars, food, hair cuts and newspapers have had double digit percentage price rises in the last few years.
Policy makers have papered over (shall we say whitewashed) some significant facts in the global economy. The Trade War with China is only one element of my theory. In addition, law makers have hidden many other problems and set the stage for an economy that is unable to bear higher interest rates in an “easy money” decade.
Reality Sets In
Our huge debt is starting to wake up our financial markets to this reality. Debt is getting more and more expensive to service. Hence, why in the world would the Fed listen to Donald Trump urging them “not to raise” interest rates? As a proverbial “loose cannon” is on many fronts, he seems to have little conscience about doing the “the right thing” other than lining his own pockets at the expense of all Americans.
What’s That Ticking Sound?
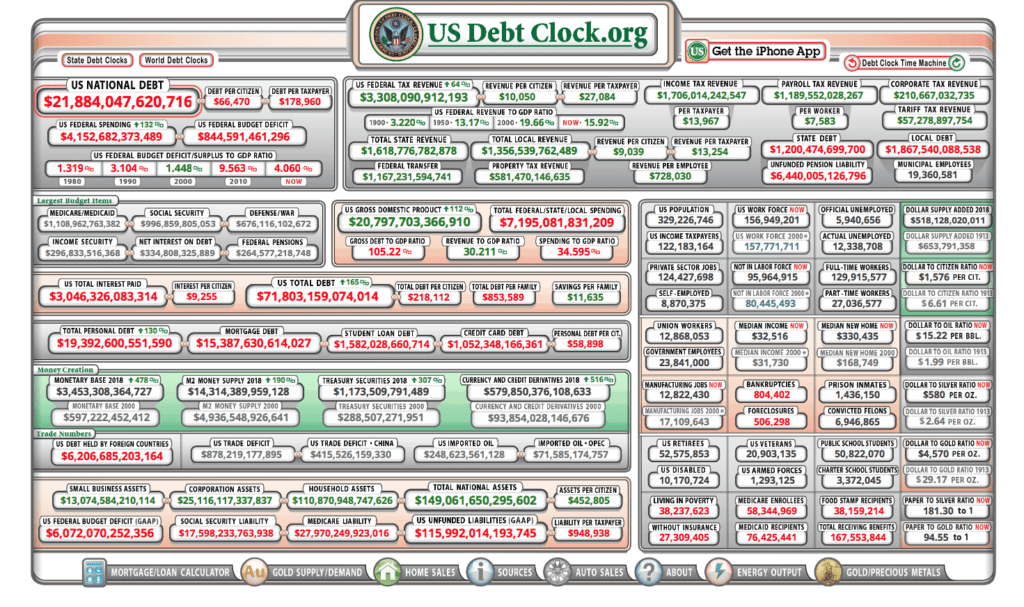
Markets are starting to break down, as we have built gigantic bubbles on this unprecedented amount of cheap money and quantitative easing. Check out this link to the nation’s debt clock.
Another sign of potential trouble heading for the global economy is often the crude oil market. Lower crude oil prices are often a forerunner of more serious global economic trends ahead. While it may be a bit late to take advantage of the sell-off in crude oil to the short side, overproduction continues in many countries, including the United States. Lower oil prices (which imply lower gasoline and heating oil prices) are, of course, great for the American consumer—one shining point of light in what could still be a rough and volatile road ahead for the U.S. stock market
Our CLIMATELLIGENCE newsletter aims to assist both the novice and the experienced trader how to “weather” the storm of the financial markets. We do this by using weather to offer trading ideas in everything from natural gas futures and ETF’s to grains and soft commodities.
A cold winter is on tap for the United States, but that does not mitigate the long-term effects of a warming planet, rising sea levels, and the destruction of reefs around the globe. While China and other countries are taking measures to adapt to global warming, the Trump Administration better get its act together, especially given the recent government report about Climate Change (see below).
In the meantime to find out how you can trade stocks and commodities on what will be one of the coldest winters in years in the United States, please click here
Jim Roemer
November 23 at 2:00 PM
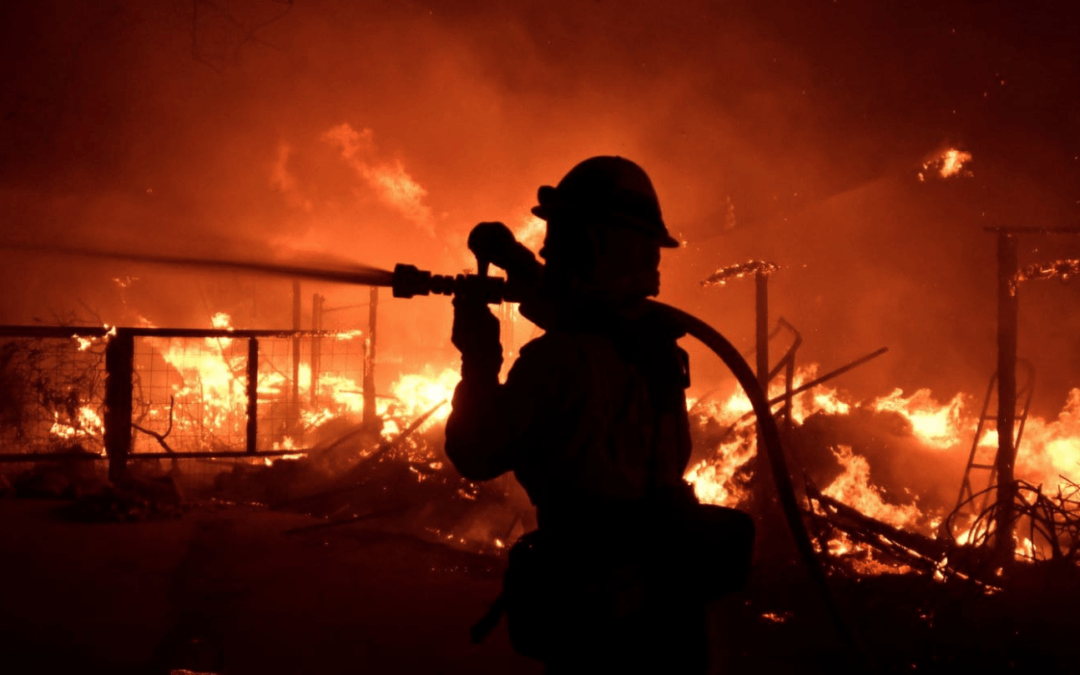
The federal government on Friday released a long-awaited report with an unmistakable message: The impacts of climate change, from deadly wildfires to increasingly debilitating hurricanes and heat waves, are already battering the United States, and the danger of more such catastrophes is worsening.
The report’s authors, who represent numerous federal agencies, say they are more certain than ever that climate change poses a severe threat to Americans’ health and pocketbooks, as well as to the country’s infrastructure and natural resources. And while it avoids policy recommendations, the report’s sense of urgency and alarm stand in stark contrast to the lack of any apparent plan from President Trump to tackle the problems, which, according to the government he runs, are increasingly dire.
The congressionally mandated document — the first of its kind issued during the Trump administration — details how climate-fueled disasters and other types of worrying changes are becoming more commonplace throughout the country and how much worse they could become in the absence of efforts to combat global warming.
Already, western mountain ranges are retaining much less snow throughout the year, threatening water supplies below them. Coral reefs in the Caribbean, Hawaii, Florida and the United States’ Pacific territories are experiencing severe bleaching events. Wildfires are devouring ever-larger areas during longer fire seasons. And the country’s sole Arctic state, Alaska, is seeing a staggering rate of warming that has upended its ecosystems, from once ice-clogged coastlines to increasingly thawing permafrost tundras.
The National Climate Assessment’s publication marks the government’s fourth comprehensive look at climate-change impacts on the United States since 2000. The last came in 2014. Produced by 13 federal departments and agencies and overseen by the U.S. Global Change Research Program, the report stretches well over 1,000 pages and draws more definitive, and in some cases more startling, conclusions than earlier versions.
The authors argue that global warming “is transforming where and how we live and presents growing challenges to human health and quality of life, the economy, and the natural systems that support us.” And they conclude that humans must act aggressively to adapt to current impacts and mitigate future catastrophes “to avoid substantial damages to the U.S. economy, environment, and human health and well-being over the coming decades.”
“The impacts we’ve seen the last 15 years have continued to get stronger, and that will only continue,” said Gary Yohe, a professor of economics and environmental studies at Wesleyan University who served on a National Academy of Sciences panel that reviewed the report. “We have wasted 15 years of response time. If we waste another five years of response time, the story gets worse. The longer you wait, the faster you have to respond and the more expensive it will be.”
That urgency is at odds with the stance of the Trump administration, which has rolled back several Obama-era environmental regulations and incentivized the production of fossil fuels. Trump also has said he plans to withdraw the nation from the Paris climate accord and questioned the science of climate change just last month, saying on CBS’s “60 Minutes” that “I don’t know that it’s man-made” and that the warming trend “could very well go back.”
Furthermore, as the Northeast faced a cold spell this week, Trump tweeted, “Whatever happened to Global Warming?” This shows a misunderstanding that climate scientists have repeatedly tried to correct — a confusion between daily weather fluctuations and long-term climate trends.
The White House did not immediately respond to a request for comment on Friday’s report. However, the administration last year downplayed a separate government report calling human activity the dominant driver of global warming, saying in a statement that “the climate has changed and is always changing.”
Given that history, some of the scores of scientists and federal officials who spent months working on the detailed document were frustrated, but not surprised, that the administration chose to release it on the day after Thanksgiving — typically one of the slowest news days of the year. Several people involved in the report said its release originally had been planned for early December, but after a behind-the-scenes debate in recent weeks about when to make it public, administration officials settled on Black Friday.
“This report draws a direct connection between the warming atmosphere and the resulting changes that affect Americans’ lives, communities, and livelihoods, now and in the future,” the document reads, concluding that “the evidence of human-caused climate change is overwhelming and continues to strengthen, that the impacts of climate change are intensifying across the country, and that climate-related threats to Americans’ physical, social, and economic well-being are rising.”
The report finds that the continental United States already is 1.8 degrees Fahrenheit warmer than it was 100 years ago, surrounded by seas that are on average nine inches higher and being racked by far worse heat waves than the nation experienced only 50 years ago.
But those figures offer only the prelude to even more potentially severe impacts. The report suggests that by 2050, the country could see as much as 2.3 additional degrees of warming in the continental United States. By that same year, in a high-end global-warming scenario, coral reefs in Hawaii and the U.S. Pacific territories could be bleaching every single year — conditions in which their survival would be in severe doubt. A record-warm year like 2016 would become routine.
Key crops, including corn, wheat and soybeans, would see declining yields as temperatures rise during the growing season. The city of Phoenix, which experienced about 80 days per year over 100 degrees around the turn of the century, could see between 120 and 150 such days per year by the end of the century, depending on the pace of emissions.
And those who face the most suffering? Society’s most vulnerable, including “lower-income and other marginalized communities,” researchers found.
In another major step, the authors of the new report have begun to put dollar signs next to projected climate damages, specifically within the United States.
In a worst-case climate-change scenario, the document finds, labor-related losses by the year 2090 due to extreme heat — the sort that makes it difficult to work outdoors or seriously lowers productivity — could amount to an estimated $155 billion annually. Deaths from temperature extremes could take an economic toll of $141 billion per year in the same year, while coastal property damages could total $118 billion yearly, researchers found.
Of course, mitigating climate change would also mitigate these damages, by as much as 58 percent in the case of high-temperature related deaths, the report finds.
The categorical tone of the new assessments reflects scientists’ growing confidence in the ability to detect the role of a changing climate in individual extreme events, such as heat waves and droughts. At the same time, increasingly sophisticated computer simulations now allow them to project future changes in highly specific regions of the country.
For many Americans, however, no simulations are necessary. The effects of climate change are already playing out daily.
“We don’t debate who caused it. You go outside, the streets are flooded. What are you going to do about it? It’s our reality nowadays,” said Susanne Torriente, who also reviewed the report. She is chief resilience officer for Miami Beach, which is spending hundreds of millions of dollars to adapt to rising sea levels. “We need to use this best available data so we can start making decisions to start investing in our future … It shouldn’t be that complicated or that partisan.”
The report is being released at the same time as another major federal climate study that, in contrast, actually reaches a rather more positive conclusion — at least with respect to what can be done about climate change.
The Second State of the Carbon Cycle Report, which examines all of North America (not just the United States), finds that over the last decade, greenhouse gas emissions from fossil fuels have actually declined by 1 percent per year. The result is that while North America emitted 24 percent of the world’s emissions in 2004, that was down to 17 percent in 2013. This has occurred in part thanks to improvements in vehicle fuel efficiency, the growth of renewable energy, and the swapping of coal burning for natural gas.
“For the globe, we’re still going up, but regionally, there have been these changes in how humans have been acting that have caused our emissions to go down,” said Ted Schuur, an expert on permafrost carbon at Northern Arizona University who contributed to the report, the follow-up to an initial effort released in 2007.
The report concludes that it appears possible to grow economies — at least for the United States, Mexico, and Canada — without increasing overall emissions of greenhouse gases. That would be a very important signal for the ability of the world to slow climate change over the course of the century. However, it doesn’t mean any lessening of climate change impacts within the United States. As long as global emissions continue, the risk of impacts here continue, because carbon dioxide circulates around the globe.
The release of the National Climate Assessment comes on the heels of other recent global warnings, most notably a report by the United Nations’ Intergovernmental Panel on Climate Change, finding that the world would have to make unprecedented changes in the next decade to remain below 2.7 degrees Fahrenheit (1.5 degrees Celsius) of total warming above preindustrial levels.
The last time a U.S. National Climate Assessment was published, in 2014, Obama administration officials took the document seriously, with top policymakers heralding its release and embracing its findings.
“These tailored findings help translate scientific insights into practical, usable knowledge that can help decision-makers and citizens anticipate and prepare for specific climate-change impacts,” White House science adviser John Holdren and NOAA administrator Kathryn Sullivan wrote at the time.
On the other side of the country, at least one well known atmospheric scientist this week was wrestling not with the contents of a climate report, but with the changing view from his own window.
“Normally, I can see San Francisco Bay from my home. Today and for the past few days, I could not see the bay for all the smoke from the Paradise fire. Fires that approach the size of the Paradise fire are most common in the hot dry years — the kind of years that we are likely to see many more of,” said Ken Caldeira, a senior researcher at the Carnegie Institution for Science.
“We are trained to be skeptical and resist jumping to quick conclusions, but looking at the smoke I could not help but think, ‘This is climate change. This is what climate change looks like.’”—
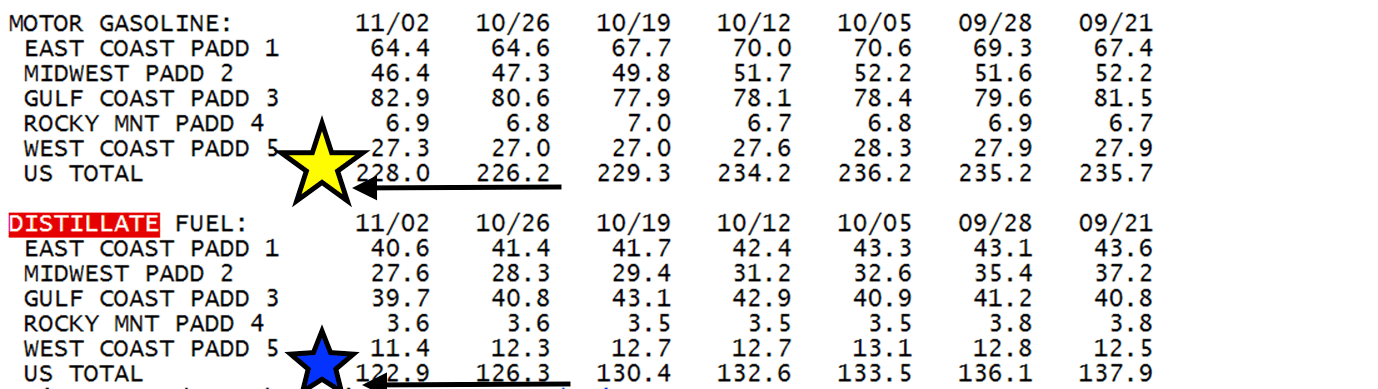
Gasoline stocks have been rising, while heating oil (distillate stocks) tanking. Distillate fuel is used in everything from home heating oil (the biggest concentration is of course in the Northeast), to diesel fuel for trucks, trains and planes. One can see below how gasoline prices have collapsed in the face of excess global supplies of crude oil, but distillate prices have risen ahead of winter.
Trade sanctions against Iran are expected to be made up for by increase production by OPEC members and here in the U.S. This is one key reason crude prices have broken 15% in recent weeks
Above we can see that distillate stocks are falling (blue star *), while gasoline stocks rising (yellow star *). Depending on winter weather, there will be some huge trading opportunities in various energy spreads based on how much cold and snow affect demand for heating oil and whether or not deep snow cover affects driving (gasoline demand) throughout the winter.
Heating oil prices have soared vs gasoline, as the chart shows above. Heating oil prices will be very sensitive to weather. Will this spread reverse and heating oil prices fall and gasoline rally later this winter? To find out more our long-range weather forecast for winter, click here for a sample newsletter
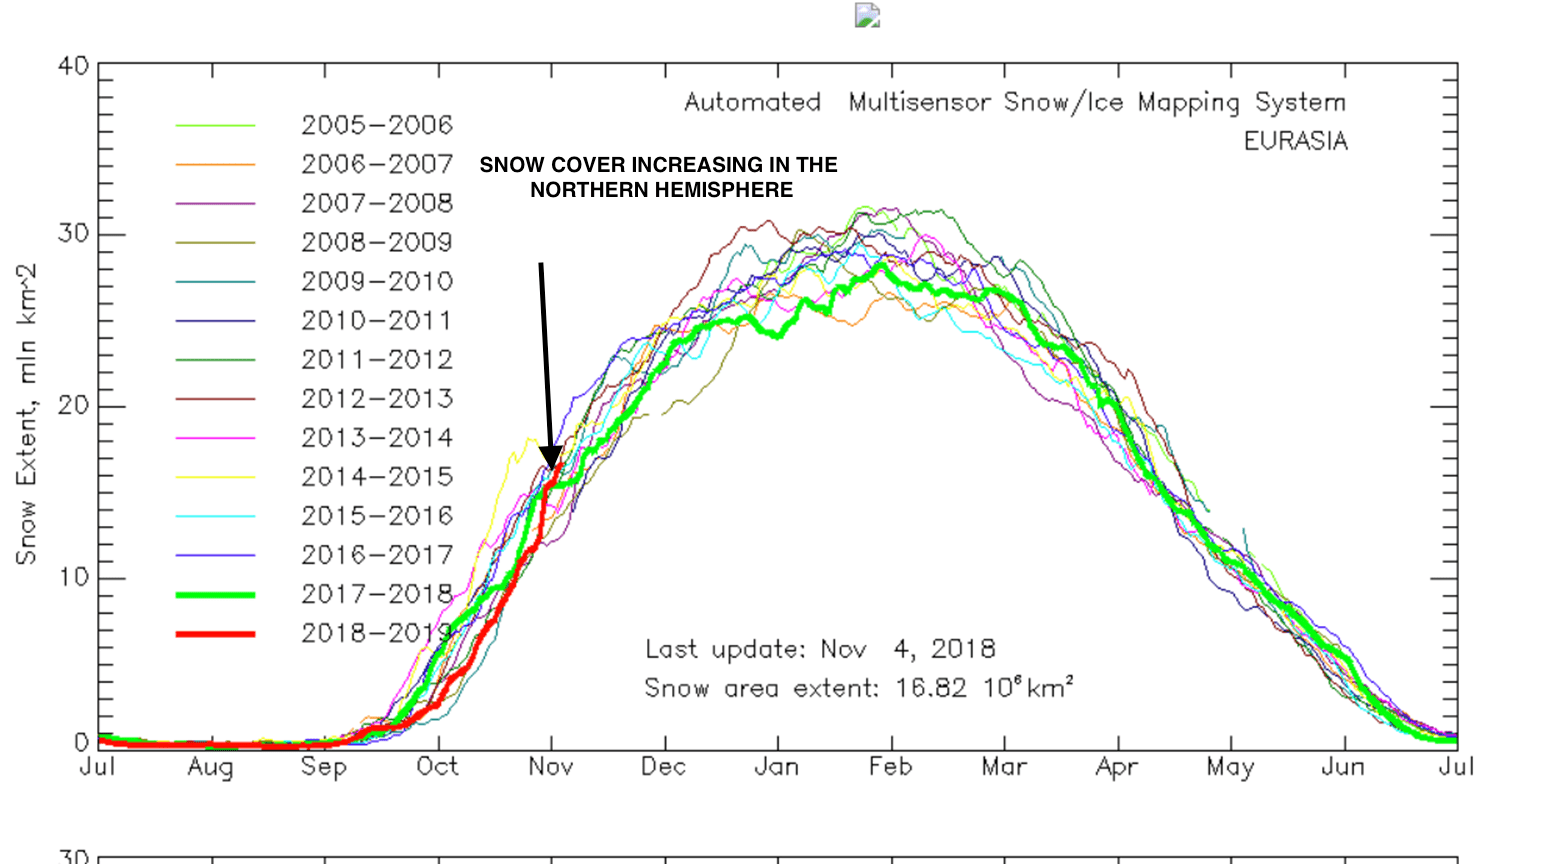
(above) Snow cover is rapidly increasing across Canada and the Arctic. How strong El Nino forms, plus specialized forecasting techniques that we use for clients, will dictate how severe this winter will be for energy areas. We have the answers here
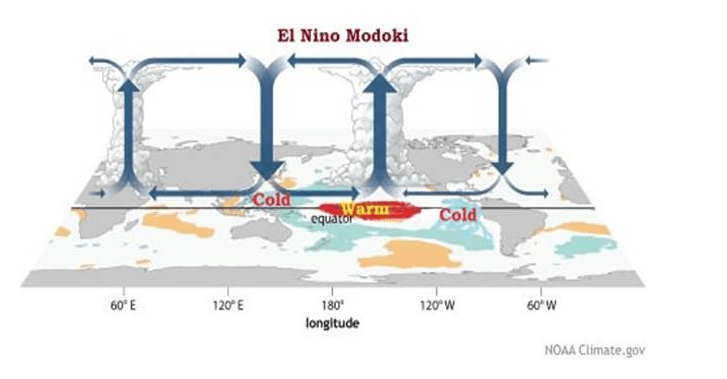
Cooler ocean temperatures in the eastern tropical Atlantic and warmer oceans further west could imply a potential El Niño Modoki (click here) in the months ahead. However, the differences in where this “potential” El Niño will develop could have huge implications for the upcoming hurricane season. It could also impact cocoa crops in west Africa, the Indian Monsoon, Brazil sugar and coffee production and, of course, the natural gas and grain markets.
Shown below are the differences between both types of El Niño phenomena. Presently, the cooler waters to the west of Peru could imply this “west based” El Niño.
So how does an investor trade commodities based on this? In which markets are we bullish (or bearish) over the next 6 to 9 months? A new subscription based newsletter called CLIMATELLIGENCE, will be available soon and will cover all agriculture and energy commodities.
Note the map to the right (above). This type of El Niño, if it forms, will have different effects on global commodities from coffee to cocoa. An El Niño Modaki is NOT necessarily bad for global cocoa production but could adversely impact Brazil coffee later this year.
EL NIÑO MODOKI — WEATHER IMPLICATIONS FOR SUMMER COMMODITIES
How quickly a possible El Niño forms later this summer, or in the autumn, will help dictate global weather. It can also influence many commodities from natural gas to grains. Most computer models are now suggesting an El Niño Modoki to occur in the Fall. Historically, El Niño tends to result in cool summers, that would be bearish for natural gas and grain prices. There were exceptions. The maps below illustrate the difference between summers when an El Niño was already forming by the spring and those (bottom chart) that developed later on and also followed a La Niña event. Such did occur last winter and early spring. In other words, the possible analog years of 1963, 1968, 1976, 2002 and 2006 had some similarity to conditions earlier this year. What will the summer be like, then? AHHHH, this is the kind of information (the answer) that will be part of a new subscriptions based. COMMODITY WEATHER REPORT, we will begin publishing, soon. Stay tuned. —Jim Roemer
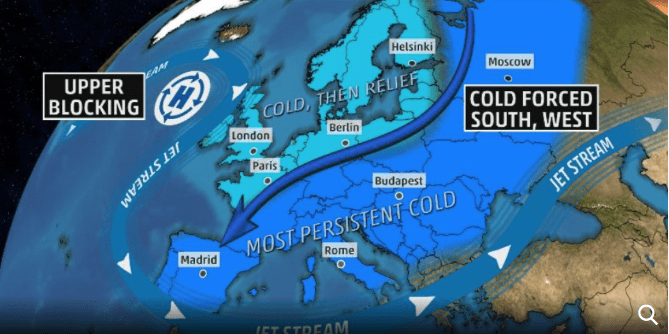
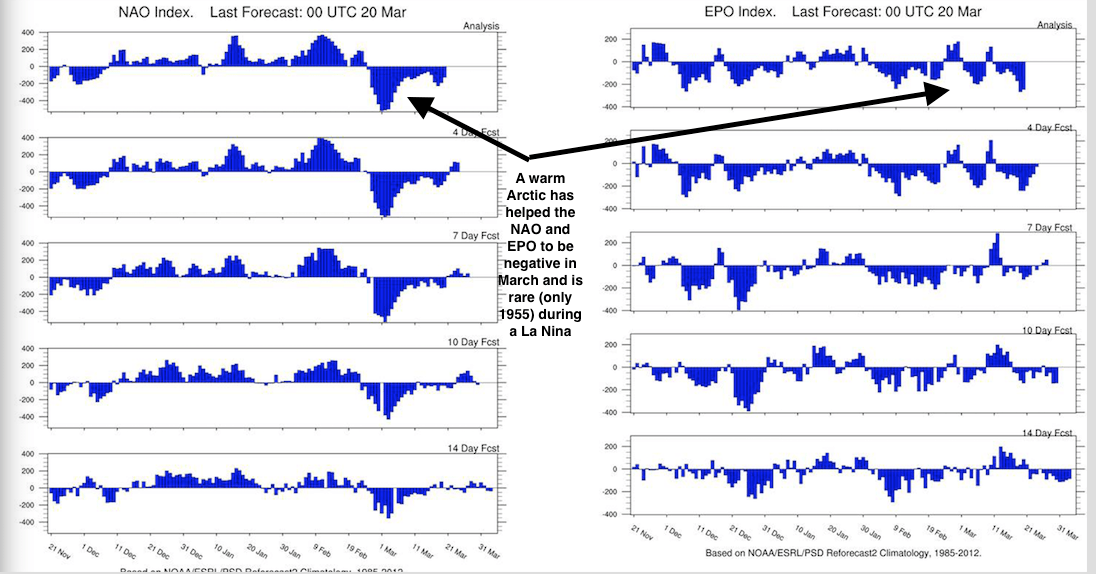
The warming Arctic this winter has resulted in incredibly cold weather in parts of Europe and Northeast Asia. Another symptom has been unusual March snowstorms in the Northeast U.S., the likes of which are unprecedented. Although four Nor’easters have clobbered the Eastern U.S., I do not agree with the forecasters who attribute this to La Niña.
Once again, the “warming planet” signals are the handwriting on the wall. They read “the Arctic is warming” and “the Atlantic ocean temperatures are rising.” As far as the energy markets are concerned, the UK natural gas futures contract reacted extremely to the cold weather. The U.S. has not had nearly the consistent cold winter as observed in Europe. The negative NAO. Index (warm block near Greenland) and warming near Alaska (negative EPO) have resulted in this “Beast from the East”. For more information about this incredible European cold and some changing feelings about global warming, Please click the following link: Here
a rare coincidence of the NAO and EPO indices
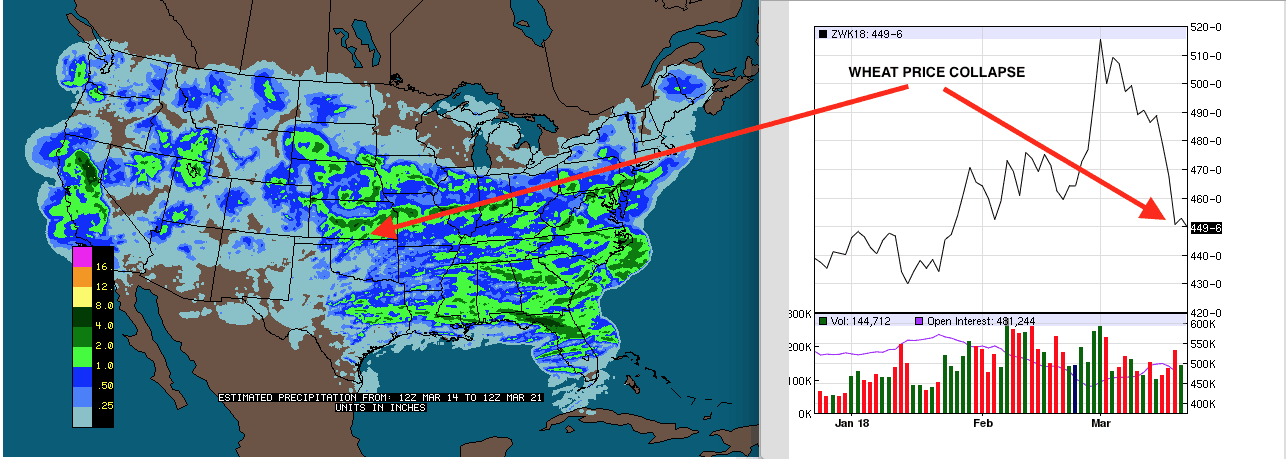
WHEAT PRICE COLLAPSE DUE TO SUDDEN SHIFT IN U.S. PLAINS DROUGHT
Wheat prices have had a steady climb during January and February, as the chart reveals below (right). However, it usually takes some other weather disaster somewhere in the world to have a longer term bull market in wheat prices. Two fundamental factors are brewing in the world of wheat:
a) The U.S. has not been competitive in the world market, and
b) Russia is sitting on huge global stocks.
These realities began to increase wheat market volatility long before we changed our forecast views presented to private clients on March 15th. We issued a heightened alarm for a potential easing of the Plains drought.
Due to weather factors not related to La Niña, there has been a precipitous drop in wheat prices.
CLIMATECH (below) shows how the present La Niña is similar to 1955. Back then, “normal” dryness continued in the Plains wheat areas (red). Based on these teleconnections below, this should have happened. However, computer models, along with our forecast, began changing on March 15th. This prompted us to alert private clients about a potential change in wheat price direction. If you would like more information, please email us at
As wheat prices have taken it on the chin, one of the lone bull markets in agricultural commodities recently has been in cocoa. Dry, hot weather did cause some minor reduction in the west Africa cocoa crop this winter. This is quite is unusual for La Niña. However, the main reason for the bull move is far too many short futures positions. This high level of commercial hedges are bumping up against rising global demand. In addition, there is press coverage pointing out that cocoa farmers in Ghana will see lower production in coming years due to the “illegal gold mining boom.”
Here is an excerpt from the current issue of National Geographic:
“Gold mining has always been a part of Ghana, from the ornate jewelry of the Ashanti kings to British colonization. In the last several years, largely unregulated galamsey (informal, illegal) mining has ramped up, due in part to Chinese investors who bring in sophisticated equipment and a lagging economy that makes the prospect of striking gold too sweet to pass. These often illegal operations can result in contaminated water, deforestation, and a rise in violent crime.”
“In 2011, Ghana produced a record-setting amount of cocoa, weighing in at over one million tonnes. Since then, as illegal mining steadily ramped up, cocoa production has trended downwards, with a drop to 740,000 tonnes in 2015.”
For the full, interesting article about this from National Geographic, please click here
HELPING YOU MAKE THE BEST INVESTMENT DECISIONS BASED ON THE WEATHER
We use cookies to ensure that we give you the best experience on our website. If you continue to use this site we will assume that you are happy with it.OkPrivacy policy


 (above)