by Jim Roemer | Jul 25, 2018 | Climatech, Climatelligence, Commodities
Our new weekly weather-commodity “subscription based report” (Climatelligence) is here, due to popular demand and requests from around the world for our insight. Subscriptions are $1,200 for 42 issues. We will be focusing in on a different commodity each week. For more information about subscribing, please click here and register

Below you will see a sample of what you will receive each week. This particular report was written in June and caught the bear move down in several commodities such as corn and soybeans. Wheat currently has a bullish signal that has been updated in our most recent issues in the last couple of weeks.
Climatelligence Rankings Spider (excerpt from the 6/20/18 issue)
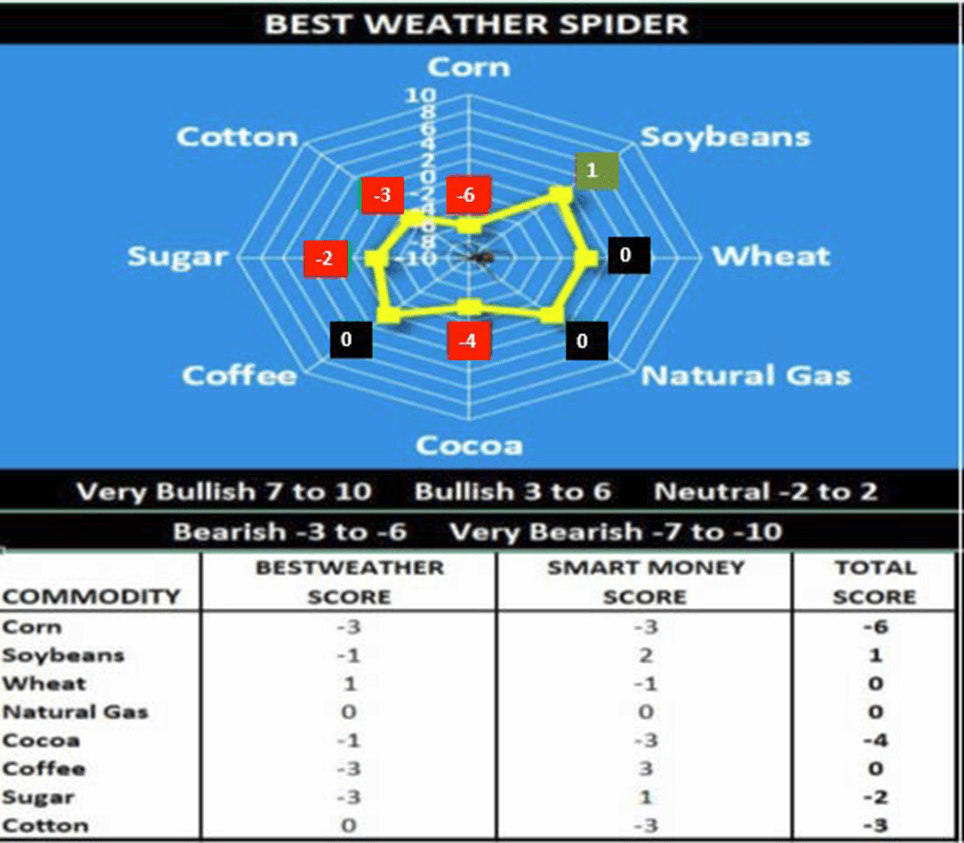
The Climatelligence rankings tables were created by Jim Roemer and Shawn Hackett to help commodity traders, farmers and agribusinesses quantify the influence that U.S./global weather and capital flows have on the prices of agricultural products. The Climatelligence rankings (below) weight weather (Climatech/BestWeather) and capital flows (Informed Smart Money Algorithm) equally to formulate bullish and bearish readings.
Commodities Overview
(as published on 6/20/18)
Soybeans: (+1) Like many Ag commodities, soybeans got caught up in the on-going trade war with China. Close to 70% of all U.S. soybean exports go to China. Ideal Midwest weather keeps us bearish, but farmers should hold off making additional sales due to at least one potential weather scare and the possibility of an over-reaction on the trade war news.
Corn: (-6) In contrast to many other analysts, we became bearish corn a few weeks ago around $4.10 due to the heavy long position and ideal early season growing conditions. We advised farmers sell 50% of their 2018 crop either with put options or by shorting forward contracts.
Wheat: (0) Seasonal harvest pressure may offset some of the weather issues for crops in Russia and Australia for now.
Cocoa: (-4) A volatile market since the winter, the potential for El Niño later this year and stronger grind data out of Europe and Asia keeps us slightly bullish at these price levels.
Cotton: (-3) Trade war concerns are keeping us from being overall bullish, as well as seasonally lower prices during post La Niña years, as winter nears. However, tight global stocks and the on-going drought in Texas keeps us slightly bullish.
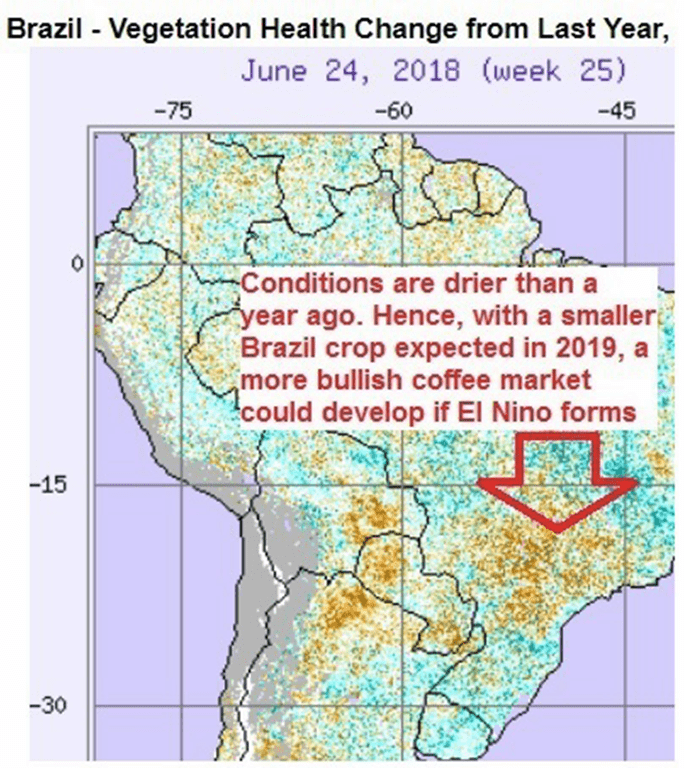
Coffee: (0) No freeze for Brazil and big global stocks has kept us slightly bearish. However, dryness developing in Brazil, plus a heavy short position in the market and SMART MONEY’s more neutral bias, have somewhat lessened our bearish stance. A potential bull market could ensue later for Brazil, due to El Niño.
Sugar: (-2) Prices got caught up in the crashing Brazilian Real. Huge global supplies and benign weather this past year helped us become bearish around 20 cents about a year ago. However, the heavy short position in the market and potential Pre-El Niño dry concerns in Brazil, could affect the third quarter sugar cane crop.
Focus on Coffee (as per the 6/20/18 issue)
Coffee has always been one of the most sensitive Ag markets to movements in the Brazilian Real. While a heavy speculative short position exists in the market and Smart Money suggests a possible buy, the weather in both Colombia and Brazil continue to be mostly beneficial with no freeze scares for now. The Bestweather weather spider score is slightly bearish (-3), while the Smart Money score is +3, netting to a zero score. Nevertheless, growing dryness in northern Brazil could cause concern for the 2019 crop turning us more bullish, soon.
Brazil’s Vegetative Health – According to BestWeather:
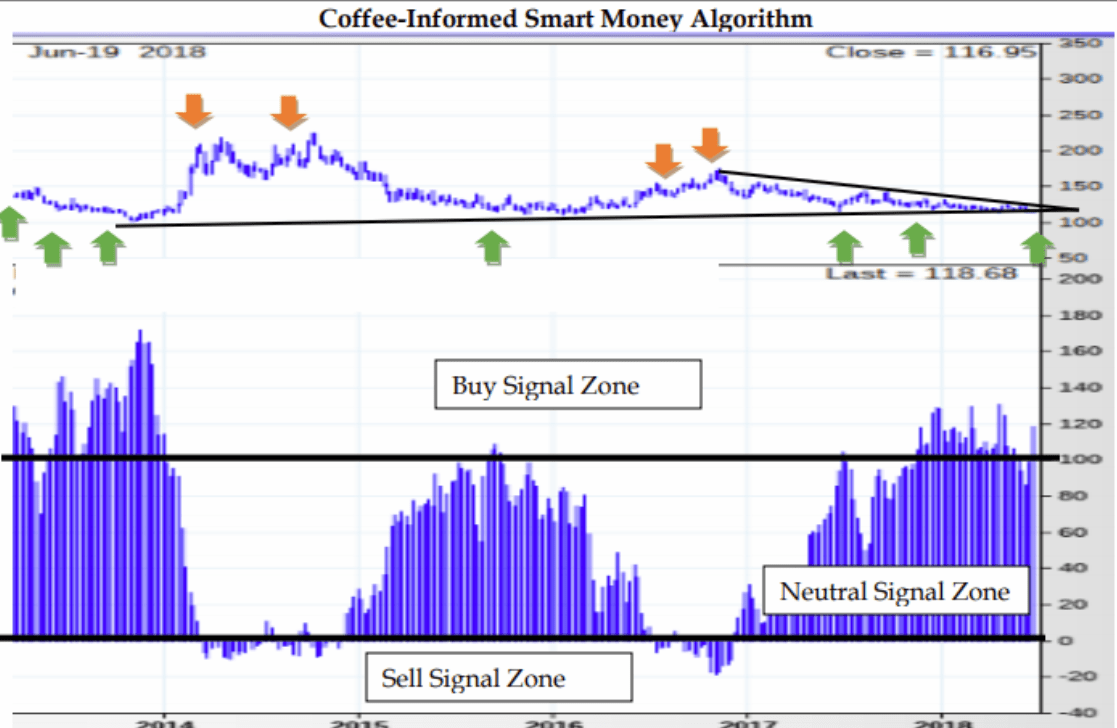
The blue lines above show the Smart Money Chart, developed by Shawn Hackett. It has to do with a complex Algorithm related to the commitment of traders reports (“COT”), seasonality and technical factors. One can see that coffee is slowly edging into the buy zone. It will take fundamental weather related weather issues to cause a strong buy signal, but this could well happen, by the fall. The Brazilian Real may be be bottoming out, as well.
Smart Money Summation (6/20/18):
A new informed smart money indicator algorithm buy signal has been triggered in the coffee market. We have seen a series of buy signals over the last year whenever prices have fallen under $1.20/pound. Given the historical upside volatile nature of coffee price rallies, patience is usually a virtue. This supports optimism on an intermediate term basis and meshes well with our longer term bullish weather outlook. End users, longer term hedgers and positional traders should be considering protecting upside price risks at this time.
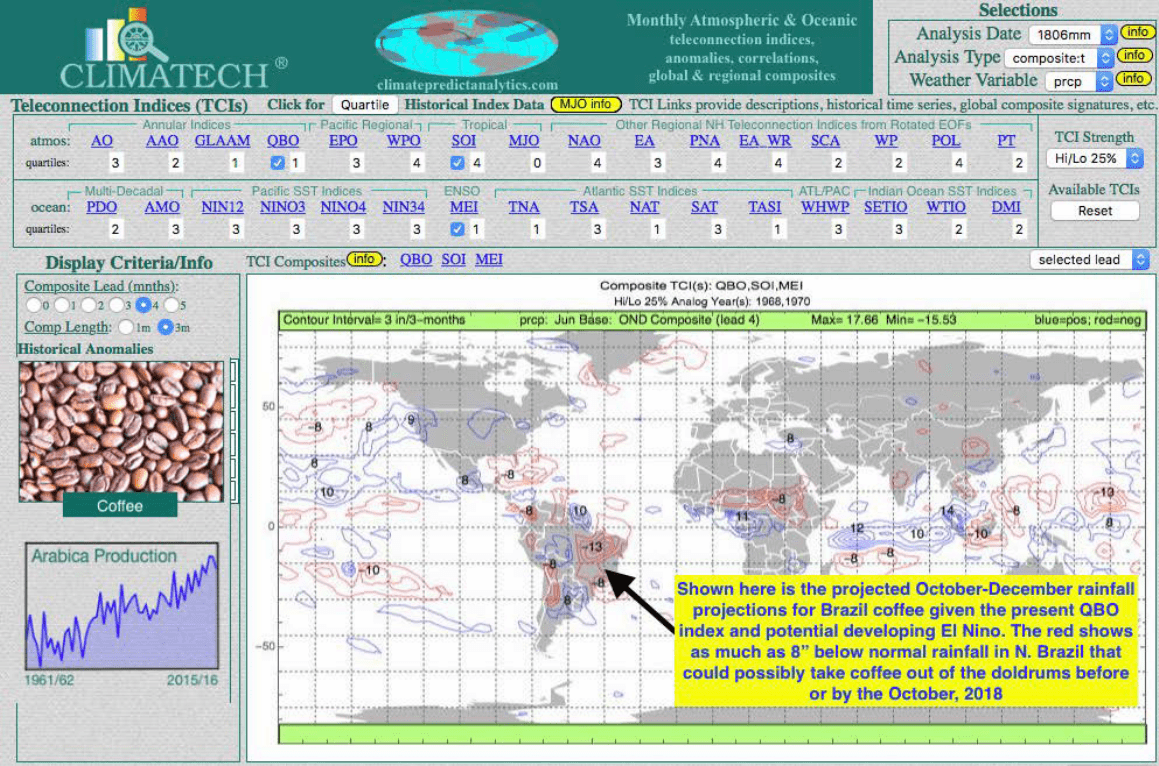
Climatech (6/20/18):
Our proprietary long, range weather forecast software illustrates below the potential for some fall dryness to the Brazil coffee crop later this year. The three checked boxes represent one solution our program comes up with. Climatech found some of the most important “similar” teleconnections (https://en.wikipedia.org/wiki/Teleconnection) critical to Brazil’s coffee weather. Currently, the very negative QBO index (stratospheric winds blowing east to west (https://en.wikipedia.org/wiki/Quasibiennial_oscillation) and a similar weakening La Niña that may turn into an El Niño Modoki later this summer or fall.
Coffee Conclusion on June 20, 2018
The Climatelligence rankings table above shows a neutral bias in coffee. The score combines both present weather fundamentals, which have been bearish (-3) and the Shawn Hackett Smart Money algorithm that is a (+3) and turning bullish.
The Smart Money algorithm is based on the heavy short position in the market and seasonal factors that portend possibly higher prices in the months ahead. In addition, the Brazil Real seems to be bottoming that could help coffee later this summer or fall. Our bias is for traders to begin looking at the long side of coffee, in a longer term call option position expecting some sort of rally later this fall.
FOR MORE INFORMATION ABOUT OUR SERVICE, CLICK HERE
The statements below also apply to The Climatelligence Report, BestWeather, Inc. and Jim Roemer The information, tools and material presented on HACKETTADVISORS.COM (this web site), in the HACKETT MONEY FLOW REPORT and in the HACKETT STOCK REPORT are provided for informational purposes only and are not to be used or considered as an offer or a solicitation to sell or an offer or solicitation to buy or subscribe for securities, investment products or other financial instruments, nor to constitute any advice or recommendation with respect to such securities, investment products or other financial instruments. The information presented on HACKETTADVISORS.COM (this web site), in the HACKETT MONEY FLOW REPORT and in the HACKETT STOCK REPORT is prepared for general circulation. It does not have regard to the specific investment objectives, financial situation and the particular needs of any specific person who may receive this information. You should independently evaluate particular investments and consult an independent financial adviser before making any investments or entering into any transaction in relation to any securities mentioned on HACKETTADVISORS.COM (this web site), in the HACKETT MONEY FLOW REPORT and in the HACKETT STOCK REPORT. The use of HACKETADVISORS.COM is at your own sole risk. HACKETTADVISORS.COM is provided on an “as is” and “as available” basis. Hackett Financial Advisors, Inc. makes no warranty that HACKETTADVISORS.COM will be uninterrupted, timely, secure or error free. No charts, graphs, formulae, theories or methods of securities analysis can guarantee profitable results. This document does not purport to be a complete description of the securities or commodities, market or developments to which reference is made. The information contained in HACKETTADVISORS.COM (this website), in the HACKETT MONEYFLOW REPORT and in the HACKETT STOCK REPORT has been taken from trade and statistical services and other sources, which we believe are reliable. Hackett Financial Advisors, Inc. does not guarantee that such information is accurate or complete and it should not be relied upon as such. The HACKETT MONEY FLOW REPORT and the HACKETT STOCK REPORT are written as weekly tools to help investors make better financial decisions. Any opinions expressed reflect judgments at this date and are subject to change without notice. The principals of Hackett Financial Advisors, Inc. and others associated or affiliated with it may recommend or have positions which may not be consistent with the recommendations made. Each of these persons exercises judgment in trading and readers are urged to exercise their own judgment in trading. Past Performance is not indicative of future results. . FUTURES AND COMMODITIES TRADING AND STOCK INVESTING AND TRADING INVOLVES SIGNIFICANT RISK AND IS NOT SUITABLE FOR EVERY INVESTOR. INFORMATION CONTAINED HEREIN IS STRICTLY THE OPINION OF ITS AUTHOR AND IS INTENDED FOR INFORMATIONAL PURPOSES AND IS NOT TO BE CONSTRUED AS AN OFFER TO SELL OR A SOLICITATION TO BUY OR TRADE IN ANY COMMODITY OR SECURITY MENTIONED HEREIN. INFORMATION IS OBTAINED FROM SOURCES BELIEVED RELIABLE, BUT IS IN NO WAY GUARANTEED. OPINIONS, MARKET DATA AND RECOMMENDATIONS ARE SUBJECT TO CHANGE AT ANY TIME. PAST RESULTS ARE NOT INDICATIVE OF FUTURE RESULTS.
This material has been prepared by a sales or trading employee or agent of Hackett Financial Advisors Inc. and is, or is, a solicitation. This material is not a research report prepared by R.J. O’Brien’s Research Department. By accepting this communication, you agree that you are an experienced user of the futures markets, capable of making independent trading decisions, and agree that you are not, and will not, rely solely on this communication in making trading decisions. DISTRIBUTION IN SOME JURISDICTIONS MAY BE PROHIBITED OR RESTRICTED BY LAW. PERSONS IN POSSESSION OF THIS COMMUNICATION INDIRECTLY SHOULD INFORM THEMSELVES ABOUT AND OBSERVE ANY SUCH PROHIBITION OR RESTRICTIONS. TO THE EXTENT THAT YOU HAVE RECEIVED THIS COMMUNICATION INDIRECTLY AND SOLICITATIONS ARE PROHIBITED IN YOUR JURISDICTION WITHOUT REGISTRATION, THE MARKET COMMENTARY IN THIS COMMUNICATION SHOULD NOT BE CONSIDERED A SOLICITATION. The risk of loss in trading futures and/or options is substantial and each investor and/or trader must consider whether this is a suitable investment. Past performance, whether actual or indicated by simulated historical tests of strategies, is not indicative of future results. Trading advice is based on information taken from trades and statistical services and other sources that Hackett Financial Advisors Inc. believes are reliable. We do not guarantee that such information is accurate or complete and it should not be relied upon as such. Trading advice reflects our good faith judgment at a specific time and is subject to change without notice. There is no guarantee that the advice we give will result in profitable trades.
by Jim Roemer | Jun 27, 2018 | Climatelligence, Commodities, Energy
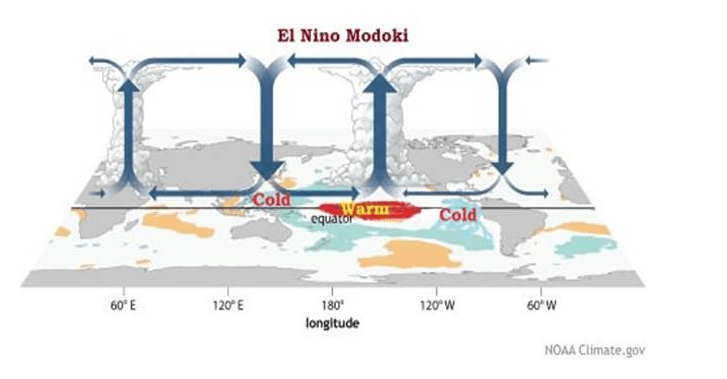
Cooler ocean temperatures in the eastern tropical Atlantic and warmer oceans further west could imply a potential El Niño Modoki (click here) in the months ahead. However, the differences in where this “potential” El Niño will develop could have huge implications for the upcoming hurricane season. It could also impact cocoa crops in west Africa, the Indian Monsoon, Brazil sugar and coffee production and, of course, the natural gas and grain markets.
Shown below are the differences between both types of El Niño phenomena. Presently, the cooler waters to the west of Peru could imply this “west based” El Niño.
So how does an investor trade commodities based on this? In which markets are we bullish (or bearish) over the next 6 to 9 months? A new subscription based newsletter called CLIMATELLIGENCE, will be available soon and will cover all agriculture and energy commodities.
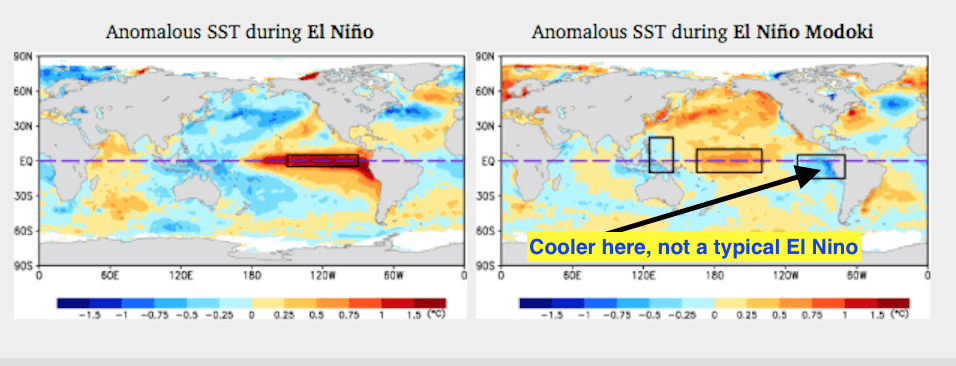
Note the map to the right (above). This type of El Niño, if it forms, will have different effects on global commodities from coffee to cocoa. An El Niño Modaki is NOT necessarily bad for global cocoa production but could adversely impact Brazil coffee later this year.
*****************************************************************************************************************************************************************************************************************************************************************************************************************************************************
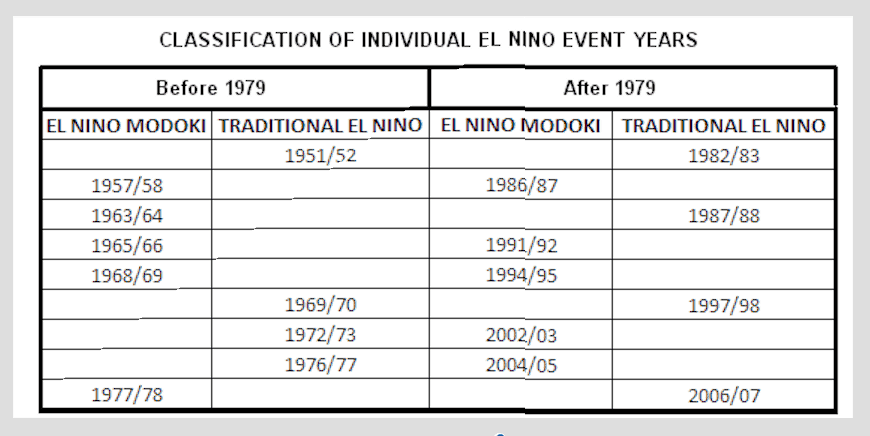
EL NIÑO MODOKI — WEATHER IMPLICATIONS FOR SUMMER COMMODITIES
How quickly a possible El Niño forms later this summer, or in the autumn, will help dictate global weather. It can also influence many commodities from natural gas to grains. Most computer models are now suggesting an El Niño Modoki to occur in the Fall. Historically, El Niño tends to result in cool summers, that would be bearish for natural gas and grain prices. There were exceptions. The maps below illustrate the difference between summers when an El Niño was already forming by the spring and those (bottom chart) that developed later on and also followed a La Niña event. Such did occur last winter and early spring. In other words, the possible analog years of 1963, 1968, 1976, 2002 and 2006 had some similarity to conditions earlier this year. What will the summer be like, then? AHHHH, this is the kind of information (the answer) that will be part of a new subscriptions based. COMMODITY WEATHER REPORT, we will begin publishing, soon. Stay tuned. —Jim Roemer

by Jim Roemer | Jun 11, 2018 | Climatelligence, Commodities, Weather
How we use teleconnections to second guess computer models and other weather forecast firms in hurricane forecasting
*********************************************************************************************************************************************************************************************************************************************************************************************************************************
ABSTRACT: My first early look at the hurricane season addresses global teleconnections and potential tracks and intensity levels from our proprietary program – CLIMATECH® It also includes analog years that were derived from phenomena that I dubbed “Weather Wierdos”. It predicts that the Gulf and east coast could be spared major hurricane activity this summer due to the cool Atlantic and weakening La Niña. The total number of storms are still up in the air. This is due to questions about whether El Niño will form and if global warming will alter the presently cool Atlantic enough to foster more storms. On average, we expect a weaker than normal hurricane season this year.
— Jim Roemer
Factors going into hurricane forecast season
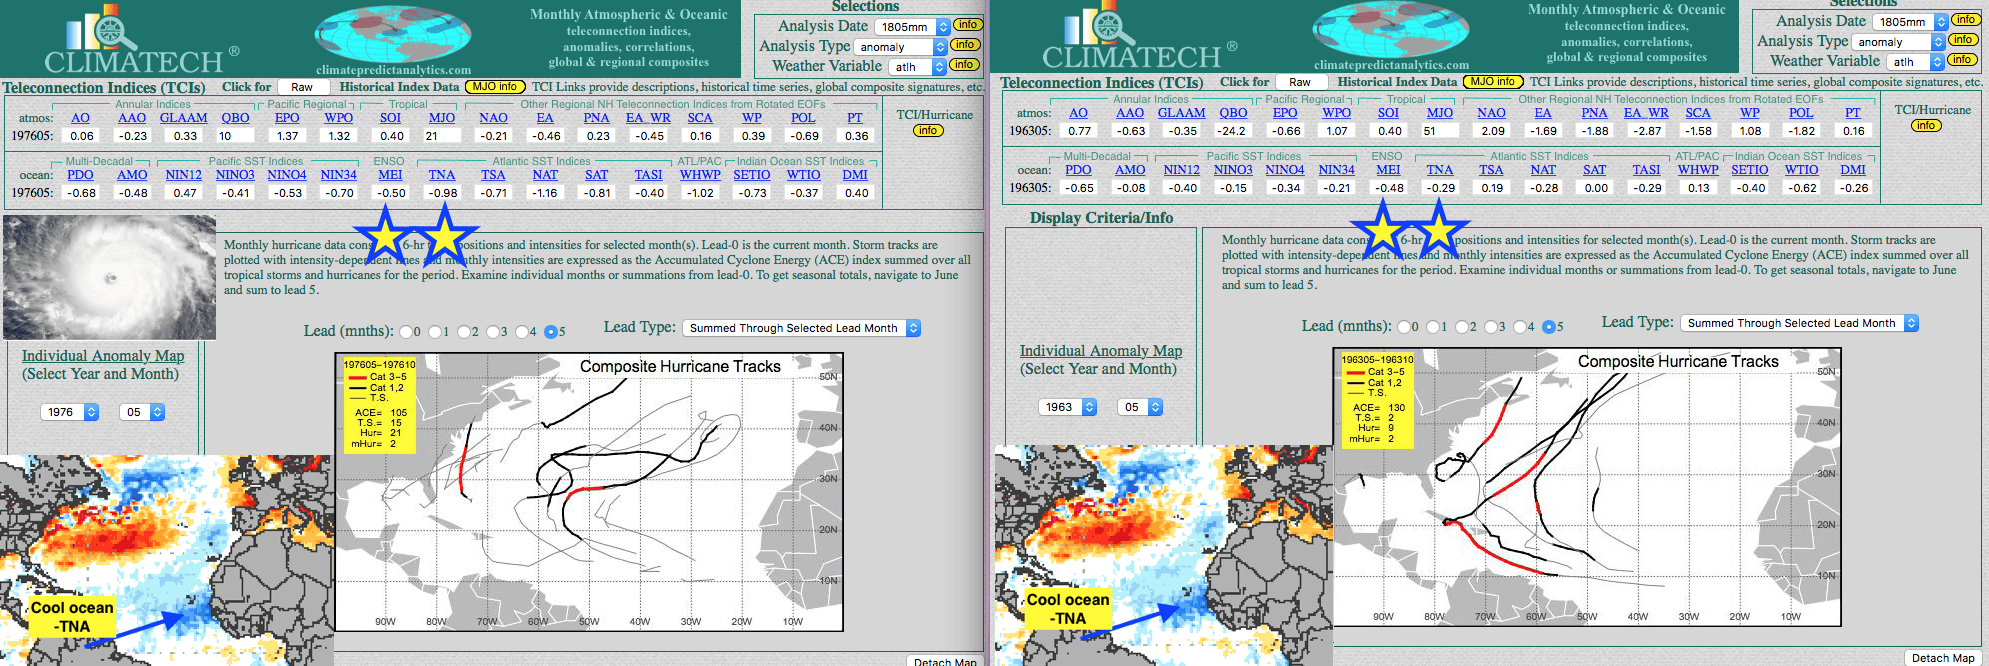
Here at BestWeather, Inc., in conjunction with Douglas Stewart, PhD, we developed CLIMATECH®. This tool is a sophisticated long-range weather forecast platform. We recently added a new feature that incorporates ocean temperatures and climatic weather patterns thousands of miles away (teleconnections). This helps to predict tracks and intensities of tropical storms and hurricanes. Based on a weakening La Niña and cool ocean temperatures off the coast of west Africa (negative TSA), the most likely scenarios for the season would be the two analog maps below. These depict 1976 and 1963. The reader should note the majority of hurricane tracks in these years were generally way offshore. The map on the left (1976) portrays extremely weak tropical activity in the Gulf that year. However, Shawn Hackett of Hackett Financial Services, pointed out to me about a developing cool ocean temperature ring in the middle of the Atlantic. This is eerily similar to 1994 when a very inactive hurricane season prevailed in the Atlantic and Gulf.
What is the main difference between 2018 and 1994? So far this year, we are measuring record warm worldwide temperatures again. Back in 1994, however, the planet was cooler than normal. In fact, two of the worst coffee freezes on record hit northern Brazil in late June and July of 1994. This is something we do not anticipate this year because of a much warmer Antarctica. Nevertheless, both our CLIMATECH® program and Shawn’s research have influenced us to lean towards the forecasting the upcoming Atlantic hurricane season to be “weaker” than normal. There is one caveat, a question still needing an answer: “Will the warmer planet help to offset the cooling Atlantic oceans (seen below) and, hence, increase tropical convection and a much stronger hurricane season than we anticipate?”
Click here for more information about Shawn’s services
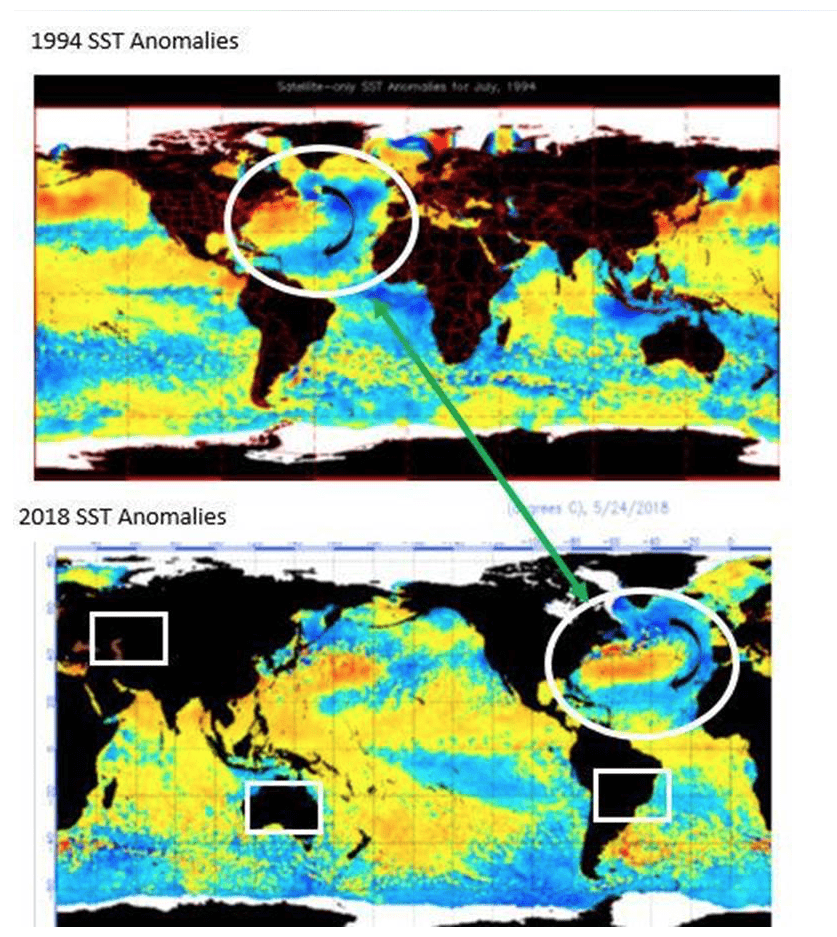
The cool ocean ring in the Atlantic could weaken this year’s hurricane season unless our warming planet heats the Atlantic Ocean quickly enough. One concern is the possibility that El Niño does not form, as some models suggest, partly due to very low solar activity.
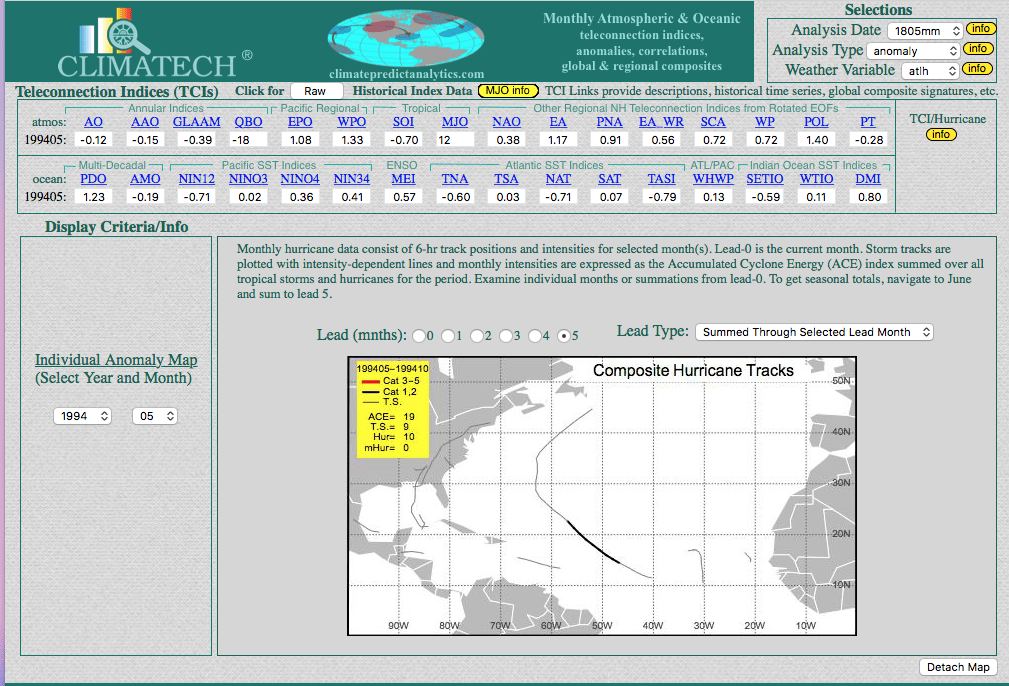
Two of our most compelling analog years for this hurricane season, are 1976 and 1963 (shown below). However, when factoring in the cool blue Atlantic Ocean ring, this seems to suggest a hurricane season closer to 1994 (shown just above), which was a very inactive season. Notice that Atlantic Cyclone Energy (ACE) for the entire 1994 hurricane season was only 19 with very few Atlantic and Gulf storms. That year seems a bit unlikely and too weak of a season, in part because of our concerns about a warming planet.
Global ocean temperatures, along with Weather Weirdos during certain extreme weather events, may display a similar foot-print (analog year) from years ago. It is my strong belief that human activities contribute to warming oceans: my inner jury is not out. This phenomenon certainly plays a significant role in altering both the intensity and the track of any given hurricane.
Bottom line? — The odds seem to favor a “weaker” hurricane season this year because of two factors. The first is a La Niña that is falling apart. The second is the cool Atlantic that may kill late season storms coming off the coast of West Africa. Our most confident early forecast is actually focused on the hurricane tracks, rather than the number of named storms. You can see below that much of the east coast and Gulf coast were spared major hurricanes during our CLIMATECH® analog years.
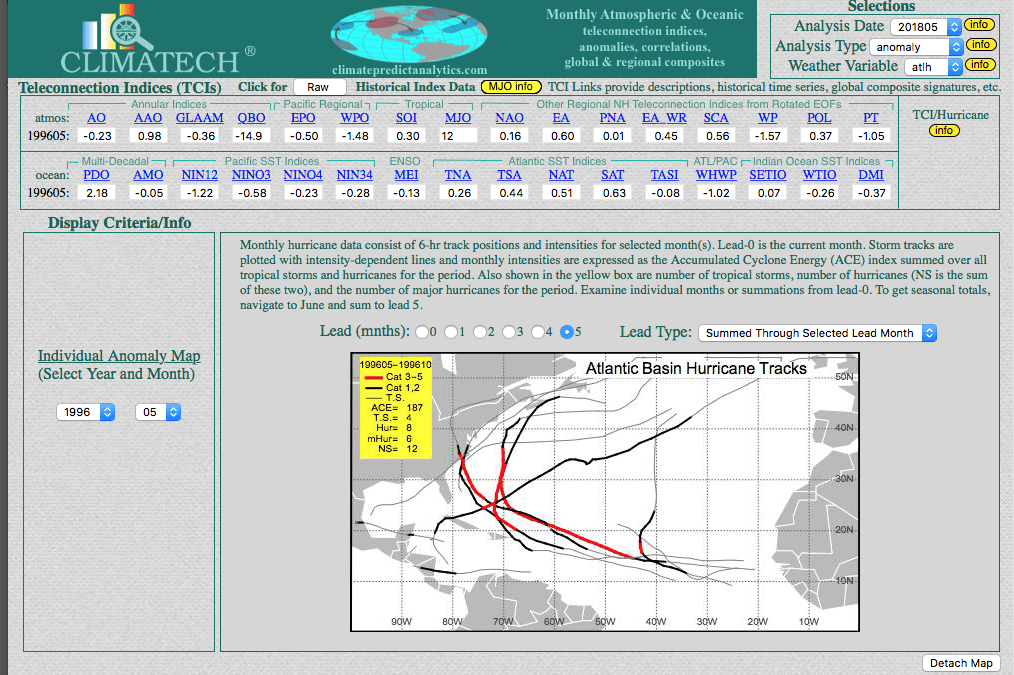
If you scroll to the top of the screen, you’ll see a 1996 map which is the “featured image” of today’s blog. Notice the statistical difference in the number of named storms for 1996 and for 1963:
1996 – 4 tropical storms and 8 hurricanes (6 which were major hurricanes)
1963 – 2 tropical storms and 9 hurricanes (2 were major hurricanes)
There were even fewer in 1994. Nevertheless, if the Atlantic stays cool and the ring remains, the odds of an active season, as per 1976, are unlikely.
1976 (left) had some teleconnections similar to today’s. There were 36 named storms, 2 of which were major hurricanes. However, we like 1963 (right) analog better due to other similar global weather patterns. 1963 had far weaker activity.
OTHER FACTORS WE CONSIDER IN HURRICANE FORECASTING
The analog years of 1994, 1963 and 1976 (shown above), not only had similar global teleconnections, but the aforementioned Weather Weirdos. Droughts, either in Argentina, the U.S. Plains and/or Australia were just some of the “weird weather” events, which occurred the last few months. If you have interest in subscribing to a newsletter that will be launched this coming fall, please contact us at:
HURRICANE OUTLOOK BY OTHER ORGANIZATIONS:
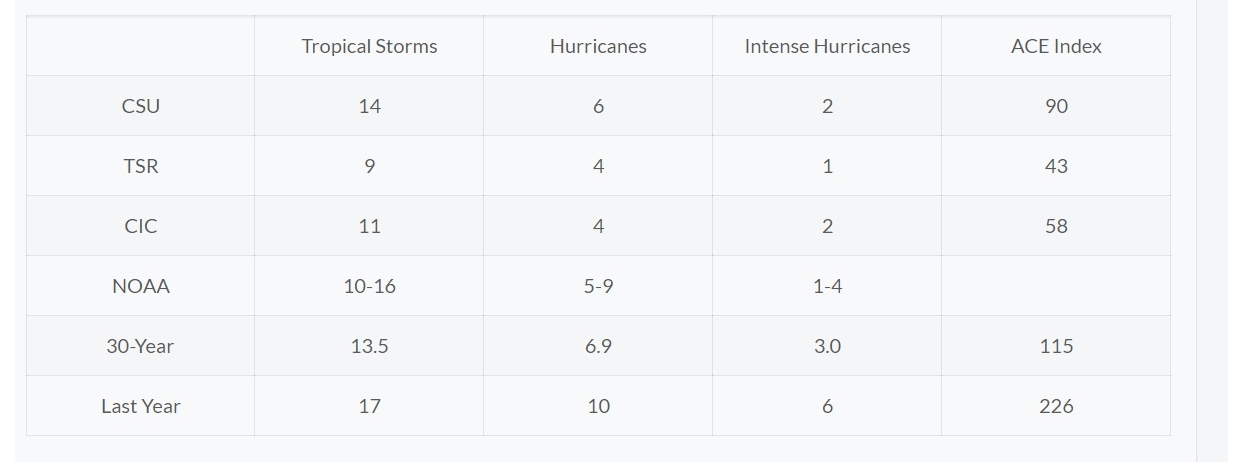
There is no shortage of entities that issue hurricane season forecasts. Government agencies, educational institutions, corporate giants and private enterprises are all players on the field. The long-term annual average for the past 68 years works out to be 11 named storms, 6 hurricanes and 3 major hurricanes with an ACE of 103. What is ACE? (It stands for Accumulated Cyclone Energy). Click here Penn State University is predicting the fewest number of named storms, while North Carolina State University appears to be predicting the most. A handful of the forecasts are summarized below. What goes into long-term hurricane forecasting? A lot has to do with whether El Niño or La Niña form and how warm or cool ocean temperatures are off the coast of Africa and in the MDR region. Here is a simple “rule of thumb”:
The less shear there is in the Atlantic and Gulf, and the warmer the ocean temperatures are, then there is a better chance for an active hurricane season.

National Oceanic and Atmospheric Administration
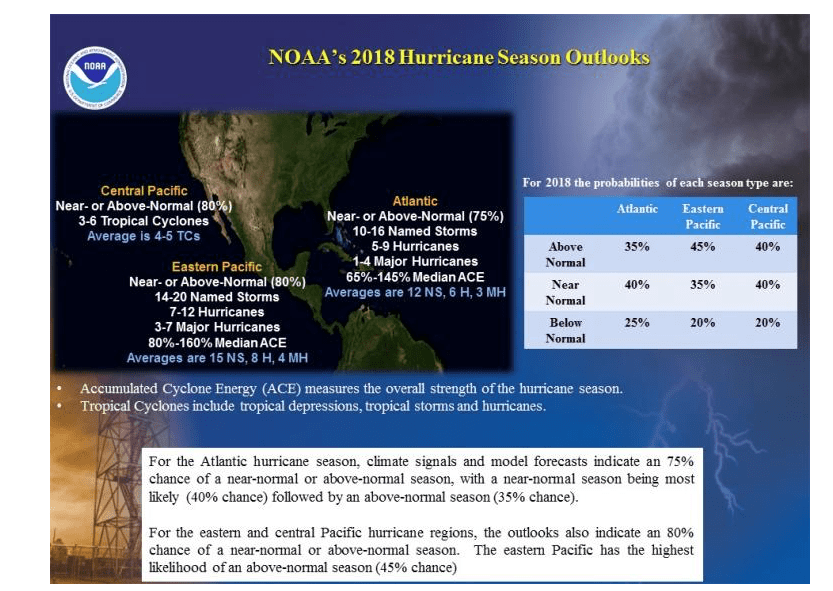
“Residents of Hurricane Alley can anticipate a near-normal or above-normal Atlantic hurricane season in 2018,” said NOAA’s Climate Prediction Center on May 24th. In their first seasonal forecast for 2018, NOAA predicted a 40% chance for a near-normal Atlantic hurricane season, a 35% chance for an above-normal season and a 25% chance for a below-normal season. NOAA gave a 70% likelihood of 10 to 16 named storms, 5 to 9 hurricanes and 1 to 4 major hurricanes (Category 3 or higher on the Saffir-Simpson Hurricane Wind Scale).
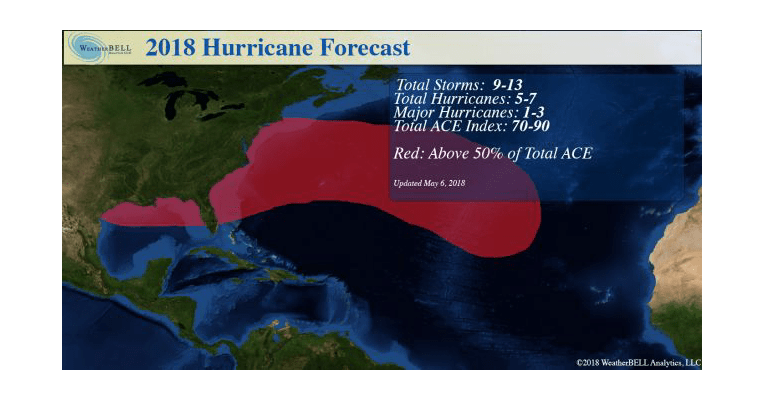
WeatherBELL
Colorado State University
“A slightly above-average Atlantic hurricane season is likely in 2018,” said the hurricane forecasting team from Colorado State University (CSU) in their latest seasonal forecast issued April 5. Led by Dr. Phil Klotzbach, with coauthor Dr. Michael Bell, the CSU team is calling for 14 named storms, 7 hurricanes, 3 intense hurricanes, and an ACE of 130. The CSU outlook also calls for a 63% chance of a major hurricane hitting the U.S. in 2018 (long term average is 52%), with a 39% chance for the East Coast and Florida Peninsula (long term average is 31%), and a 38% chance for the Gulf Coast (long term average is 30%). The Caribbean is forecast to have a 52% chance of seeing at least one major hurricane (long term average is 42%).
IBM – “The Weather Company”
The May 18 forecast from The Weather Company called for a near-average Atlantic hurricane season with 12 named storms, 5 hurricanes, and 2 major hurricanes. Their forecast noted these key influencing factors:
– Atlantic Ocean Temperature Pattern
– Transition Toward El Niño
– Increasing North Atlantic Oscillation
– The Multi-Decade Long Upward Swing in the Tropics Might Be Over
Penn State University
PSU is calling for a below active hurricane season with 10.2 named storms. This forecast comes from a statistical model by Michael E. Mann, Sonya Miller and Michael Kozar. Their prediction was made using statistics of how past hurricane seasons have behaved in response to sea surface temperatures (SSTs), the El Niño/La Niña oscillation, the North Atlantic Oscillation (NAO), and other factors. The model assumed that in 2018 the late-April +0.3°C departure of temperature from average in the Main Development Region (MDR) for hurricanes in the tropical Atlantic would persist throughout hurricane season, a weak El Niño would develop in the fall, and the NAO would be near average. If no El Niño develops, their model predicted slightly higher activity
North Carolina State University
A very active Atlantic hurricane season is predicted by NCSU: 14 -18 named storms.

by Jim Roemer | Apr 2, 2018 | Climatelligence, Commodities
Cocoa’s Bull Move
Cocoa is one of the few agricultural commodities in a “consistent” bull market during the last few months, rivaled only by cotton, which soared from rising global demand. There has been a host of information over the last two months that has resulted in surging cocoa price levels. Last year, commercials and hedgers were caught short ahead of the mid-crop harvest and during the onset of the massive global crop. This winter, short covering due to a combination of some hot-dry weather in West Africa , improved demand, aided by a smaller mid-crop. A non-weather related fundamental (see following link) inspired short covering a few weeks ago:
Years having huge west African cocoa crops are often followed by lower production.
Veggie Health
Below, one can see the “vegetative health index” change and the subsequent improvement versus some earlier winter weather concerns. However, strong demand and lack of available supply this time of the year is keeping cocoa in a bull market. Going forward, price direction will be dictated by the timing of La Nina’s demise. Another factor will be the extent to which global crops fare during the coming summer and autumn.
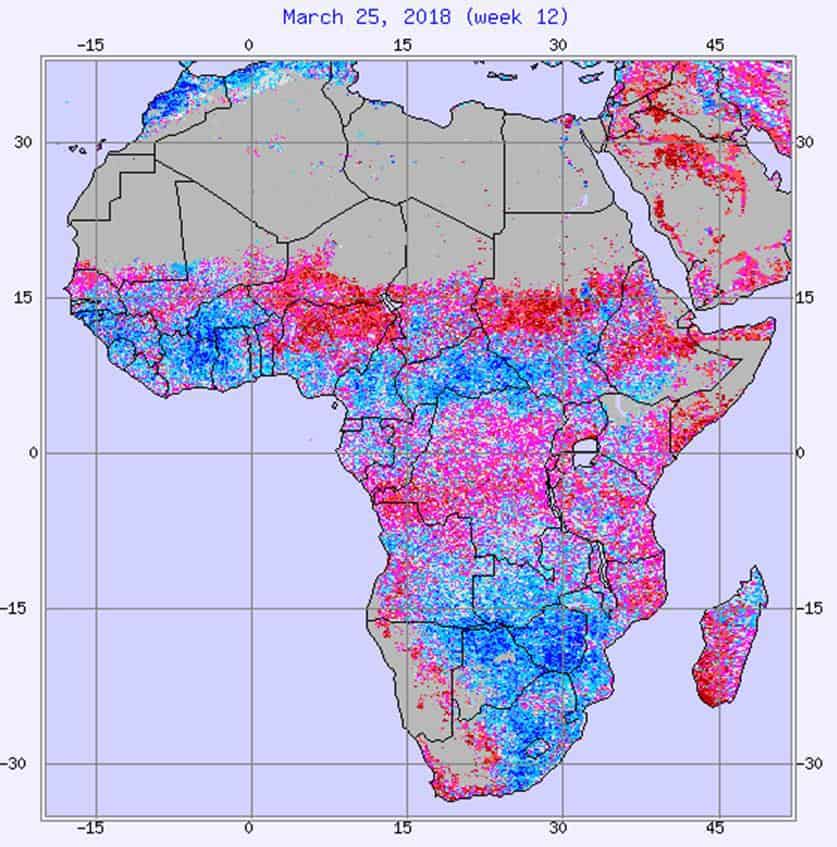
The vegetative health index above shows the improvement (blue) in west African cocoa weather since January. The map below shows winter crop stress (red) that lowered this season’s mid-crop and was partly responsible for the surge in cocoa prices the last few months.


ENDING DEFORESTATION IN WEST AFRICAN COCOA REGIONS
Associated Press
MONT PEKO NATIONAL PARK, Ivory Coast (AP) — Park rangers in the world’s top cocoa producer, Ivory Coast, are waging a campaign to protect national forests from the illegal farming of the raw ingredient in chocolate.
Last year the governments of Ivory Coast and other top cocoa producer Ghana, along with food giants Nestle, Mars and Hershey, pledged to work together to end deforestation in the West African nations.
The president of the World Cocoa Foundation, Rick Scobey, called it a landmark decision and an “important environmental achievement.”
Last year an investigation by environmental group Mighty Earth found that many of Ivory Coast’s national parks and protected areas “have been entirely or almost entirely cleared of forest and replaced with cocoa-growing operations.” One of them, Mont Peko National Park, is home to endangered species such as chimpanzees and pygmy hippopotamuses.
Chocolate producers should “really give customers peace of mind that chocolate eating isn’t contributing to killing chimps or elephants,” said Etelle Higonnet, a campaign director for Mighty Earth. “Let’s have total transparency all the way from the bar in your hand or the Nesquik that you drink or the Nutella that you spread on your bread, down to the farm.”
On a recent patrol in Mont Peko National Park, it didn’t take long for park rangers to find the crop growing illegally. Using machetes, the team set to work removing it.
There has been limited progress, said Kpolo Ouattara, head of the Mont Peko sector for the Ivorian Office of Parks and Reserves. “Roughly, more than 800 hectares (1,975 acres) of cocoa has been cut. Compared to the park’s total area of 34,000 hectares, that’s very little.”
While mindful of tensions that have lingered in the wake of the country’s deadly political violence in recent years, Ivory Coast has turned to security forces to evict thousands of illegal cocoa farmers from parks.
However, authorities say some have been sneaking back in to harvest trees hidden deep in the forest.
One farmer, Djaka Issa Ouatara, said he accepts the government’s actions.
“We weren’t surprised because when we entered that area, we were well aware that (the forest) was part of the national heritage,” Ouatara said.
Still, some observers worry that local traders are willing to turn a blind eye to any illegal provenance of cocoa headed for the global chocolate market.
Scobey with the World Cocoa Foundation recommended that chocolate lovers choose brands that advertise their adherence to international standards and check brand websites for information about their commitments to environmental and human rights concerns.
“We can’t indulge in a feel-good luxury product at the expense of a huge swath of tropical rainforest,” Higonnet with Mighty Earth said.
by Scott Mathews | Oct 2, 2017 | Climatelligence, Global Warming
Image Source: earthKAM.org
It is often quoted. You’ve been hearing it or reading it for years. Politicians and business celebrities use it in their opening lines. Motivational speakers woo their audiences with it. It is the proclamation that the Chinese character for “crisis” is a formation comprised of two characters: one signifies “danger” while “opportunity” is the meaning of the other.
Check it out at your favorite online research source, and you’ll find that this story is nothing but Fake Etymology (bogus word origin).
Here’s the current Wikipedia take: https://en.wikipedia.org/wiki/Chinese_word_for_%22crisis%22
Even if it isn’t precisely true, the concept actually does make philosophical sense. When confronted with a crisis, you have the choice of three ways to perceive it: as a danger, as an opportunity, or as both.
Perceptions of the climate situation also fall into three camps. Some see a dire threat that only humans can stop, whether they created it, or not. Others see a natural cycle that swings like a pendulum throughout the millennia. In the third camp are the opportunists, who see profit.
The term “climate change” can conjure up a wide range of thoughts and emotions. Euphemisms applicable to climate uncertainty are clichés. Is the glass half full or half empty? Do you focus on the doughnut or its hole? What’s real is society’s responses which encompass the totality of full glasses and empty ones, doughnuts and holes, dangers and opportunities. These are not fake.
Greet the Heat and Embrace It
In 1988, Achel Bakeri, now one of the wealthiest people in India, founded Symphony, the world’s largest manufacturer of cooling systems. At the start, Symphony’s customers were all domestic, but in the last 10 years, climate change has showered them with export opportunities. A record heat wave that hit Russia in 2010 opened the floodgate for Symphony. Their core customers stretch from the Middle East to North Africa. Heat waves in Europe have broadened their coverage to Germany and UK. Symphony’s biggest project (the biggest air cooler project anywhere, so far) is in Mecca.

Photo by Prarthna Singh
The company is featured in an article published on The Verge (theverge.com) by Josh Dzieza. It is entitled The Race Against Heat and subtitled “How do you cool 7.5 Billion people on a warming planet?” The author quotes Symphony’s sales VP, Rajesh Mishra, who sees climate change as a threat as well as a business opportunity. “It looks bright!” he said, laughing, when I asked him about the future of the cooling industry. “It is bright because of the changing climate, unfortunately. This is an irreversible process, and now with the great Mr. Donald Trump pulling out of the treaty, things will become even worse,” he said, smiling grimly.
Sensibilities such as Mishra’s are real, not fake. There is an old saying: “When life gives you lemons, make lemonade!”

Photo by Prarthna Singh
Benefactors
Regardless of the cause, the Arctic is warming. It is real, not fake, news. Greenland’s onshore glaciers have been retreating to reveal significantly large mineral deposits. These include iron, zinc, uranium and gold. Not only are diamonds there too, but the lodes of rare earth elements may rival those in China. As the Atlantic Ocean has been getting warmer, fish populations are seeking a colder environment. Mackerel, herring, cod, halibut, haddock and blue fin tuna have been migrating into Greenland’s waters. This windfall is merely the flip side of the other story. It is the corollary of rising sea levels that could extinguish any island nations left after the cascading catastrophic weather events get their first licks.
The New England cod business is collapsing because the cod swam away to a colder place. They will be caught and sold by someone else. That’s business. Speaking of climate change windfalls, there is a host of examples in McKenzie Funk’s book Windfall: The Booming Business of Global Warming (Penguin Press, 2014).
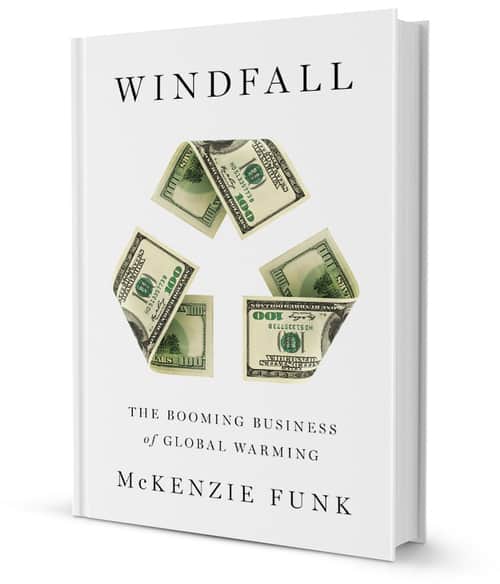
“Global warming’s physical impacts can be separated into three broad categories: melt, drought, and deluge. Funk travels to two dozen countries to profile entrepreneurial people who see a potential windfall in each of these forces.”
“The melt is a boon for newly arable, mineral rich regions of the Arctic, such as Greenland-and for the man-made snow trade. Drought creates opportunities for private firefighters working for insurance companies as well as for fund managers backing south Sudanese warlords who control local farmland. The deluge (rising seas, surging rivers, and super-storms) has been our most distant concern.”
“However, for Dutch architects designing floating cities and American scientists patenting hurricane defenses, the race is on. By letting climate change continue unchecked, we are choosing to adapt to a warming world. Containing the resulting surge will benefit some, but much of the planet will suffer. McKenzie Funk has investigated both sides, and what he has found will shock us all.”
Barnesandnoble.com
-Scott Mathews
by Jim Roemer | Aug 21, 2017 | Climatelligence
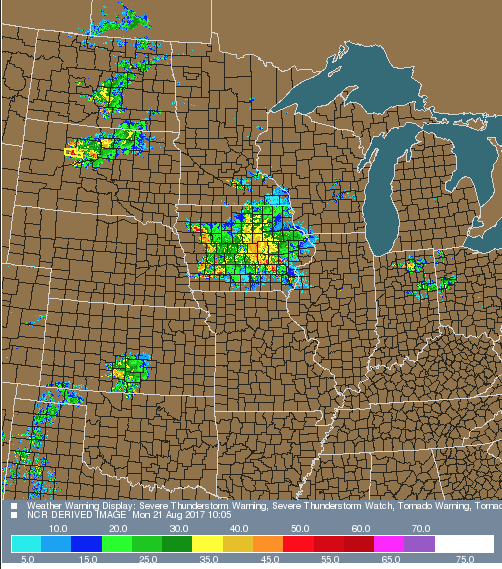
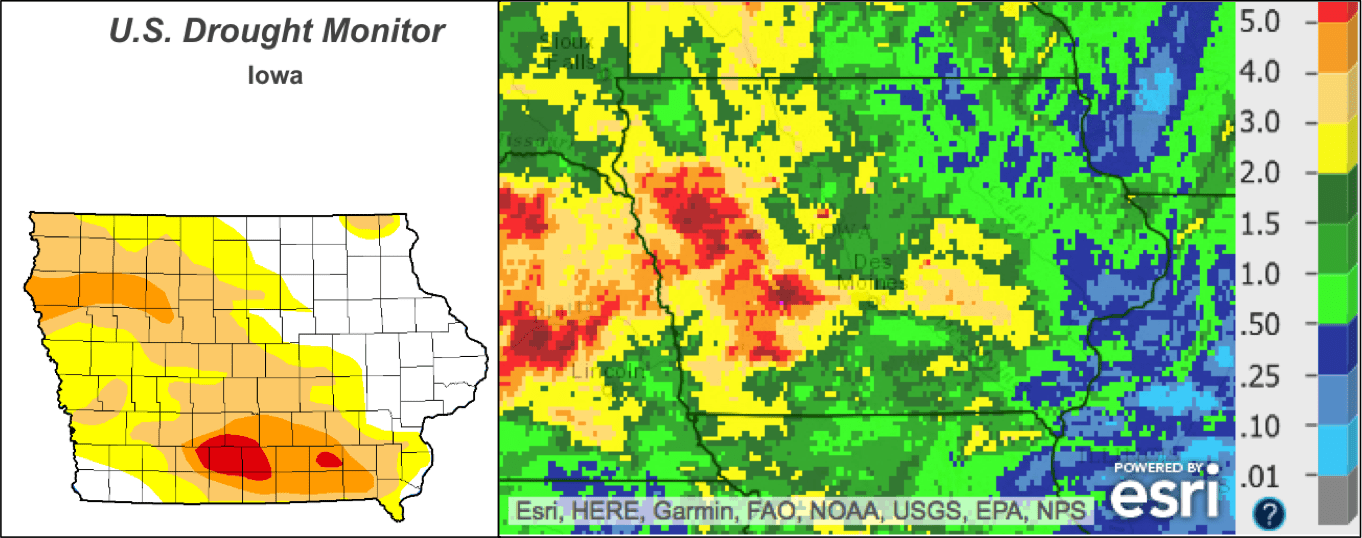
Great rains fell over drought stricken Iowa this morning. We mentioned this possibility in our newsletter Friday morning. Models did not pick up on the extent of these storms until Saturday. However, the general set up showed a strong potential for ample rainfall. Models forecasted weak westerly flow aloft, a low level jet, and strong low level southwesterly winds a high dew points. This led to deep thunderstorms with a Lifted Index of -6.3 and a Total Totals Index value of 59.
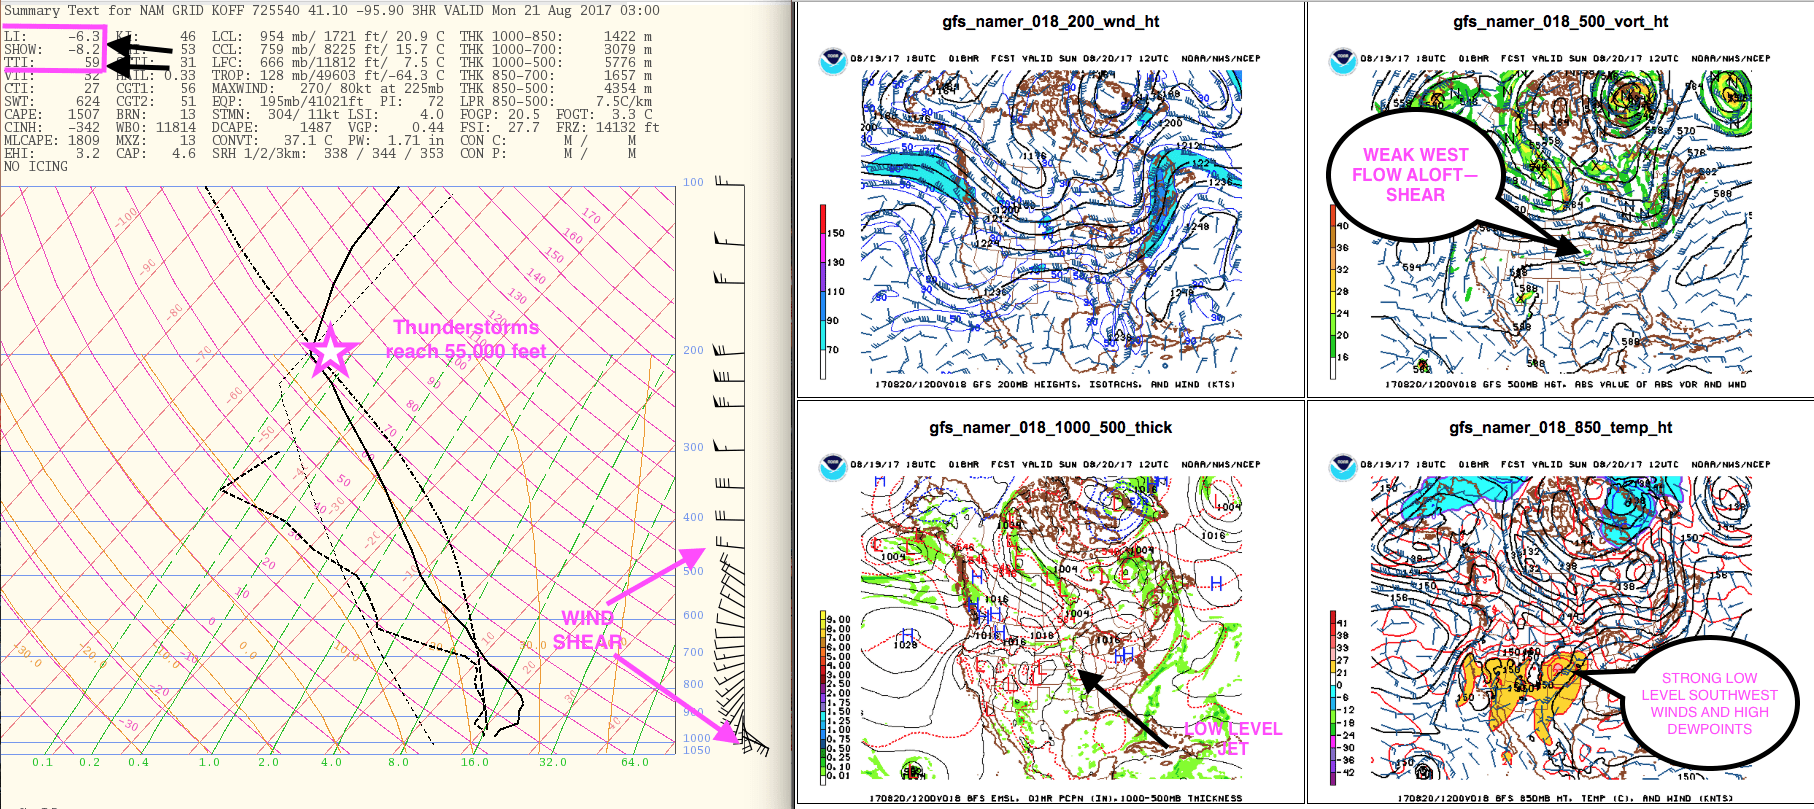
The rainfall over the past two days should improve drought conditions in parts of southern Iowa. Notice the 2″-6″ in the image below. Traders will have to grapple with this news and the fact that PRO FARMER tour will be going on August 21st-24th. The recent beneficial weather may be overshadowed by the realization of damage from previous dry weather.
HERE ARE TWO EXCERPTS FROM OUR CLIMATELLIGENCE WEATHER COMMODITY NEWSLETTER LAST WEEK:
USDA Shocker for Grains
“Several weeks ago, we stated that the Iowa drought would begin to ease later in the summer, and that the easing “would just be a matter of time.” Also, we pointed out that it is rare to get a bull market in corn and soybeans when the weather is cool in the Midwest. With August weather much more favorable and the world awash in beans; furthermore, a couple of weeks ago, we advised subscribing clients to reverse positions and ride the current wave down in soybeans. All eyes will be on the September USDA crop report and whether, or not, the department’s huge crop estimates had been over-estimated. September can often be an up month in grains, so we would not recommend necessarily shorting grains on this current break, although, U.S. weather is bearish for now. We look for important rains in drought stricken Iowa, next week.

SOME RECENT TRADE SUGGESTIONS
So what were some of our other trade suggestions in late mid-late July in Climatelligence? Remember, this is only a FREE newsletter right now, and again not all of our thoughts, trade ideas and viewpoints have been presented.
We recommended selling cocoa put options, thinking that demand and disease issues in west Africa could help prices, and also selling natural gas after potentially bullish EIA numbers in the July 27th report. The gas advice was due to cool weather. However, both of these recommendations were “short-term” in nature and not available in our monthly newsletter. Cocoa prices hit resistance a week or so ago, and we felt that at $2000, prices were high enough. Global production has rebounded and the chances for El Nino have diminished.
Finally, the psychology of the hurricane season and lower production from recent EIA reports could set a floor in natural gas prices. Though we are still awash in shale production; and cool late summer U.S. weather is keeping a cap on prices. Both the crude oil and natural gas market will be watching the Gulf coast or hurricanes this fall. Given the potential for more international tensions and hurricanes, crude oil may have more upside potential.
However, updated daily advice is only reserved for full time daily clients email us for information at subscriptionsbestweather@gmail.com
The Trump Effect May be Over and September is often a Down Month for Stocks
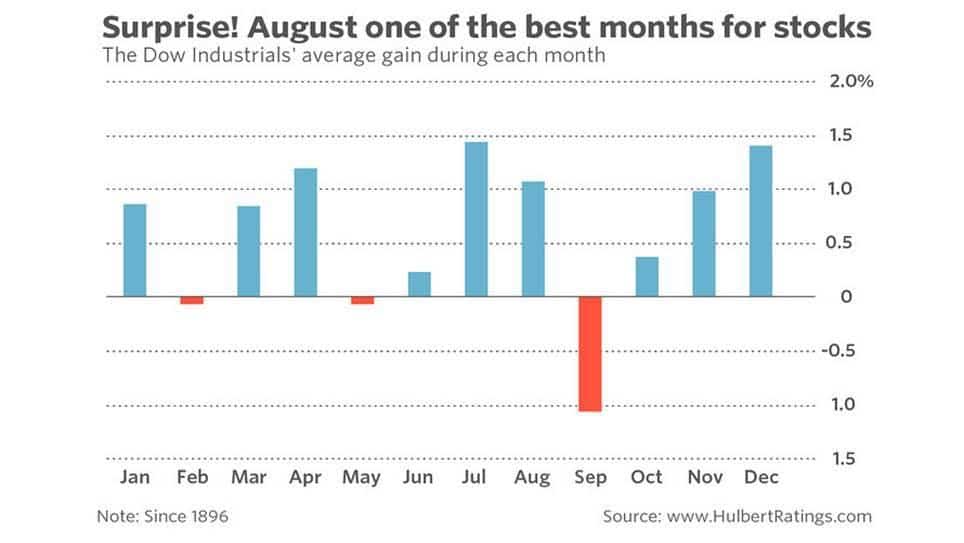
While we try to shy away from strictly talking about stocks (unless they are related somehow to weather and the environment) a word of caution about the stock market. Most of Trump’s promises to his “base” have not come to fruition and while U.S. unemployment is at the lowest level in years. (No credit to Trump, may I remind you, but this was set in motion by the Obama administration years ago.) there may be too many people bullish stocks.
Terrorism is rising, there is political uncertainty in Washington and the chart above shows the history of lower stock prices in September. We still like the stocks NEE and TAN as the world turns more towards solar energy. Remember, NEE has been regarded one of the most ethical companies. In the world for 10 years. Nevertheless, a word of caution that If the stock market sector has a correction, so will these stocks.”