This video by Jim Roemer (AKA Dr. Weather) addresses:
A) Why forecasts for warmer weather deeper in February helped pressure natural gas and the ETF (BOIL) some 50% since the polar vortex and bull market, two weeks ago.
B) Why parts of the northern U.S., including the Northeast, will have off and on bouts of colder weather, vs warm weather over the Midwest and deep south
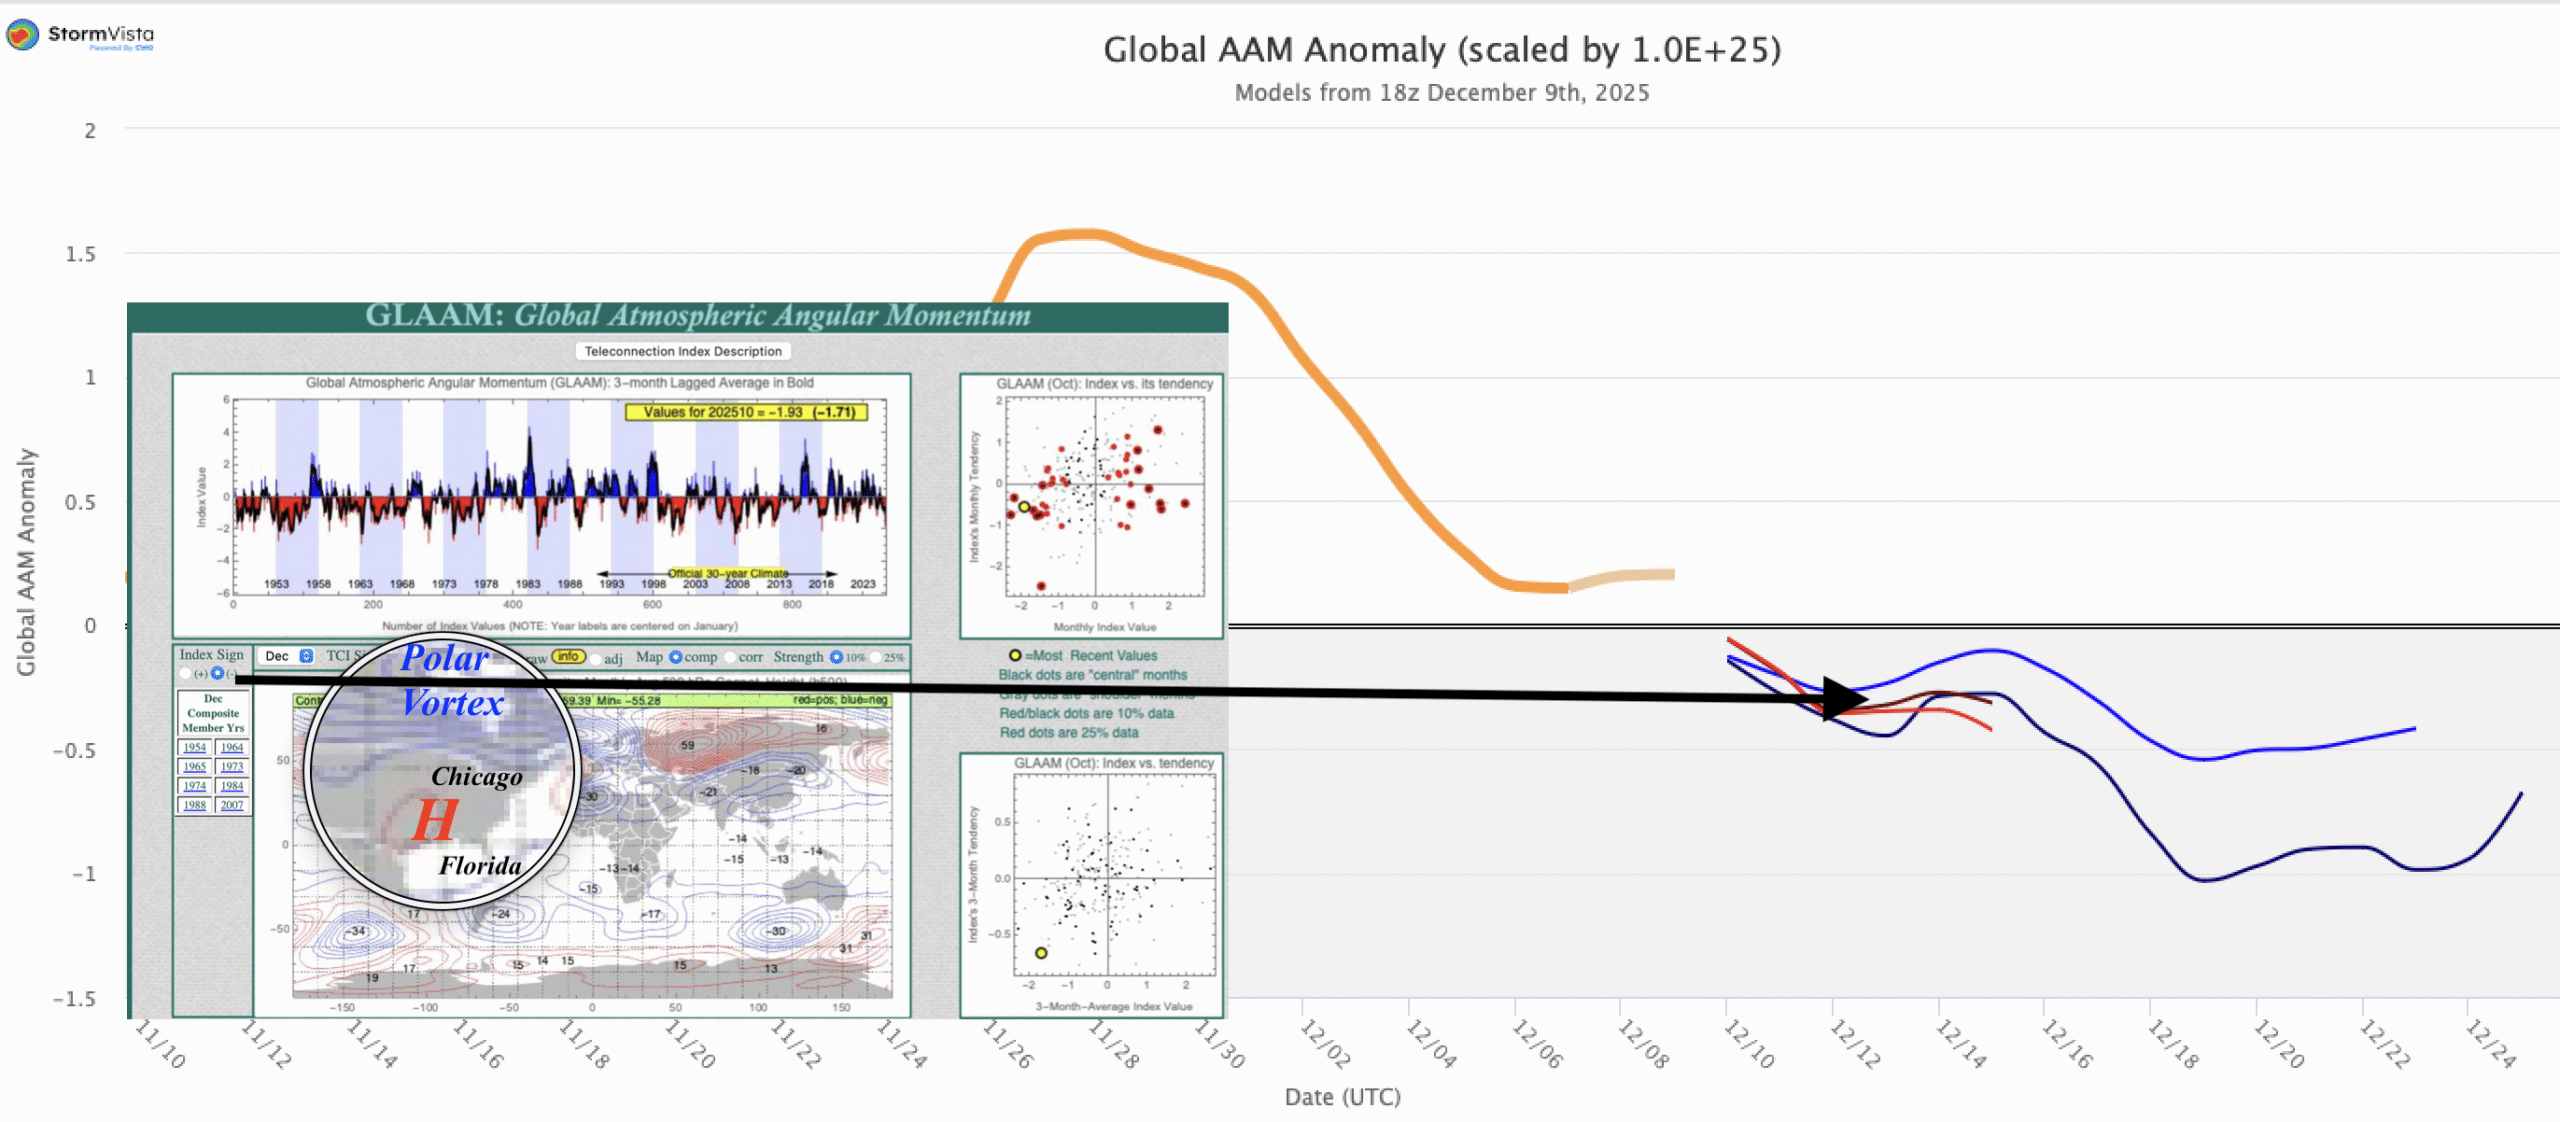
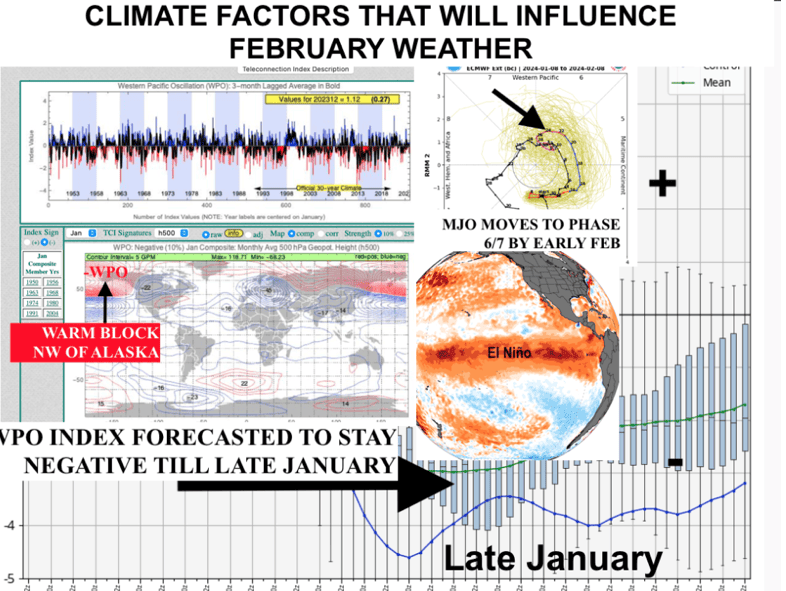
C) What is the significance of the Madden–Julian oscillation (MJO) in phase 4/5 and the negative GLAAM (Global Atmospheric Angular Momentum) and why these are usually warm, bearish signals for natural gas.
D) A very strong -WPO-/-NAO signal: Why typically this would result in major cold U.S. weather and a bull move in natural gas prices.
E) When having all of these different climatic forces (teleconnections), why using option strangles selling way out of the money call and put options in natural gas, will help capture price volatility
Following some free reports about weather and commodities here on Substack
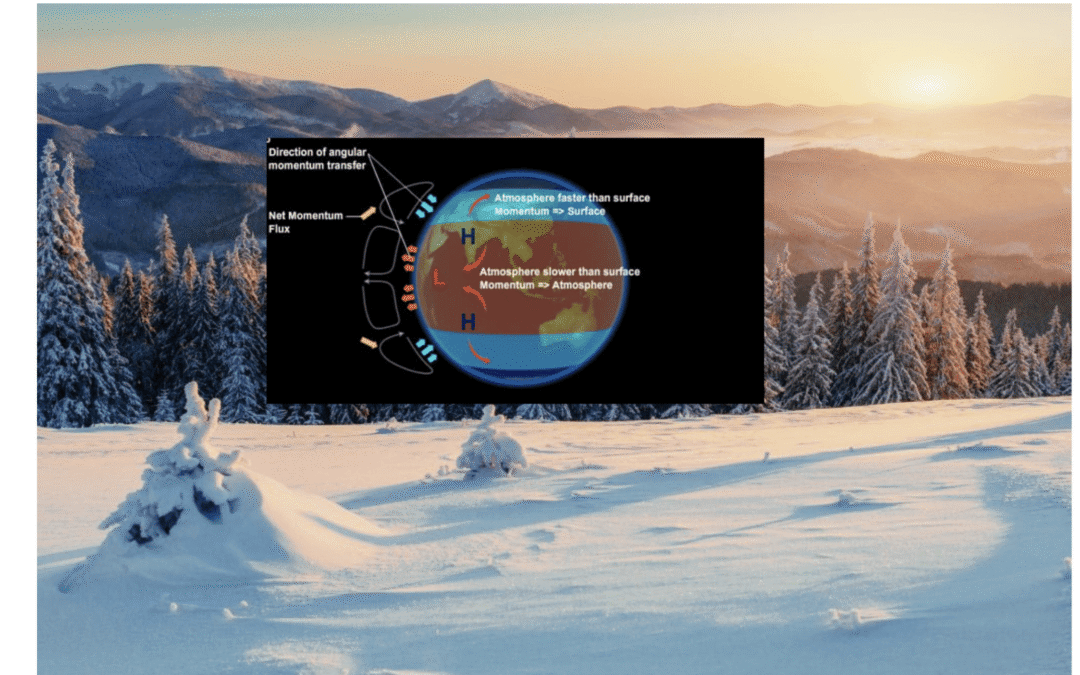
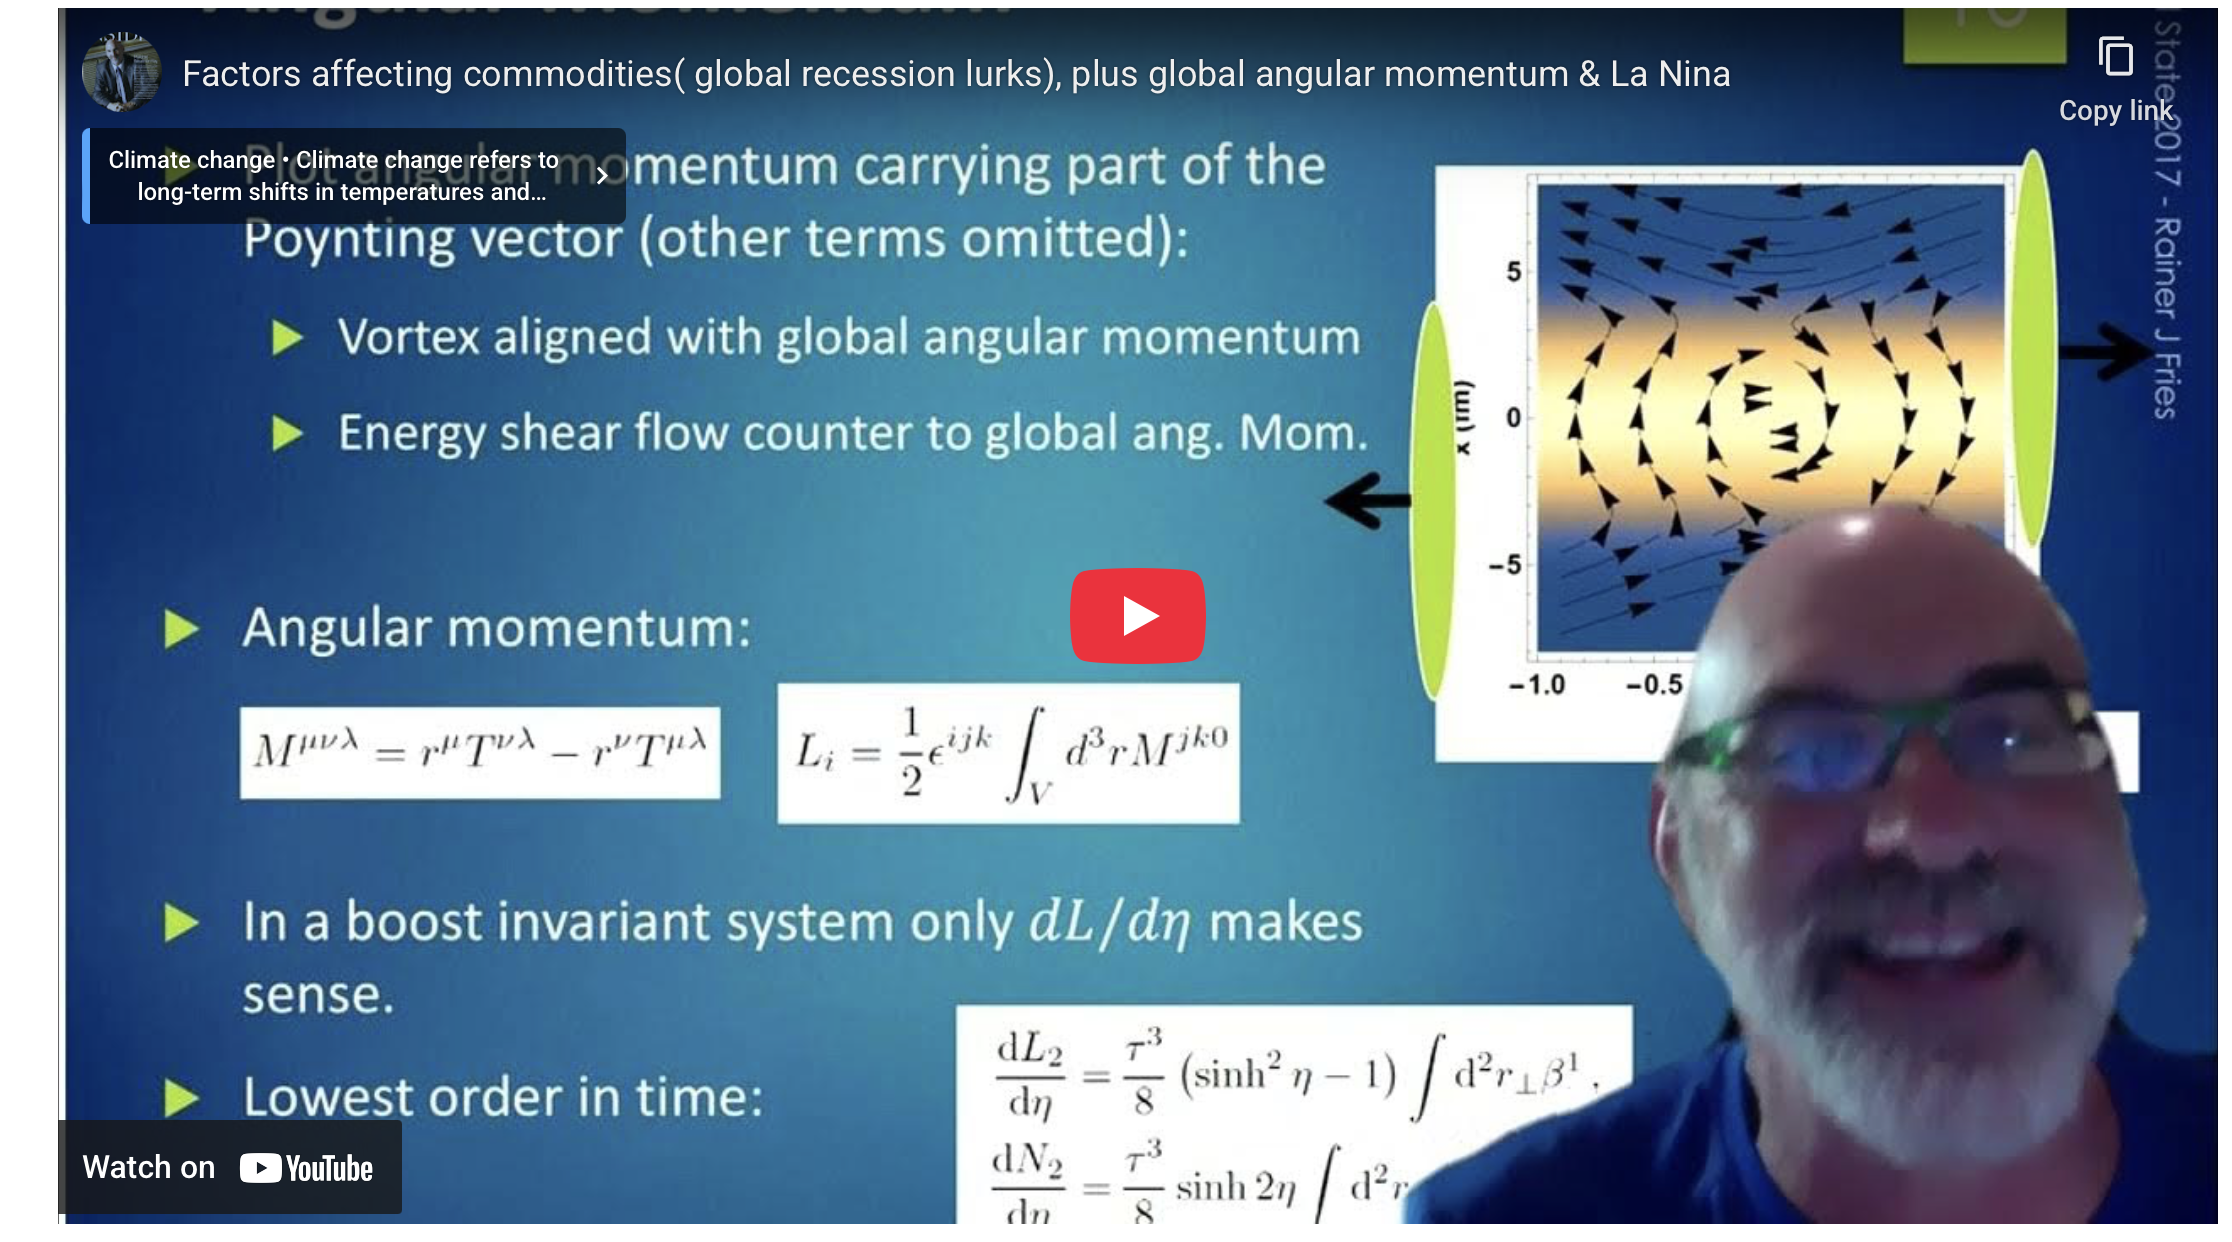
GLAAM stands for Global Atmospheric Angular Momentum in weather forecasting. It is sometimes referred to as GAM and/or GLAM, but they all refer to the same phenomenon. It measures the atmosphere’s rotation, combining Earth’s spin and wind patterns, acting as a crucial index for global circulation and Earth’s rotation, used to understand large-scale climate patterns like ENSO and predict seasonal changes, linking atmospheric shifts to length-of-day variations via numerical models.
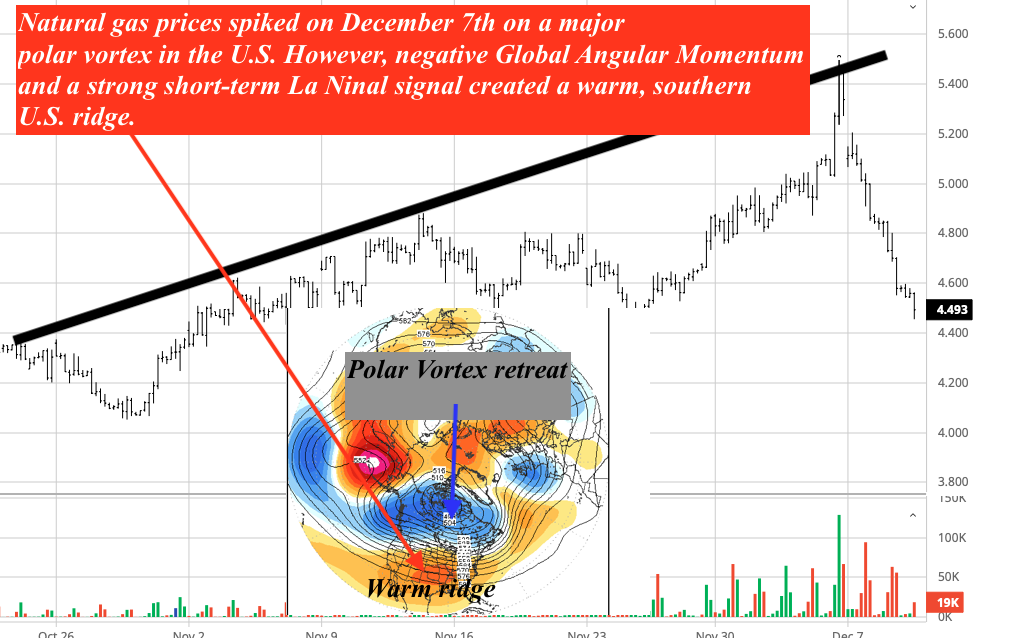
There are both positive and negative angular momentum phenomena, and it is the negative GLAAM that is responsible for the mid-late December warm up over most of the United States and (as of this writing) the massive 20% sell-off in natural gas in just a few days.
Key Concepts
What it is: A measure of the total rotational momentum of the atmosphere around Earth’s axis, calculated by integrating wind speeds and densities across the globe.
Components: It includes the momentum from Earth’s own rotation (mass term) and the momentum from atmospheric winds (wind term), which vary seasonally.
Why it Matters:
Earth’s Rotation: Fluctuations in GLAAM directly affect the Earth’s rotation speed and thus the length of the day (LOD).
Atmospheric Dynamics: It helps study how mountains, surface friction, and jet streams influence global weather patterns.
How it is used in forecasting:
Monitoring: Atmospheric angular momentum is monitored in real-time using data from numerical weather models (like NASA’s GEOS models).
Seasonal Forecasts: Negative GLAAM often signals conditions favoring La Niña, potentially leading to cooler, snowier winters in certain regions, while positive GLAAM links to El Niño patterns.
Predictability: Studies suggest long-range forecasts of GLAAM (up to a year) are possible, offering insights into future climate.
In essence, GLAAM provides a unified view of atmospheric dynamics, linking winds to Earth’s rotation and helping forecast broader climate trends.
Negative global atmospheric angular momentum (GLAAM) is associated with La Niña conditions and can contribute to warmer winter weather in parts of the U.S. by altering global circulation patterns, particularly the jet stream.
During a negative GLAAM phase, the atmosphere moves more slowly relative to the Earth’s surface. Thinks of it like the skater to the right.
This change is consistent with and helps maintain La Niña conditions. During La Niña, the trade winds blowing east-to-west across the tropical Pacific are stronger than usual. These strong trade winds push warm surface water toward Asia, allowing colder, nutrient-rich water to upwell along the American west coast. This process is a key feature of La Niña, and the associated atmospheric circulation changes are reflected in the negative GLAAM.
Will the Polar Vortex come south again by January? Will GLAAM go in the opposite direction and become positive? If so, natural gas prices would rally again, as we approach January.
That is what we do at WeatherWealth: We “out forecast” standard weather models and making trade recommendations for clients in soft, grain and natural gas commodities on six continents.
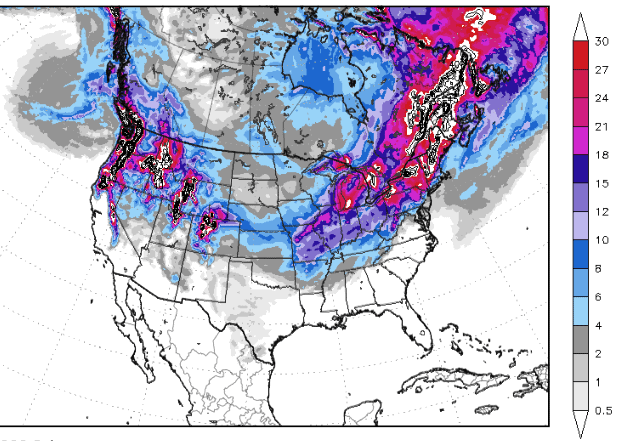
Up to 5-10 feet of snowfall in the Sierra Nevadas coming
What is warming at NINO4 east of Australia & possible implications for the transition of El Niño
The 2016 analog may be a good one. This could be bearish grains and potentially bullish Robusta coffee and sugar prices this coming summer, if it verifies
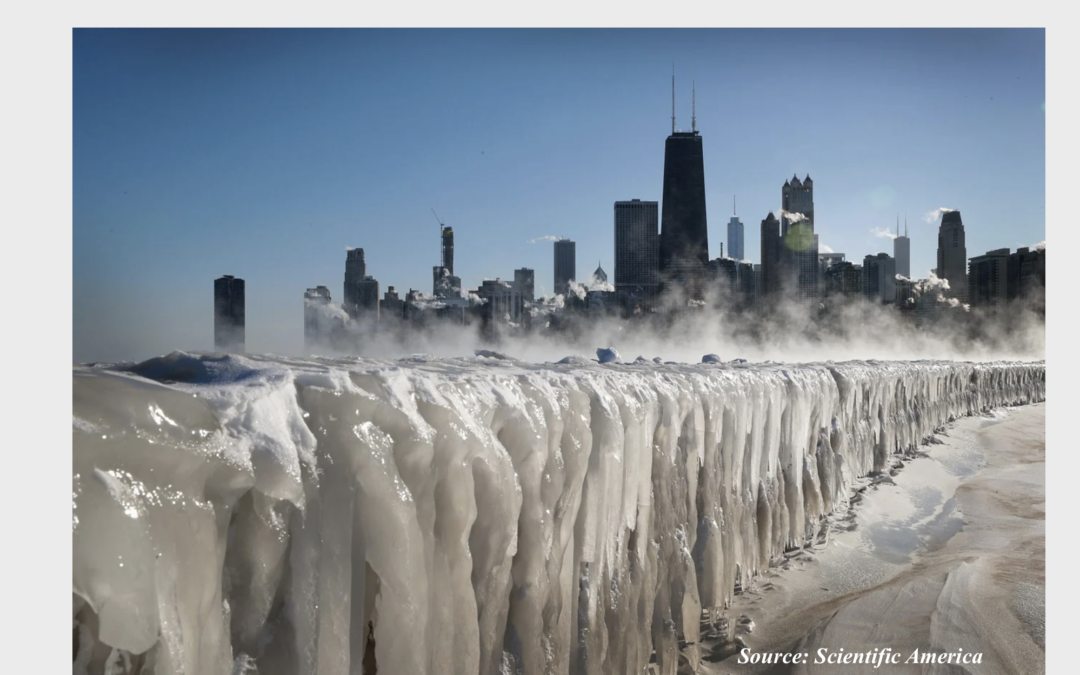
This video pinpoints the climatic variables responsible for the coldest U.S. weather in years. Frequent snowstorms will also occur. The good news is that some easing of the cold will occur by late January.
A negative NAO index has to do with a warm block near Greenland. (please watch my video —it explains how this is affecting commodities)
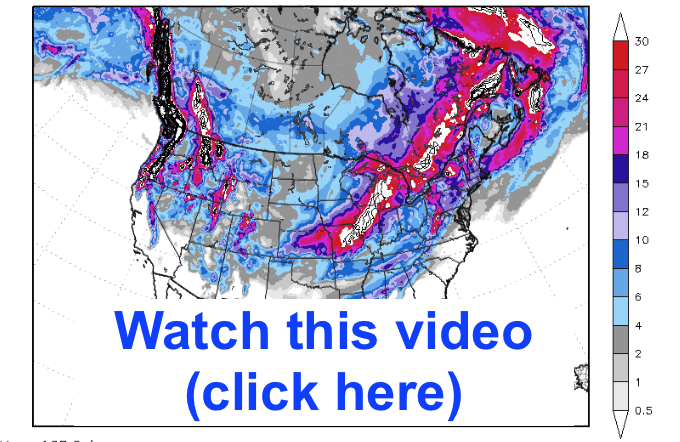
SNOWFALL PROJECTIONS NEXT 2 WEEKS (INCHES): A negative NAO will bring many areas in red and white over 1-2 feet of snow from at least 2 major storms. The most snowfall in several years
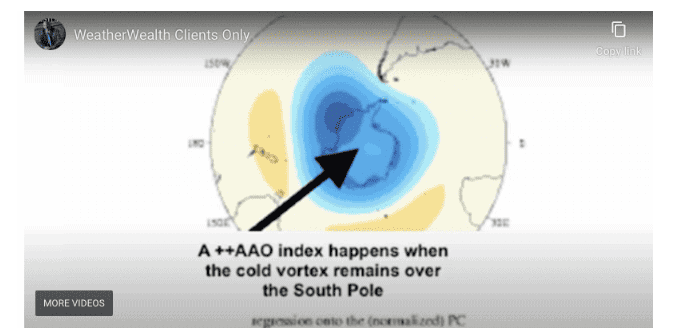
The opposite is happening over the South Pole (Antarctica), there has been a positive AAO index. This means the vortex stays put and does not move north. Combined with El Niño, this has brought improved weather for South American soybeans, something I alerted all my WeatherWealth subscribers about, three weeks ago.
Only 4 or 5 El Niño events have seen a powerful negative NAO index in January. Most of these years saw El Niño weaken by the spring or summer. Based on this scenario, this will be very important for many agricultural markets, and I will be developing trading strategies in options, futures, and ETFs.
How a negative NAO (warm block over Greenland that forces the Polar Vortex south) affects commodities:
1)Energy/Natural Gas: Coldest weather in at least 2-3 winters coming for Europe and the U.S. starting next week
2) Wheat: Isolated areas of winterkill in Russia and possibly Nebraska and big cold and snows for the southern Plains and Midwest. It will be important to monitor snowfall.
3) Cocoa: While I was bullish all summer and autumn long on major wet weather and disease issues, the lack of a Harmattan Wind in Ivory Coast and Ghana could prevent any further damage to the cocoa crop
How does a positive AAO index (The vortex that remains over Antarctica and does not move north) affect commodities?
1) Soybeans/Corn: Easing of the northern Brazil drought and potential big Argentina crops
2) Coffee: A hot November and early December likely will lower Brazil’s coffee production by several million bags, but improved rainfall is on the horizon that will stop further damage.
Join farmers and traders worldwide who want an advantage in trading agricultural and energy futures with over 100 issues a year of WeatherWealth with frequent weather updates and trading ideas. Download a recent complimentary issue here about El Nino https://www.bestweatherinc.com/new-membership-options/
This free report below was written three weeks ago before we changed the weather forecast for natural gas and energy markets)
HELPING YOU MAKE THE BEST INVESTMENT DECISIONS BASED ON THE WEATHER
We use cookies to ensure that we give you the best experience on our website. If you continue to use this site we will assume that you are happy with it.