by Jim Roemer | Apr 11, 2017 | Climate, Forecast, Strategy, Weather
Current El Nino Status
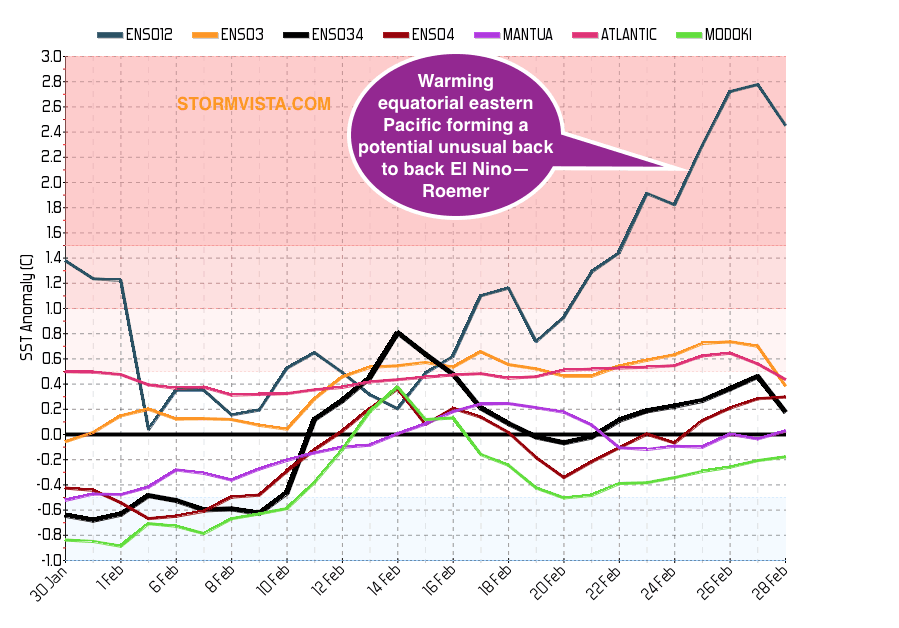
Forecasters and models alike are warning that a potential El Nino is on the way. Consequently, worries of major crop issues across the globe are abound. The Nino 1+2 index jumped significantly in early February, leading to warm anomalies off the West Coast of South America. The other indices (Nino 3, 3.4 and 4) are slowly catching up as well. The graph below shows the latest weekly values from NOAA.
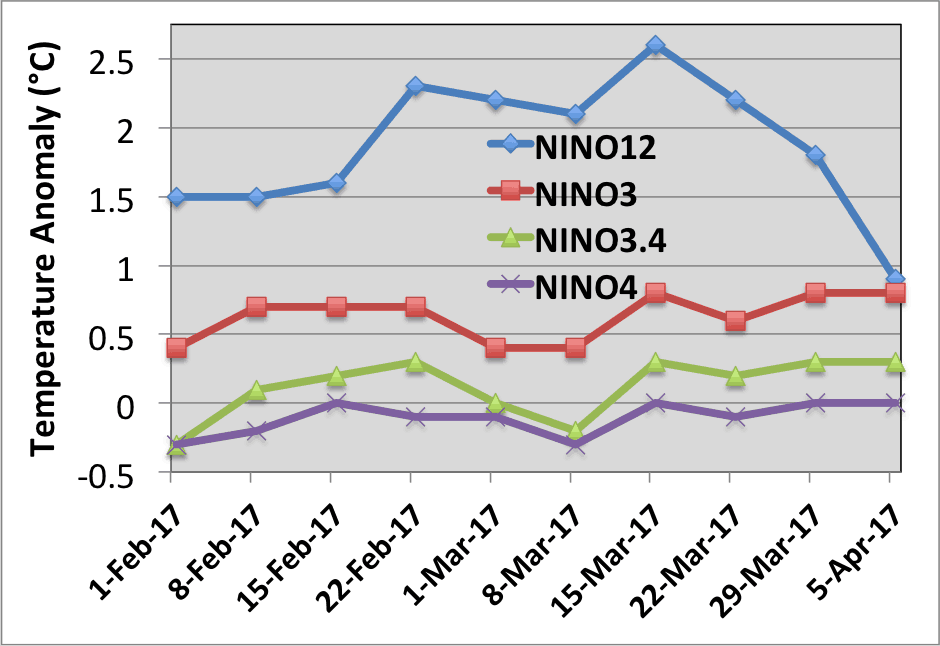
DATA SOURCE: NOAA/NCEP/CPC
FORECAST
The million dollar question is whether or not a full-fledged ENSO event will form by winter. Too soon to say? There is often a “spring barrier” for El Nino predication accuracy. Models do not yet have the capability to accurately forecast 7-9 months in advance with strong certainty. A great example of this happened in 2012. The model forecast from August 2012 is shown below. They clearly favor ENSO development. However, one never occured (black circles showing actual values).
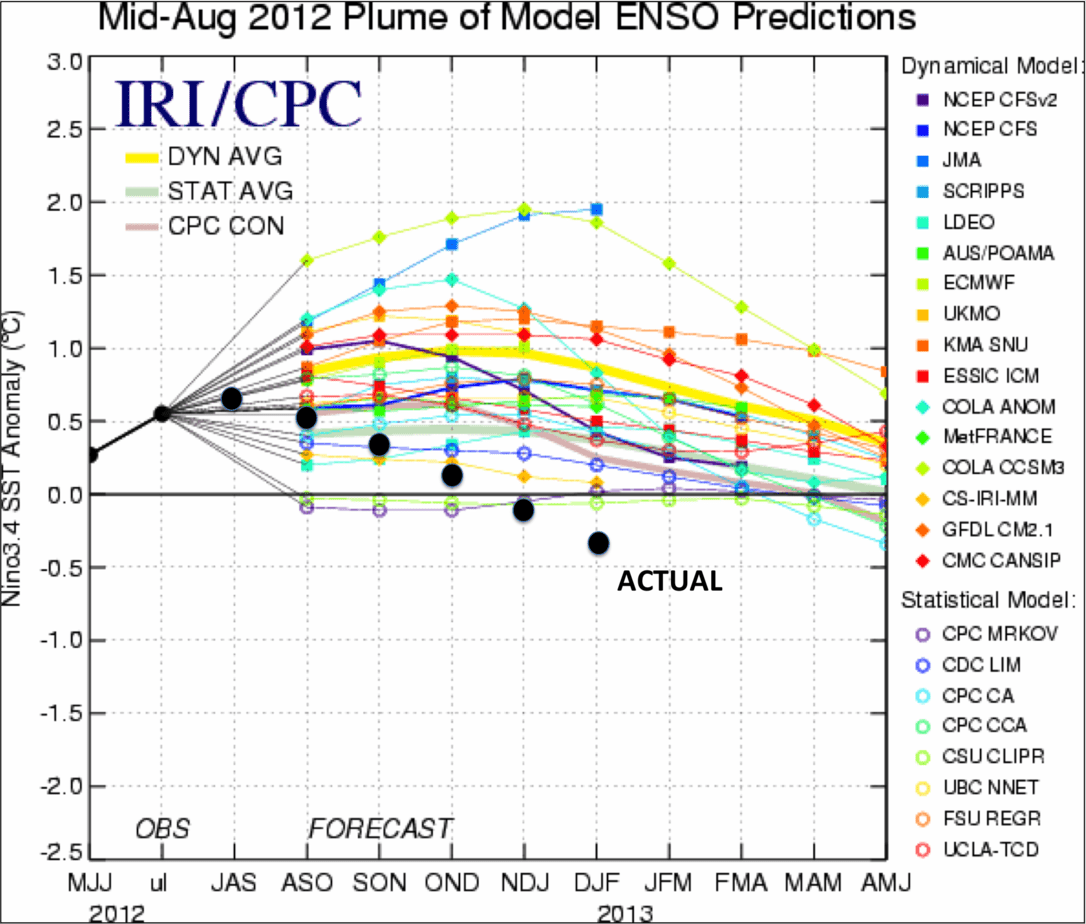
DATA SOURCE: NOAA/NCEP/CPC, IRI, and all model development Institutions.
The severity and timing of the El Nino formation will determine whether global crops are impacted. Warm sea surface temperatures in the Western Pacific causes less rainfall to fall during the Indian Monsoon (June-Sept). Flooding during Brazil’s cane crush could limit sugar production. The summer & winter demand for natural gas may also be impacted. Knowing the ENSO forecast will give traders a heads up before major commodity price moves. Our proprietary analysis (that we only give to our clients) on the models and teleconnection will provide the true chance of whether or not poor crop conditions will occur in 2017/18.
COVER IMAGE SOURCE: NOAA

by Jim Roemer | Mar 30, 2017 | Commodities, Strategy, Weather
Sugar prices rose near 50% in 2016 as the global deficit continued into its second year. India did not have the recovery in rainfall that most had hoped following an El Nino. The stocks/usage ratio dipped below 19% (ratio indicating percentage of global stocks compared to global consumption). But now, the outlook is bright. Brazil is about to harvest a bumper crop. Producers will process more sugarcane into sugar, rather than ethanol due to ethanol’s low prices compared to sugar. Demand for sugar snacks has also been waning, with Americans picking up more granola bars than candy bars. All of these paint a prettier picture for the supply/demand balance.
Historical Sugar Price Reversals
The image below shows the monthly sugar price versus the yearly stocks to usage ratio. We sent this to our clients back in October about our bearish stance. Typically prices peak during the winter months, after poor Indian/Thailand harvests are realized. Supplies are tight for the winter when stocks/usage ratio is below 19%. However, the prices usually fall when confidence in good Brazil production is realized. This occurs after the peak in the rainy season (Jan-April).
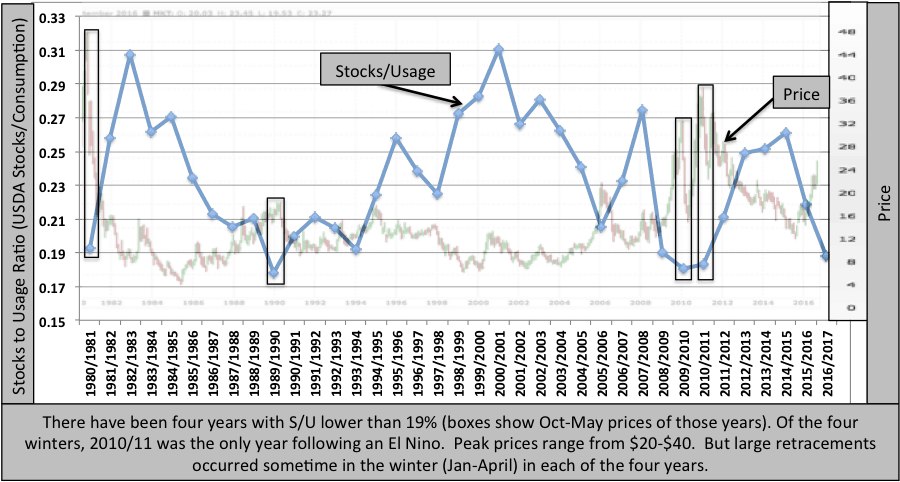
Data Source: https://apps.fas.usda.gov/psdonline/app/index.html#/app/home
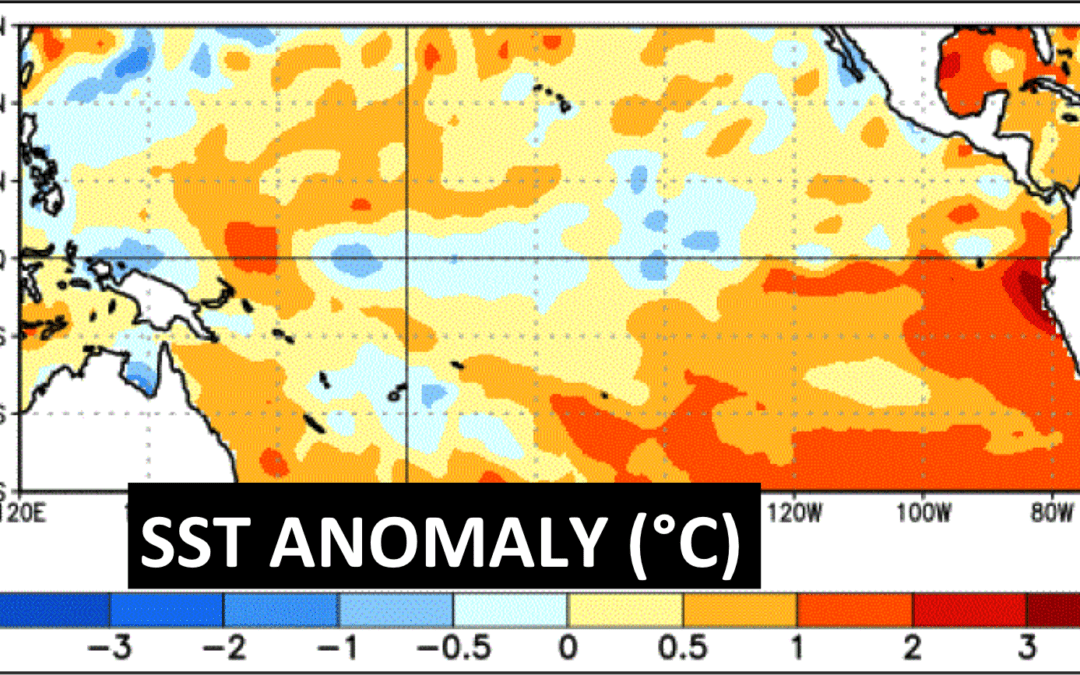
Moving forward, traders will be watching the progression of the Indian Monsoon. A +Nino 3.4 usually leads to below normal rainfall in the summer, as occurred in 2009. The ENSO models currently give a good shot of an El Nino forming for next winter. The main question we are answering for our clients: Will it develop quickly enough to negatively impact rainfall in India? We are working on research right now to determine whether or not the sugar deficit will continue.
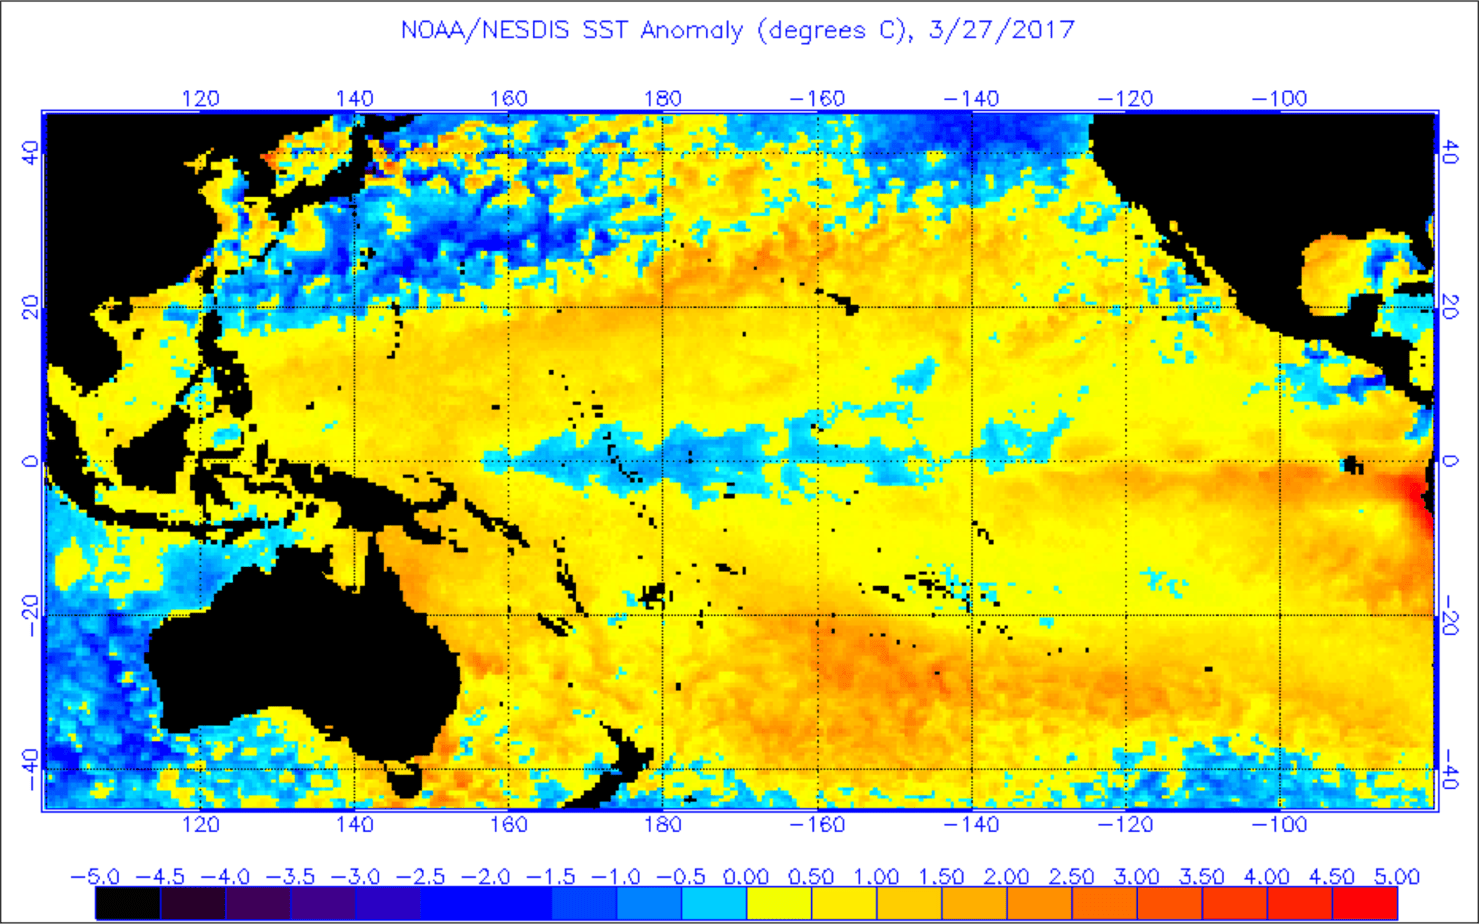
Source: http://www.ospo.noaa.gov/data/sst/anomaly/2017/anomnight.3.27.2017.gif
by Jim Roemer | Mar 1, 2017 | Climatelligence, Commodities, Forecast, Strategy, Weather
A warming climate, brought on by a developing east based El Nino (very unusual after a strong El Nino 2 years ago), deforestation in NE Brazil and global warming, all point to some unusual weather events for global commodities in the months ahead. We will have more of a discussion about El Nino, next week.
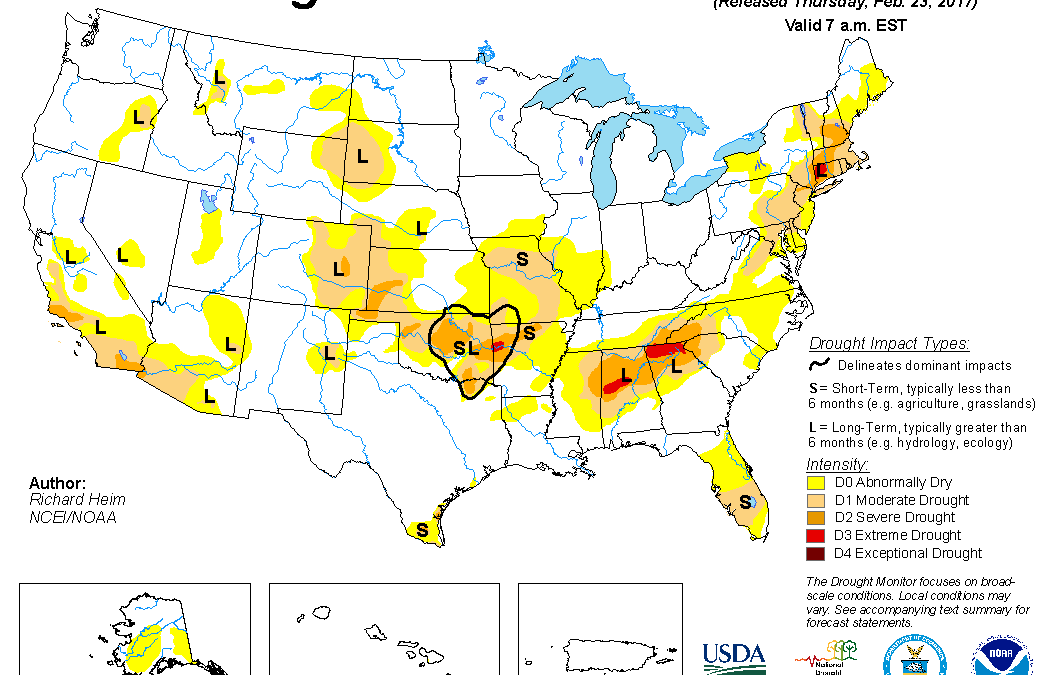
One thing that traders will begin watching is the developing drought in the western Plains wheat areas. While a bit early to cry wolf, it will be important soon that consistent rains fall in this region.
Forecasts for these and other commodities, I can only furnish to my privileged client. (see top feature drought monitor map)
In an interesting article in the NY Times recently, please read about deforestation issues that are only growing worse in Brazil.
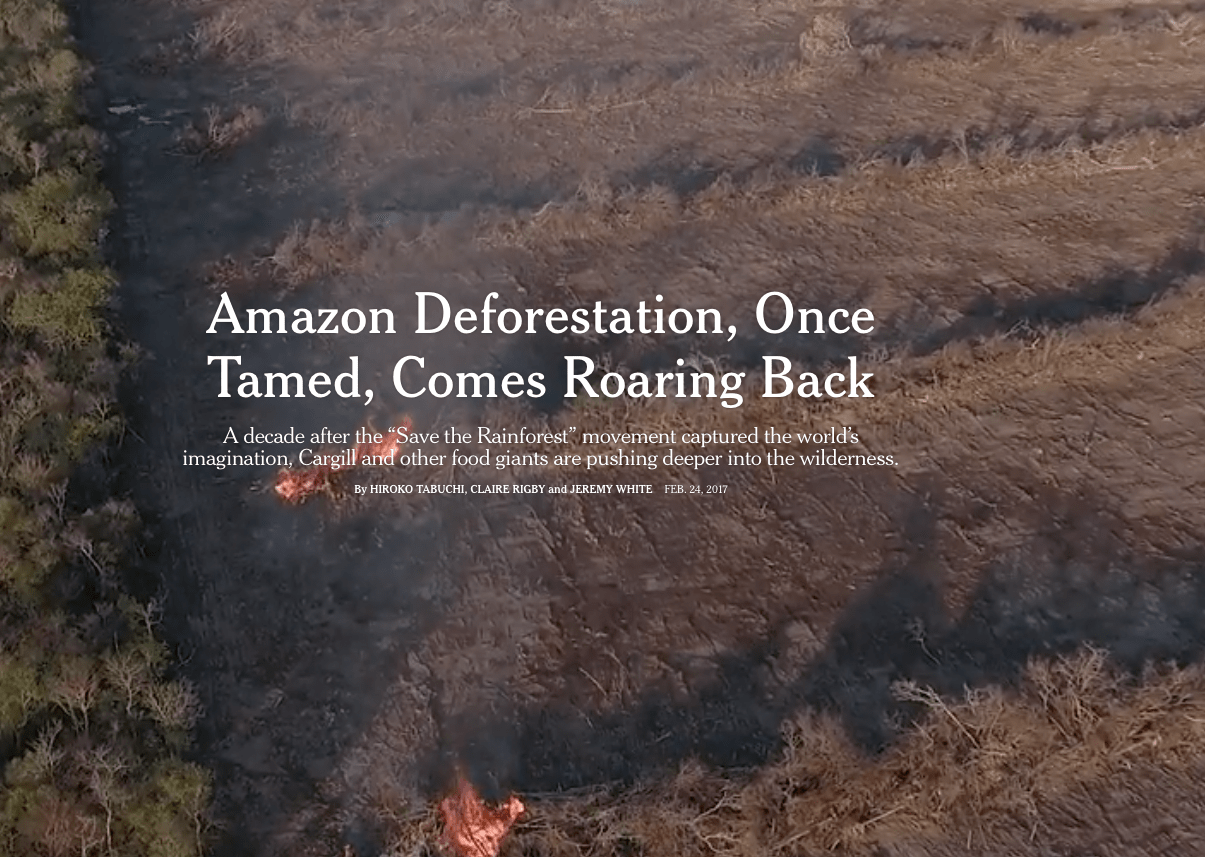
NY Times–Deforestation
by Jim Roemer | Feb 28, 2017 | Climate, Commodities, Forecast, Strategy, Weather
Why The Record Warm Winter Fooled Most Forecasters, Commodities And The End Of The California Drought
This article was written by Jim Roemer on February 23 about why weather is a neutral or bearish influence on many commodities.
Feb. 23, 2017 AR, BAL, BNO, BOIL, CANE, COG, DBE, DBO, JO DCNG, DGAZ, DNO, DTO, DWT, FUE, GAZ, GLD, GRN, JJE, KOLD, NIB, OIL, OILK, OILX, OLEM, OLO, ONG, PSX, RJN, SCO, SOYB, SZO, UBN, UCO, UGA, UGAZ, UHN, UNG, UNL, USL, USO, WEAT (SOME ETF’S AND STOCKS AFFECTED BY WEATHER, MANY OF THEM BEARISH)
James Roemer
James RoemerFollow(753 followers)
Hedge fund analyst, commodities, natural resources
Summary
Warm Atlantic; weak El Nino signal; +QBO and another warm U.S. winter for natural gas.
Flooding in California; great skiing out West and no Argentina soybean drought suggest El Nino.
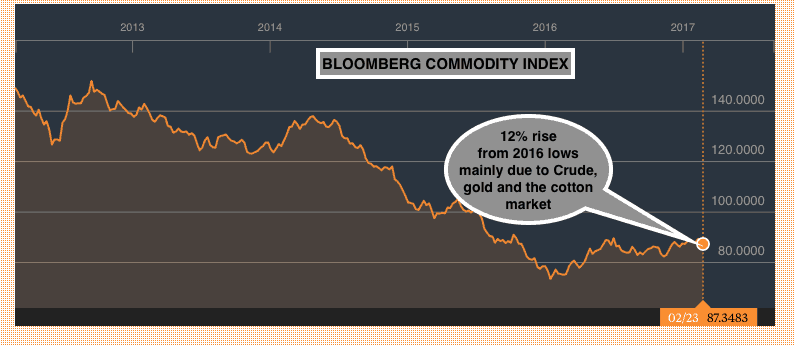
The Bloomberg Commodity Index is up, but not because of the weather.
The Record Breaking Warm U.S. Winter and End to California Drought
Historical floods in California; 110 degree heat in Australia; improving crop prospects for Argentina soybeans and the warmest February in history for the U.S. pressuring natural gas 25% the last month. These are all tell-tale signs that El Nino, not La Nina has driven global weather. El Nino, never really completely went away. You can see how we have been forecasting the best ski season in many years for the west and the end of the California drought for months, here.
Almost every weather forecaster called for a cold U.S. winter this year and this cannot be and further from the truth – the exact opposite. While we can at least partly blame this challenging winter forecast on global warming, the warm Atlantic ocean (+AMO) and a record breaking positive quasi-biennial oscillation (QBO) are equally to blame. A positive QBO has to do with stratospheric winds more than 20 miles above the earth. A positive value means winds blow west to east and can often prevent any sustained blocking over the N. Pole that would normally force down cold weather. These factors have all created a mini-snow drought over the Midwest.
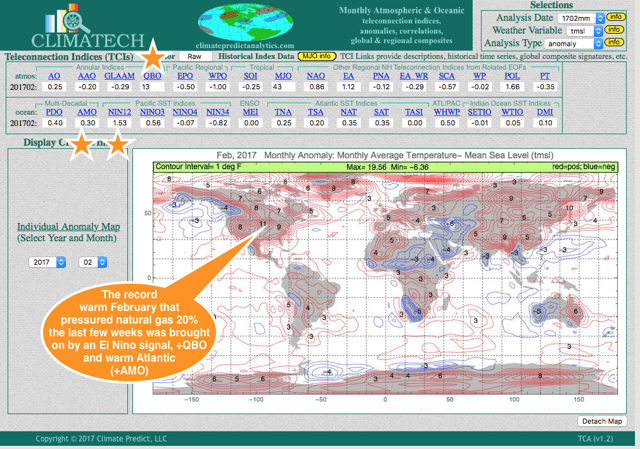
Climatech
Our sophisticated long range forecast program Climatech – above – shows the incredible February global warmth.
Spring Weather Hints at Cooler Weather and Wet, Snowy. What about Natural Gas?
There are some indications from our program that a cooler-than-normal spring would occur. If so, then natural gas prices (NYSEARCA:UNG) could find a bottom, otherwise, we have been bearish for clients the last few weeks. It’s probably a bit late to take advantage of the recent down move in prices. However, if El Nino does form, the odds of a normal to cool summer could ensue and the hurricane season feeble again. That does not bode well for natural gas in the longer term picture. The triple inverse natural gas ETF (NYSEARCA:DGAZ) is up nearly 70% on the warm February.
So which March-April periods had major rallies in natural gas on cold weather? 1999; 2002 and especially 2013 in which prices rallied more than 50% from the February lows on the coldest spring on record. The atmosphere is quite different presently than it was back then.
When one looks at the natural gas equity sector, it is no wonder that stocks such as Cabot Oil & Gas (NYSE:COG); Antero Resources Corp. (NYSE:AR); and Phillips 66 (NYSE:PSX) have greatly lagged the S&P 500. Phillips 66 is among the largest players in the energy sector and natural gas is a significant part of its operation. So weather patterns have a huge influence on profits.
Bloomberg Commodity Index Up Over A Year Ago, But Not Because of Weather (top of the page GRAPHIC)
The big movers in the commodity sector of late have been gold (NYSEARCA:GLD), cotton (NYSEARCA:BAL) and the crude oil (NYSEARCA:OIL) market. The crude oil market is reacting positively to a stronger stock market and OPEC’s push for full compliance with oil cuts. Gold has surprised many traders rallying in the face of expected interest rate rises. However, much of the rally, I believe, is due to continued uncertainty over the Trump presidency as well as technical indicators and inflationary fears. Cotton too, for now, has nothing to do with the weather. The 110 degree in Australia (#9 cotton producer in the world), is probably not a factor due to ample irrigation.
If you want to hear a recent Bloomberg interview of mine with respect to how weather is affecting certain commodities, please listen here.
In the meantime, we have been bearish the Soybean market (NYSEARCA:SOYB) due to a huge crop coming out of South American and generally ideal weather. The spike back to $10.80 a month or so ago in prices was due to flooding and planting delays in Argentina. The odds of a drought this summer in the Midwest is probably unlikely given the chances for a weak El Nino.
Cocoa prices (NYSEARCA:NIB) have taken it on the chin for months on a rebound in global cocoa production we discussed eight months ago. Seasonally, demand kicks in this time of the year and prices often stage a spring rally. If the waters stay warm south of West Africa and in the Indian Ocean, this would offset any chance that a weak El Nino would have in causing crop problems this spring and summer.
Sugar prices (NYSEARCA:CANE) continue to be strong on worries that an Indian sugar crop of only 22.5 million tons this year would require India to import sugar. Back to back years of a global sugar deficit, brought on by the strong El Nino two years ago has been partly responsible for the move up. If El Nino does not officially form, given that Thailand’s drought is not over and the potential exists for a rebound in production later this year, sugar is another commodity whose upside may also be limited.
After my bullish attitude in coffee a month or so ago on global problems with Robusta coffee (instant coffee grown in Vietnam, Indonesia and NE Brazil), the warm global winter may cause a reduction in coffee demand (NYSEARCA:JO). Also, the heavy spec long position and good crops out of Central America and Colombia may also cause a bearish spin in this market shortly.
The U.S. wheat crop (NYSEARCA:WEAT) usually does well after very warm winters and weak El Nino’s. A potential spring freeze scare could develop in a couple months, but unless crops are hurt by a dry spring either in the U.S., Russia and Europe, the long-term bear market may continue.
The key point to all of this is that the weather has not and may continue to keep a lid on many commodities. Given the demise of the California drought and record new snowpack in some areas, it is also possible a year or so from now, prices for vegetables, almonds, etc. (which have seen such a price strike from five years of California drought) could come down which would be good news for the American consumer. It’s the non-weather related commodities that continue to shine.
One potential weather problem might be a cool wet spring that could limit plantings of some crops like corn and cotton if this was to happen and possibly cause a reaction in the market later this spring.
Jim Roemer, bestweatherinc.com

by Jim Roemer | Jan 23, 2017 | Climate, Commodities, Forecast, Strategy, Weather
This huge January thaw has helped to pressure the natural gas market again and has been one factor in the weakness of the heating oil complex. The volatile EPO index (Eastern Pacific Oscillation Index) has to do with blocks close to and north of Alaska that can sometimes bring down the polar vortex. This will be the key over the next 6 weeks to the mid and end of winter and whether the eastern U.S. sees some improved snow for ski resorts. This feature may also play a role in disturbing the polar vortex enough to send it south during parts of February and March. If so, natural gas prices will bottom. One can see below the volatile up and down motion of the EPO index all winter influence by a combination of a fluctuating weak La Nina (that is now pretty much gone); changes in Pacific Ocean temperatures and lack of consistent stratospheric warming event near the North Pole. The natural gas market has fluctuated as violently as this weather feature (EPO) index has. Cold periods are associated with a negative EPO and blocks over Alaska and the western Arctic that can force the Polar Vortex south. A positive EPO is the opposite (warm)
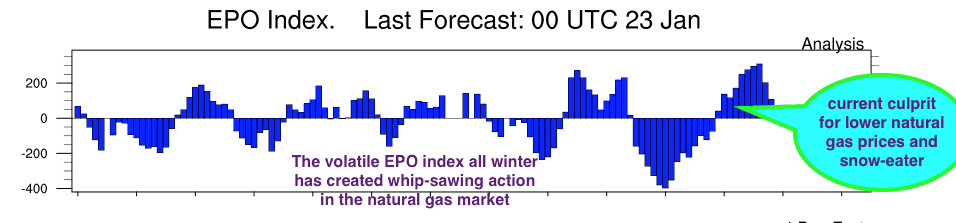
SOURCE ABOVE–Earth System Research Lab. NOAA
This Year’s January Thaw has been incredible. Some feel that thaw has to do to changes in the earth’s orbit around the Earth, but I have found little scientific research to support this this. If the EPO index goes more consistently negative, this would bring about more Midwestern and Eastern snows and cold weather by the middle part of February. Jim Roemer
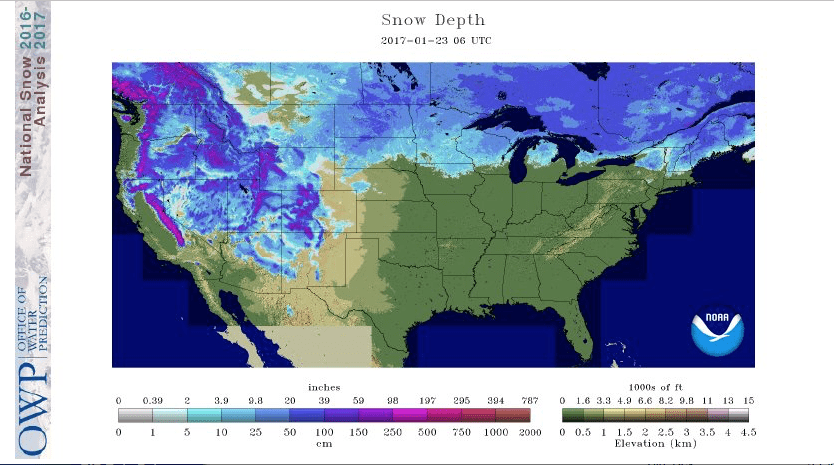
Snow Cover (above) has greatly shrunk since early December (over the Midwest and East), helping to reduce the effects of any cold out breaks out of Canada. That could change as we head deeper into winter with some colder outbreaks. One can see the incredible snows out west and the best skiing in many years.
Farmer’s Almanac- January Thaw
“The January Thaw, like Indian Summer, is more than just another piece of fanciful weather lore. Annual averages really do show a slight temperature increase, and subsequent dip, during the final week of January. On average, January 23 is the coldest day of the year in much of the Northern Hemisphere
Almost exactly six months later sits July 24, the warmest day of the year, on average. Between those two dates, average daily temperatures show a fairly predictable rate of increase. While there may be deviations from that pattern during any given year, the model holds true when looked at over a period of several years.
Though predictable, the climb from cold weather to warm and back again, is not completely smooth. Small “blips” in the overall pattern reveal noticeable fluctuations that can be observed from year to year. These blips are called singularities in weather lingo. Indian Summer, a period of unseasonably warm weather that usually appears in mid-October, is one such blip. The January Thaw is another.
During the January Thaw, which usually lasts for about a week, temperatures rise an average of 10° F higher than the previous week, then drop back down in time for February’s arrival. Though it’s called a “thaw,” the January Thaw doesn’t necessarily melt away snow and ice during its stay. In areas where winter weather is exceptionally cold, temperatures during the thaw may not even rise above freezing. More temperate regions, however, may even experience what could be described as a “false spring.”
Though they are a verified weather phenomenon, January Thaws don’t happen every year. In order for a singularity like the January Thaw to be recognized, it only has to appear slightly more than 50 percent of the time.”
According to Wikipedia- January Thaw
“The January thaw is believed to be a weather singularity. A possible physical mechanism for such phenomena was offered in the 1950s by E.G. Bowen: he suggested that some “calendaricities” (as he called them) might be explicable in terms of meteoric particles from cometary orbits acting as ice nuclei in terrestrial clouds; this theory then received some support from several sources.However, Bowen’s ideas later fell out of favor with the development of atmospheric dynamic modeling techniques, although one of his rainfall peaks does seem to correspond with the date of the January thaw. Data analysis has not found statistically significant support for the supposed January thaw.


