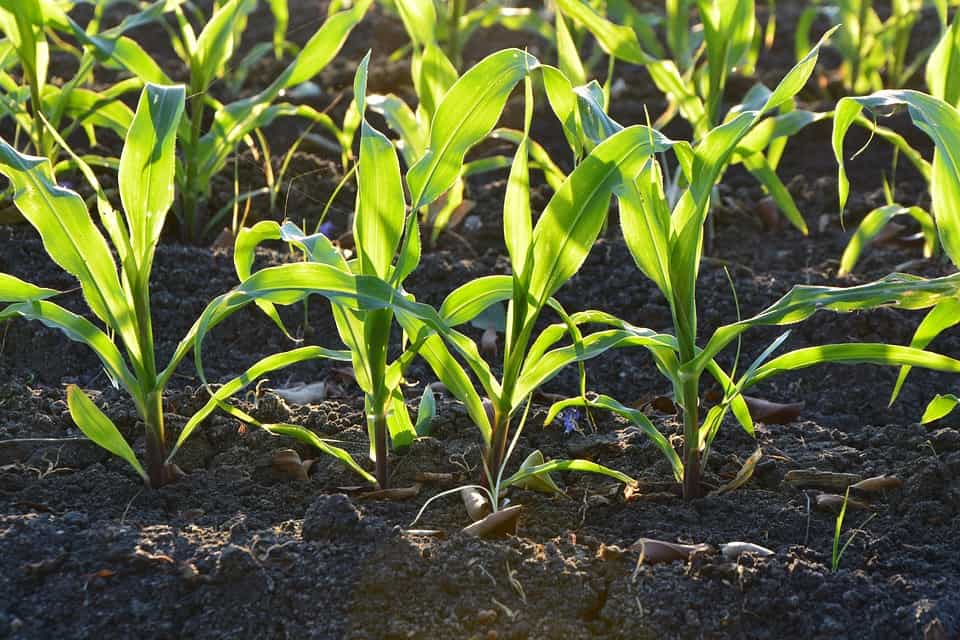
The United States Department of Agriculture released their first crop condition report for corn. It showed that 57% of the crop is rated good and 8% is rated excellent. The above normal rainfall that has fallen has prevented better conditions from materializing. A total of 65% good to excellent is on the lower end compared to the past few decades (bottom tercile).
Crop Conditions and Yields
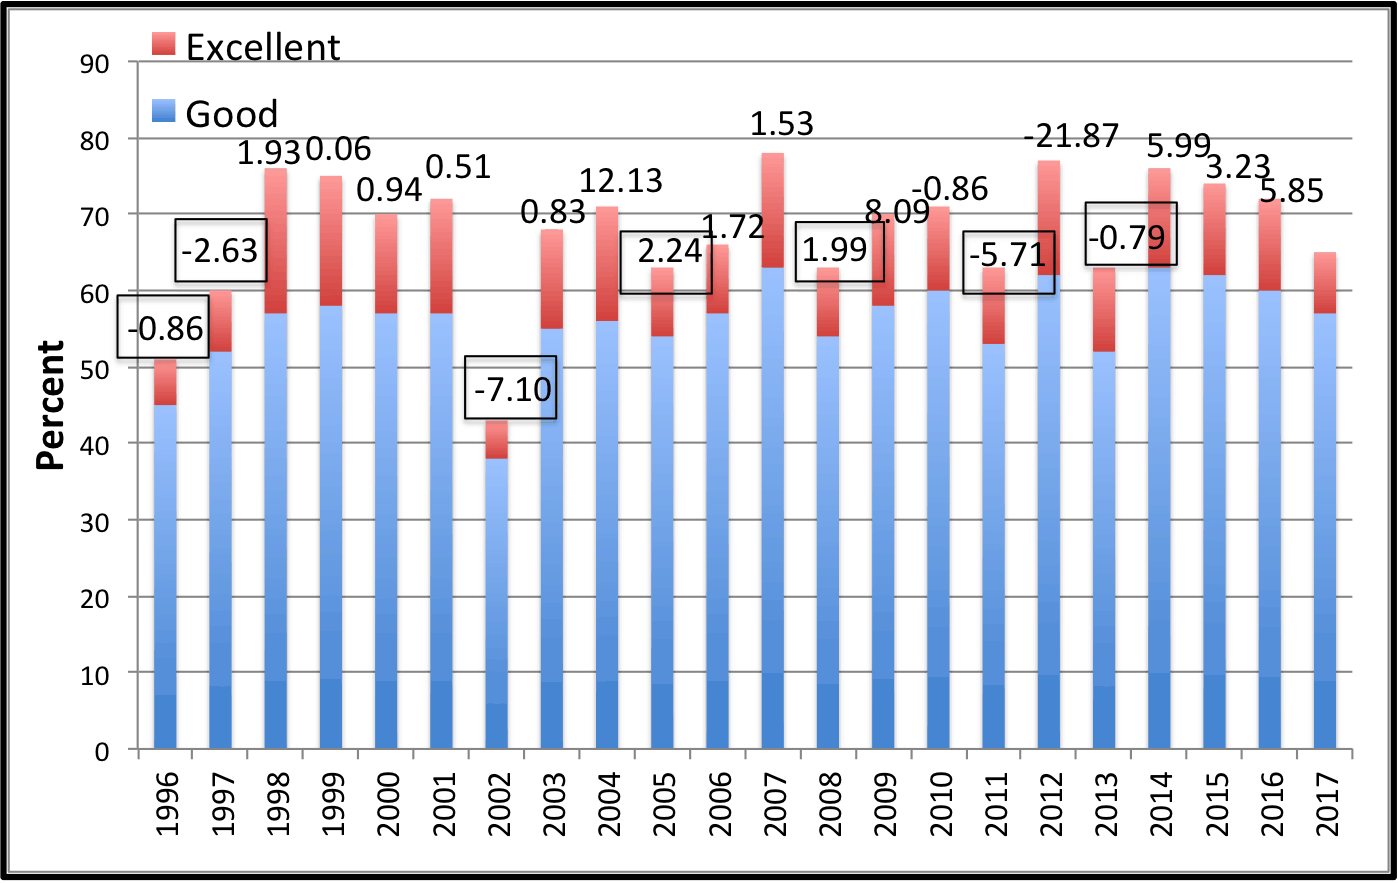
So how important is this initial crop condition rating? We took a look at how U.S. yields fared when initial crop conditions were below normal. The chart below shows the percent of crop good to excellent in the first report (most of the years, it was released in the last week of May). The black numbers on top of each year indicate the yield departure (%) from trend.
Historically, 7 out of 21 (33%) years had yields below trend (negative numerical values). However, lets isolate that percentage down to include the crop conditions. There were 7 years that had corn conditions at 65% G/E or below (not identical to the 7 below normal yield years). Of those 7 years, 5 of them had yield departures below trend, thus increasing the current chance of below normal years to 71%. Although it may be a decent indicator, it is not foolproof. Despite having great conditions to start the year, the worst yield departure year in this range is 2012.
On top of the poor conditions, the report also mentioned that only 91% of corn had been planted. This compares to the 93% average for the 2011-2016 period. Corn needs to be planted soon or farmers will not be able to purchase crop insurance.
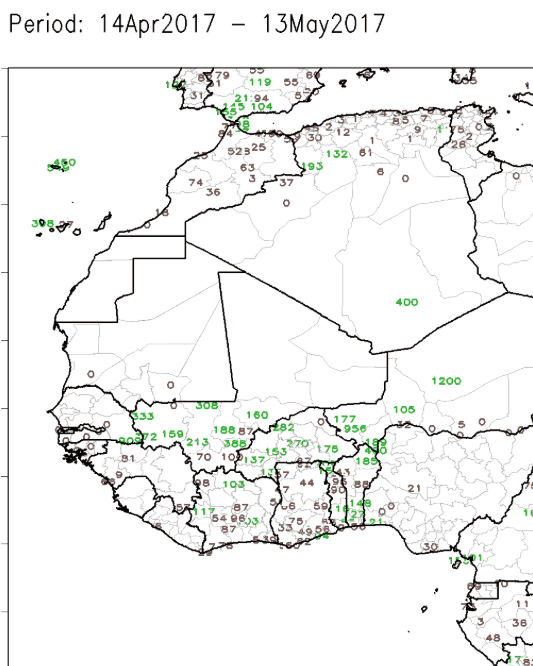
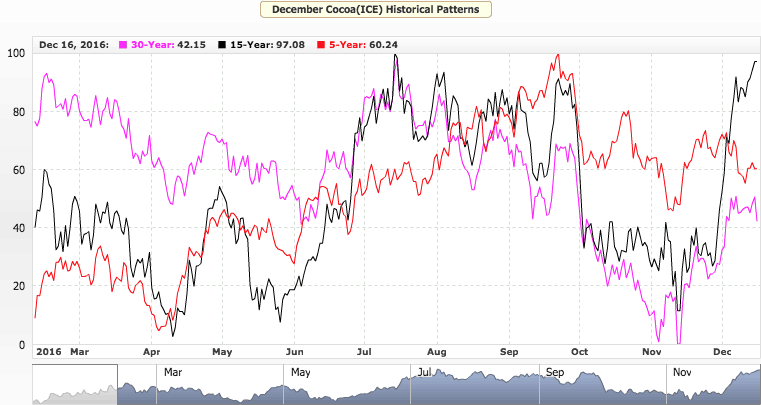
We mentioned to clients a few weeks ago that a heavy short position in the cocoa market, combined with potential “psychological concerns” over a developing El Nino, has probably meant a bottom was in for the cocoa market (at least for now). Political unrest in west Africa combined with areas of dryness (red on map, below) in parts of Ivory Coast and Ghana are reasons for this short covering rally? Will this continue? Subscribers to our newsletter will find out the answer in the months ahead (https://www.bestweatherinc.com/climatelligence/).
Political unrest in Ivory Coast is also helping this market, but usually a reaction in cocoa is over-done with regard to political issues.
In the meantime, heavy rains have hit parts of Nigeria and Cameroon, in which transportation has been stalled for days due to muddy roads.
Combine all of this factors, and we have seen nearly a 10% rally in cocoa the last couple weeks. The Key Point right now is, that it is probably a bit late to jump on board going long cocoa, until more is known about El Nino (or not) and what summer through winter weather will be.
RAINFALL (ABOVE) THE LAST MONTH IN WEST AFRICA—TOO DRY IN PARTS OF IVORY COAST AND GHANA NEEDS TO BE WATCHED. THIS IS NOT A BIG FACTOR IN LOWERING PRODUCTION YET, BUT HEAVY RAINS IN NIGERIA AND CAMEROON IS AFFECTING TRANSPORTATION OF BEANS
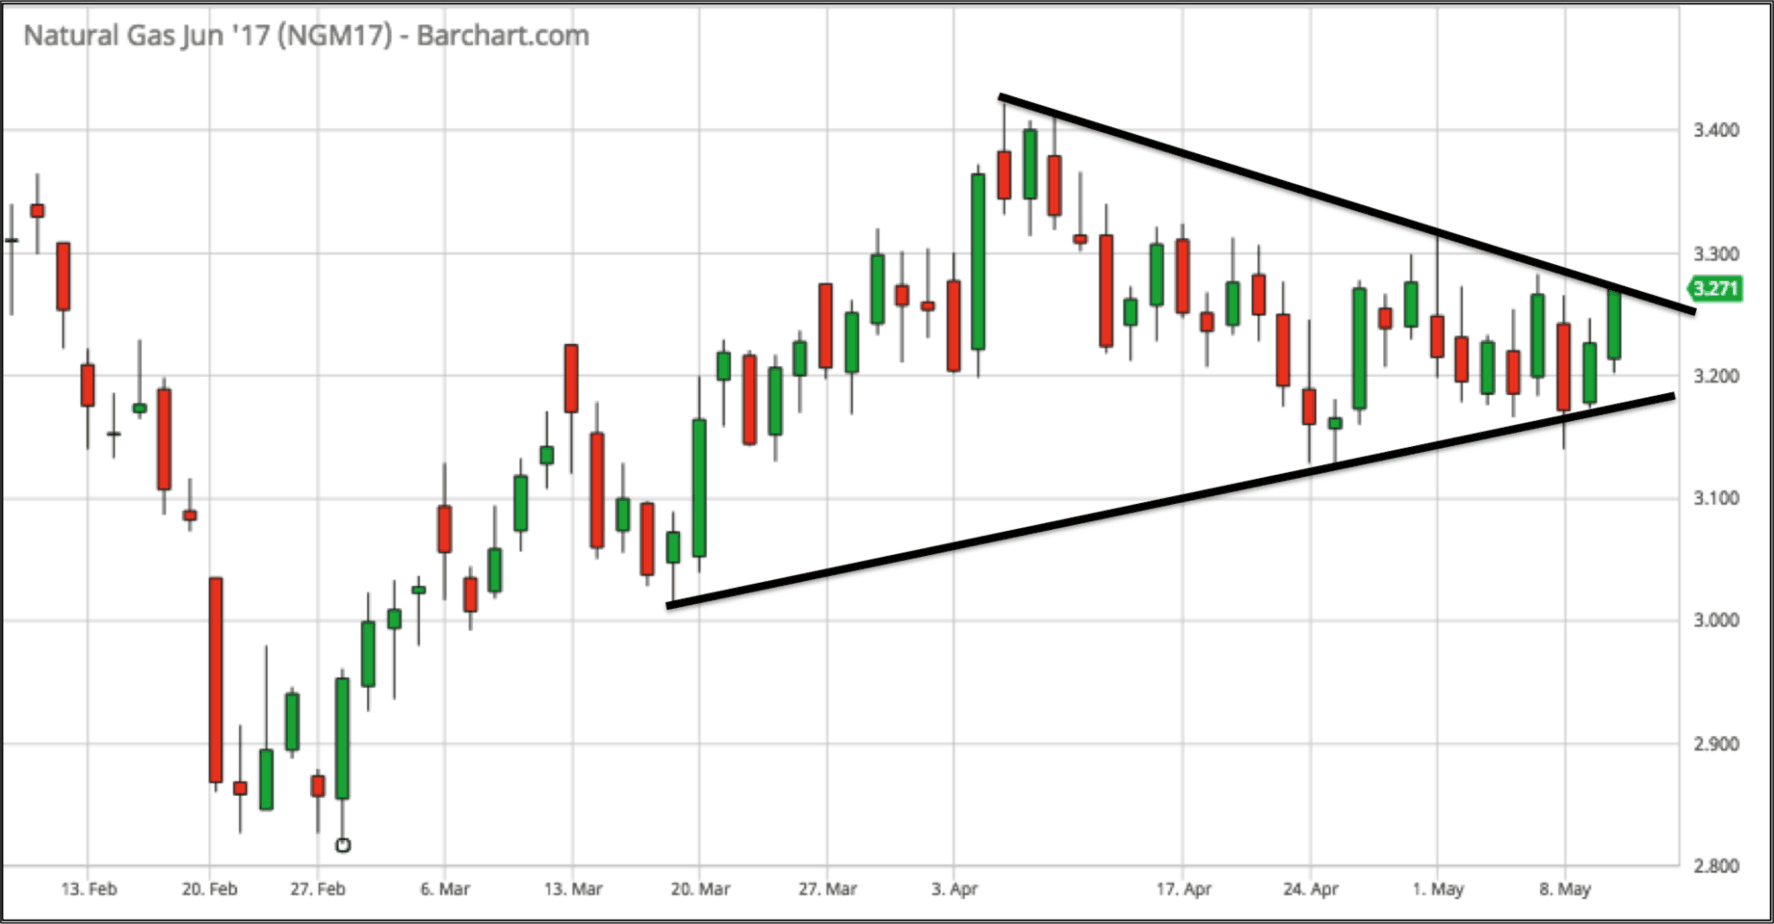
What do the current fundamentals say about natural gas? First of all, June contract prices edged above the top of a classic “symmetrical triangle” chart pattern. Prices chopped around in a tight range since the beginning of April. Volatility left the market as winter ended and weekly EIA withdrawal numbers became injection numbers. Currently, the market is worried about colder temperatures last week that may limit the injection release for tomorrow. However, May is typically a shoulder month for natural gas demand, preventing weather from being a major factor.
SOURCE: BARCHART.COM
Big Picture Fundamentals
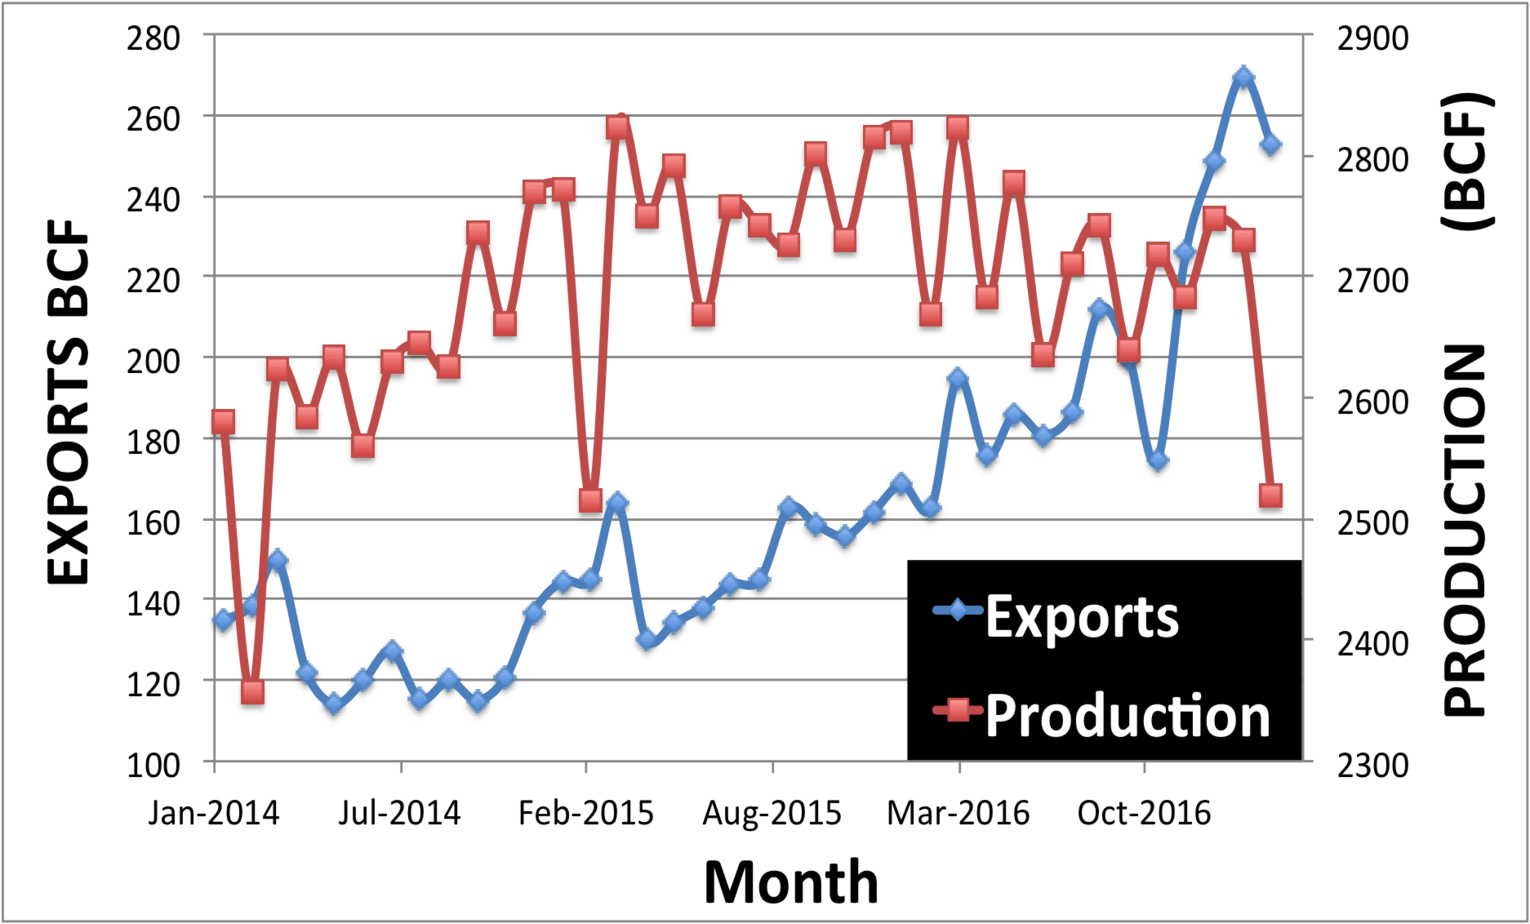
On top of the worry of a hot summer, other fundamentals are supporting natural gas prices. Monthly exports have risen over 50% from a year ago. International demand is expected to continue to rise. This recent uptick in exports is displayed in the chart below (Jan 14′ – Feb 17′). Notice, also, that production has steadied and even slightly declined over the past 15 months. The tight supply/demand situation (not including the potential impact from weather) has investors watching intently.
SOURCE: EIA
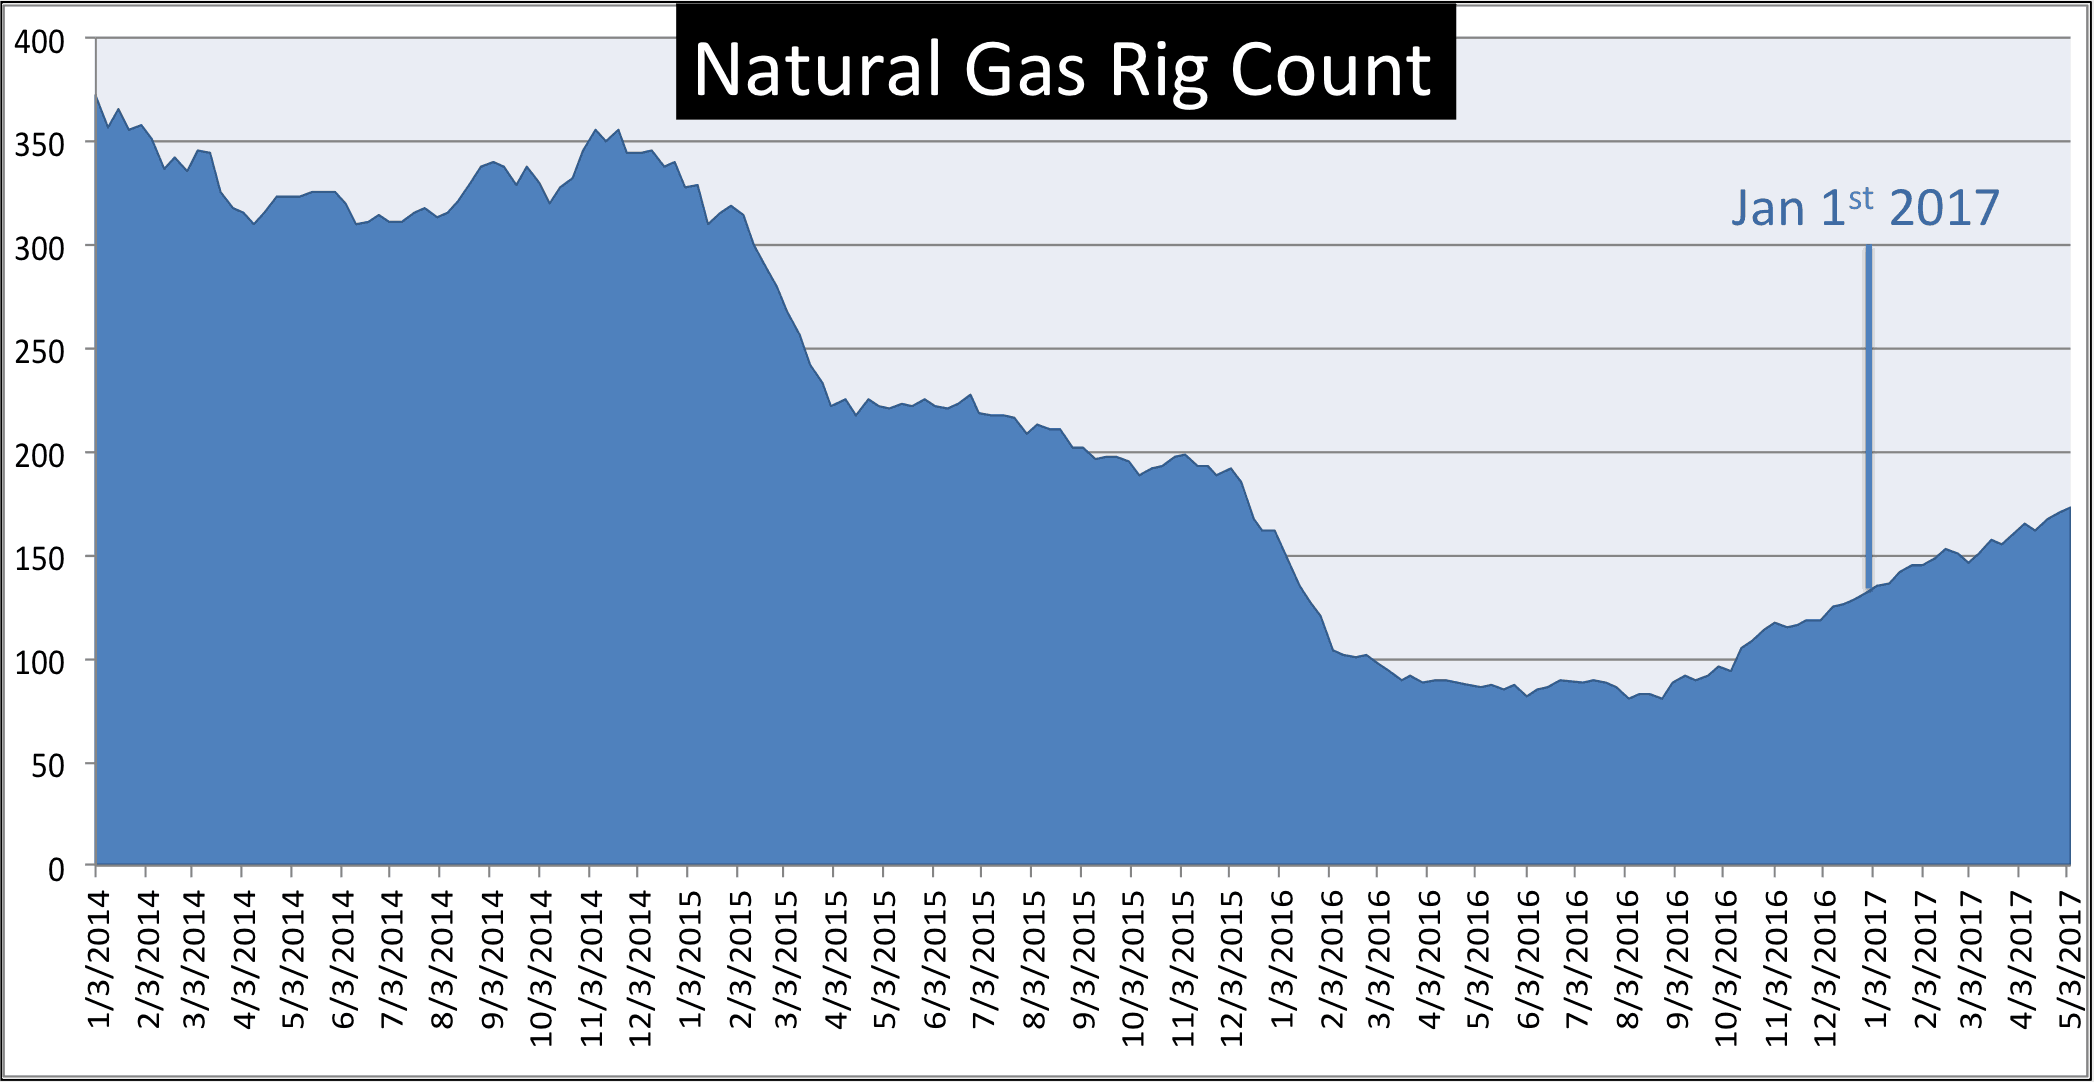
Another sign of the potential for higher prices is the steady increase in national natural gas rig count. The number of rigs bottomed around the same time natural gas prices did (March 2016). More rigs may indicate that natural gas companies are anticipating greater demand, and the possibility of profit from higher prices.
SOURCE: EIA
For our exclusive summer temperature forecast, sign up for our free newsletter here.
A deluge of weather issues plagued Kansas wheat areas over the weekend. Consequently, a three pronged threat (that Jim gave a heads up to his clients on) may lead to a decrease in crop quality. The major short position in the market means a lot of investors are taking a hit with today’s rally.
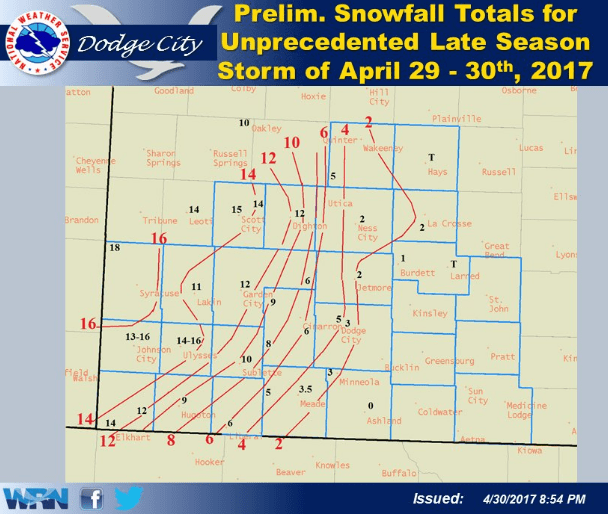
Snowfall
For the western half of Kansas, up to a foot of snow fell. Due to warmer temperatures, it was heavy wet snow that fell, rather than fluffy powder. This is important because wind and snow can knock heads off the plant, limiting its yield.
SOURCE:NOAA
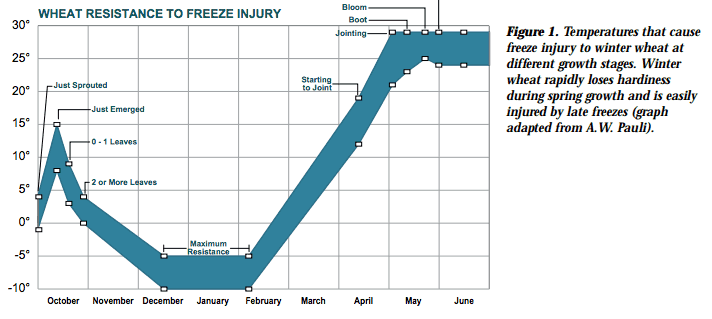
Late Spring Shiver for Wheat
Wheat can survive freezing temperatures during the winter, while the crop is dormant. However, the crop came out of dormancy early this year because of the warm temperatures in March and April. In Kansas, 25% of the crop currently headed. This portion is most vulnerable to freeze damage, with injury typically occurring at 30F. Less developed wheat is more resilient to cold conditions, with damage occurring at 15F-25F. Check out this informative graphic from Kansas State University regarding temperatures and potential injury.
SOURCE: Kansas State University
Flooding
For those that were spared snow and cold, their consolation prize was abnormally heavy rainfall. Rainfall totals ranged 1″ to +4″ in eastern Kansas and Missouri. Flooded soils can deplete the developing plant of oxygen. However, wheat usually can survive one or two days of flooding. Severe storms, included several tornados, tore through the midwest and South. See the video below:
SOURCE:AP
Jim’s comment and market view of this unique weather impact on futures prices is only provided to subscribers and private clients.
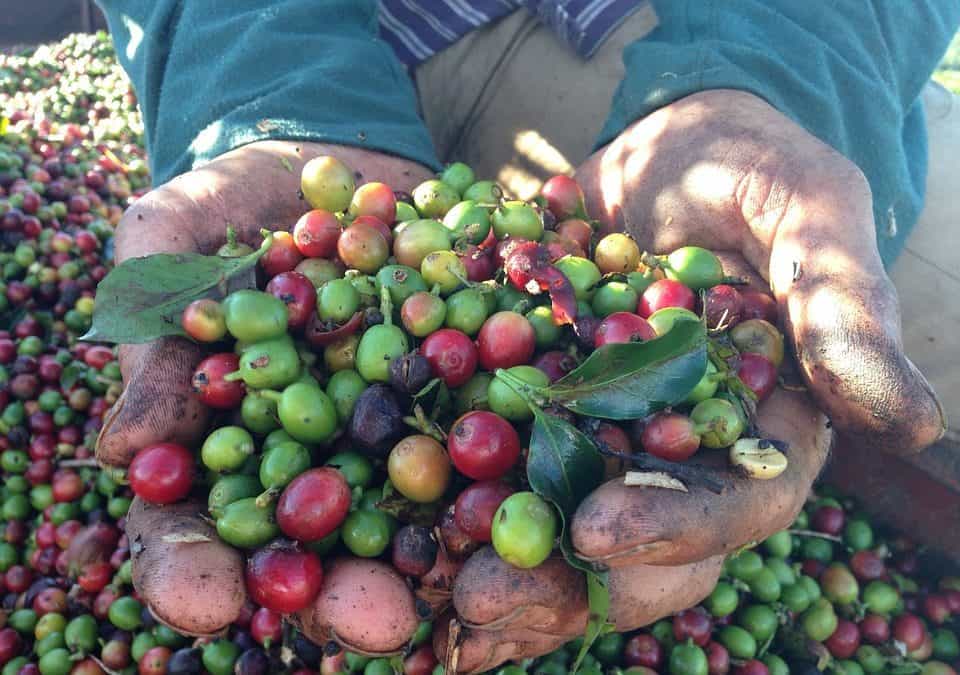
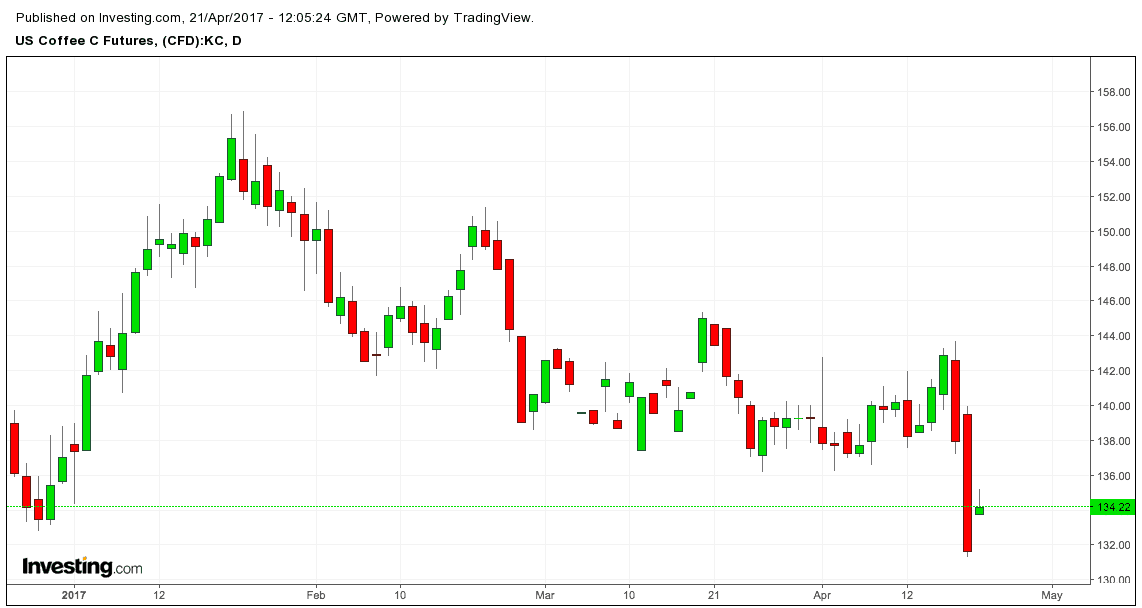
Coffee futures took a nose dive and dropped 8% in the past two days. The new unicorn frappuccino is not to blame. Instead, it is the Brazil harvest that is pressuring the market. This year, it will add to the global supply, despite being an “off-year” for the crop there. The trees have a natural cycle that typically leads to higher production every other year. This year, production is expected to fall over 15% in Brazil from last year. But given no urgent supply issues, traders are looking ahead and anticipating a massive Brazil crop in 2018. See price chart below:
This move coincides with a seasonal move seen in most years. The Brazil harvest typically pressures the market even during off years. As a result, farmers process and sell more coffee beans, decreasing the global price. Commercial sellers of coffee potentially hedge their risk by selling coffee futures to lock in their price.
Continuing the Downtrend
Prices slid down ever since the dryness in Minas Gerias was limited by decent rains in late January. A stronger La Nina would have led to higher chance of drought for some of the southern growing areas. Colombia (worlds 3rd biggest produce) coffee areas were also spared most of the extreme flooding sometimes observed in La Nina years.
Jim says “It will take a Brazil freeze scare in the next few months (Brazil’s winter) to take us out of the doldrums.” He has been bearish most commodities as he mentioned in his interview in Bloomberg. Watch it here: https://www.bestweatherinc.com/on-air/jim-roemer-bloomberg-tv-31417/
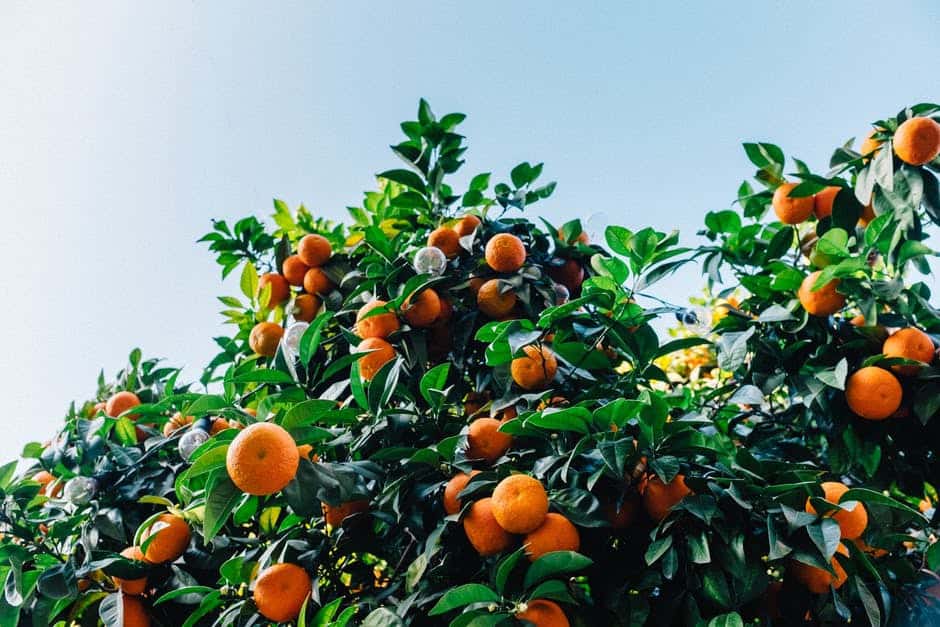
Last year at this time, frozen OJ futures were at the beginning of a 7-month rally. Global production had continued to declined since citrus greening and citrus canker have been ravaging crops in Brazil and Florida. The only way to treat infected trees is to remove them and others within a 1 mile radius. Therefore, global acreage has dropped. Hurricane Matthew and Hermine also provided a speculative boost in prices last year, due to worries of storm damage.
OJ Price Reversal
Now it appears that the nonexistent demand is the dominating feature in the market. Orange juice consumption has decreased in 14 of the last 15 years. Other beverages have taken orange juice’s place in American homes. This is similar to the decline in soda consumption, as people stray from sugary drinks.
Moving Forward
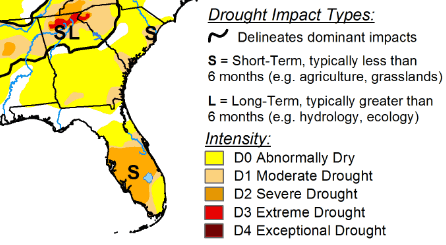
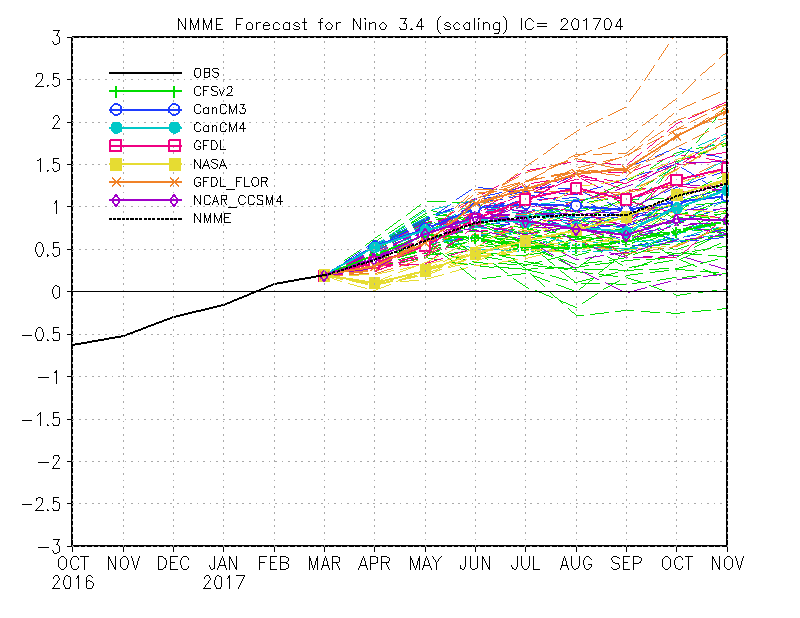
Rainfall in Florida over the next couple months is very important. Drought conditions are currently present. See the drought monitor below: If an El Nino develops, this typically leads to above normal rainfall. Most models forecast continued Nino 3.4 warming. Crop damage by hurricanes are always a concern for the summer and fall. But El Nino conditions cause increased shear, that shred tropical systems and hinder hurricane formation. A significant drought or damage from hurricanes would be necessary to really shake the market from its current low demand/low supply see saw.
HELPING YOU MAKE THE BEST INVESTMENT DECISIONS BASED ON THE WEATHER
We use cookies to ensure that we give you the best experience on our website. If you continue to use this site we will assume that you are happy with it.OkPrivacy policy