

This huge January thaw has helped to pressure the natural gas market again and has been one factor in the weakness of the heating oil complex. The volatile EPO index (Eastern Pacific Oscillation Index) has to do with blocks close to and north of Alaska that can sometimes bring down the polar vortex. This will be the key over the next 6 weeks to the mid and end of winter and whether the eastern U.S. sees some improved snow for ski resorts. This feature may also play a role in disturbing the polar vortex enough to send it south during parts of February and March. If so, natural gas prices will bottom. One can see below the volatile up and down motion of the EPO index all winter influence by a combination of a fluctuating weak La Nina (that is now pretty much gone); changes in Pacific Ocean temperatures and lack of consistent stratospheric warming event near the North Pole. The natural gas market has fluctuated as violently as this weather feature (EPO) index has. Cold periods are associated with a negative EPO and blocks over Alaska and the western Arctic that can force the Polar Vortex south. A positive EPO is the opposite (warm)
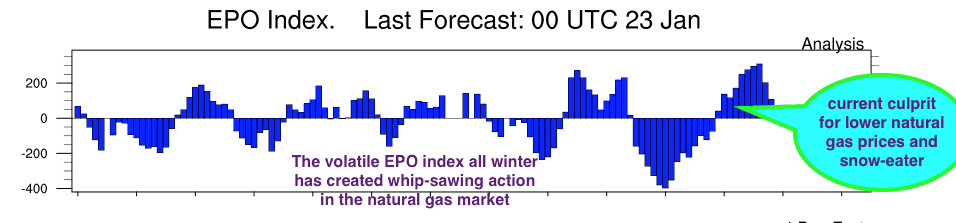
SOURCE ABOVE–Earth System Research Lab. NOAA
This Year’s January Thaw has been incredible. Some feel that thaw has to do to changes in the earth’s orbit around the Earth, but I have found little scientific research to support this this. If the EPO index goes more consistently negative, this would bring about more Midwestern and Eastern snows and cold weather by the middle part of February. Jim Roemer
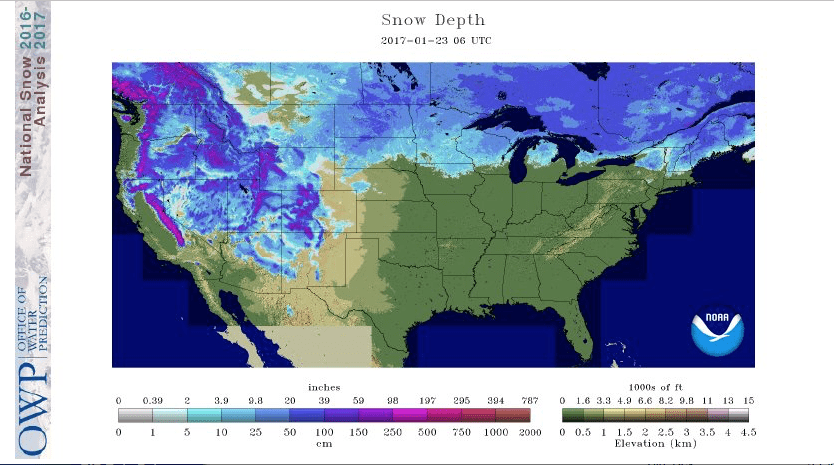
Snow Cover (above) has greatly shrunk since early December (over the Midwest and East), helping to reduce the effects of any cold out breaks out of Canada. That could change as we head deeper into winter with some colder outbreaks. One can see the incredible snows out west and the best skiing in many years.
Farmer’s Almanac- January Thaw
“The January Thaw, like Indian Summer, is more than just another piece of fanciful weather lore. Annual averages really do show a slight temperature increase, and subsequent dip, during the final week of January. On average, January 23 is the coldest day of the year in much of the Northern Hemisphere
Almost exactly six months later sits July 24, the warmest day of the year, on average. Between those two dates, average daily temperatures show a fairly predictable rate of increase. While there may be deviations from that pattern during any given year, the model holds true when looked at over a period of several years.
Though predictable, the climb from cold weather to warm and back again, is not completely smooth. Small “blips” in the overall pattern reveal noticeable fluctuations that can be observed from year to year. These blips are called singularities in weather lingo. Indian Summer, a period of unseasonably warm weather that usually appears in mid-October, is one such blip. The January Thaw is another.
During the January Thaw, which usually lasts for about a week, temperatures rise an average of 10° F higher than the previous week, then drop back down in time for February’s arrival. Though it’s called a “thaw,” the January Thaw doesn’t necessarily melt away snow and ice during its stay. In areas where winter weather is exceptionally cold, temperatures during the thaw may not even rise above freezing. More temperate regions, however, may even experience what could be described as a “false spring.”
Though they are a verified weather phenomenon, January Thaws don’t happen every year. In order for a singularity like the January Thaw to be recognized, it only has to appear slightly more than 50 percent of the time.”
According to Wikipedia- January Thaw
“The January thaw is believed to be a weather singularity. A possible physical mechanism for such phenomena was offered in the 1950s by E.G. Bowen: he suggested that some “calendaricities” (as he called them) might be explicable in terms of meteoric particles from cometary orbits acting as ice nuclei in terrestrial clouds; this theory then received some support from several sources.However, Bowen’s ideas later fell out of favor with the development of atmospheric dynamic modeling techniques, although one of his rainfall peaks does seem to correspond with the date of the January thaw. Data analysis has not found statistically significant support for the supposed January thaw.
