Temperature data for 2016 shows it is likely to have edged ahead of 2015 as the world’s warmest year.
Data from Nasa and the UK Met Office shows temperatures were about 0.07 degrees Celsius above the 2015 mark.
Although the Met Office increase was within the margin of error, Nasa says that 2016 was the third year in a row to break the record.
The El Niño weather phenomenon played a role, say scientists, but the main factor was human emissions of CO2.
The latest conclusions won’t come as a much of a shock to observers, as the likely outcome was trailed heavily towards the end of last year.
What is climate change?
So warm was the early part of 2016 – influenced by a powerful El Niño – that some leading climate scientists were predicting as early as May that a new record was probable.
During an El Niño, a band of unusually warm ocean water develops in parts of the Pacific. The phenomenon affects the climate globally, disrupting weather patterns.
According to Nasa figures, 2016 is now the warmest year in a record that dates back to 1880.
“2015 has been the warmest year on record up until now, so 2016 has just beaten that and and it’s beaten that by about 0.1-0.12 of a degree Celsius, which doesn’t seem like a lot, but in terms of the year-to-year variations it’s actually huge,” Dr Gavin Schmidt from Nasa told BBC News.
“This is a very clear record that we’re seeing. It is driven mainly by changes in the tropical Pacific where we had an El Niño event that produced a lot of warmth. But we’ve also seen long-term trends in warming mostly due to the increasing greenhouse gases.”
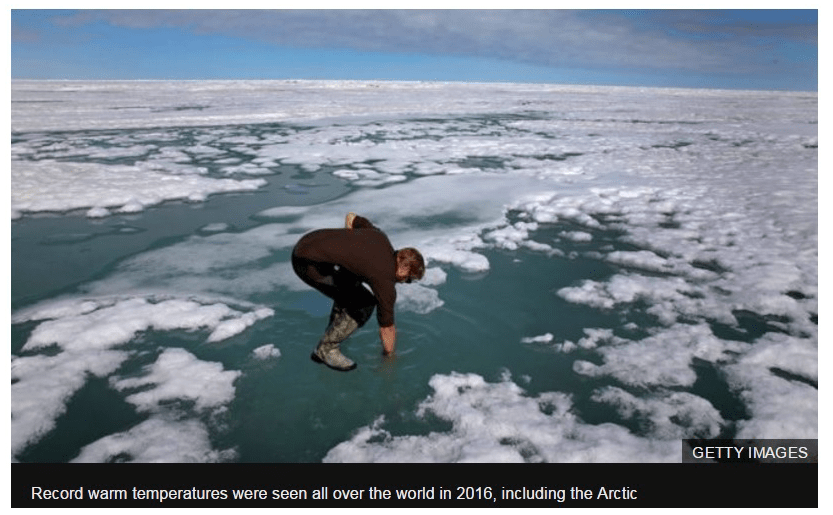
Another factor that has affected temperatures in 2016 is the unusual warmth in the Arctic.
The sea-ice covering the Arctic reached its second lowest level (in terms of extent) in September 2016. The sea-ice grows in autumn and winter and shrinks each spring and summer.
While the sea-ice extent last year didn’t break the record, the mercury stayed high and the smaller amount of ice now present in the region is at unprecedented levels for the time of year.
A number of meteorological agencies from around the world all released their figures on Wednesday. They all suggest that warming in 2016 was a record that had an important contribution from El Niño.
The Met Office says it contributed about 0.2C to the annual average for 2016. However, researchers believe that while this is substantial, it is not the whole story.
“We understand the contribution El Niño makes fairly well and we’ve seen it many times,” said Prof Ellie Highwood from the University of Reading.
“But even if you take that contribution away, we would expect 2015 and 2016 to still be the warmest years we’ve seen, so a majority of it is coming from global warming and the greenhouse effect.”
The World Meteorological Organization (WMO), which pulls together temperature data from a number of sources, agrees that 2016 broke the record by 0.07C.
Not all of the reports on temperature data in 2016 are clear that the warmest-year record has been broken. Century dominated by records
The Met Office says that 2016 was 0.77 above the long-term rate, but with a plus or minus error margin of 0.1C, meaning that last year was at the very least, one of the two warmest years on record.
“The final figures confirm that 2016 was yet another extremely warm year,” said Peter Stott from the Met Office.
“The temperature for last year was very close to the year before, temperatures for 2016 exceeding those for 2015 by a small margin.”
Regardless of the small margins, when the new data on 2016 is included, 15 of the warmest 16 years on record have now occurred since 2001.
According to Noaa (the US National Oceanic and Atmospheric Administration), the only year from the 20th Century to break into the top 16 is 1998, and which ranks seventh warmest.
This prolonged period of warming was having significant impacts around the world.
“We have also broken sea-ice minimum records in the Arctic and Antarctic,” said Petteri Taalas from the WMO.
“The Arctic is warming twice as fast as the global average. The persistent loss of sea-ice is driving weather, climate and ocean circulation patterns in other parts of the world. We also have to pay attention to the potential release of methane from melting permafrost,” he said.
Of great concern to scientists and politicians is the fact that the newly published temperature data shows the Earth is once again more than one degree warmer than pre-industrial times, and edging closer to the threshold of 1.5C set under the Paris climate pact.
With the Trump administration about to take office in the US, there are concerns that political support for climate action might fade. This would be a big mistake according to scientists. “Climate change is one of the great challenges of the 21st Century and shows no signs of slowing down,” said Prof Mark Maslin, from University College London.
“The decarbonisation of the global economy is the ultimate goal to prevent the worst effects of climate change. The hottest year on record is such a clear warning siren that even President-elect Trump cannot ignore it.”
Researchers say that 2017 is unlikely to break the warming record but will be in the top five hottest years.
In one of the most Jekyll and Hyde weather patterns in recent memory, much of the country will go from near record warmth next week to potentially very stormy and colder weather towards the end of January and first week of February. The pattern may continue to oscillate back and forth, with higher confidence that March will be quite cold. This is because of low sea ice helping to cause the polar vortex aloft to strengthen and once we head towards spring, this system will be displaced to the South. This could improve snowfall for many eastern ski areas before or by spring.
For now, after melting snow and more mediocre ski conditions in the East, I look for the NAO index to go negative later in January and for the potential for an important east coast snowstorm possible sometime around or after January 27th.
Each pattern change the last 6 weeks has been brought on by some feature entirely different than the previous. In the case coming up for later January, the MJO, stratospheric warming (see blog on January 10th below), plus what we call a retrogressive wave pattern, will open the door for yet another, colder pattern change. However, the way this pattern has been all winter long, I would expect that warmer risks will occur again later, making any major rally in natural gas prices the next few weeks unlikely. Computer models cannot be trusted this year.
The global atmospheric angular momentum (GLAAM) index is simply the total rotation of the atmosphere compared to the Earth’s surface. Typically, El Nino years lead to positive GLAAM values and La Nina years lead to negative GLAAM values. When you have both in phase, El Nino and La Nina weather patterns are amplified. However, we currently have + GLAAM and a weak La Nina Modoki (west-based La Nina).
This is an odd occurrence, with the atmosphere “acting like” an El Nino, and sea surface temperatures indicating a La Nina. We believe this is one of the reasons contributing to the tough winter forecast this year, as well as the constant pattern shifts. However, more than a week ago, we began telling clients that this January could end up being a warm one nationally and natural gas withdrawals would decrease.
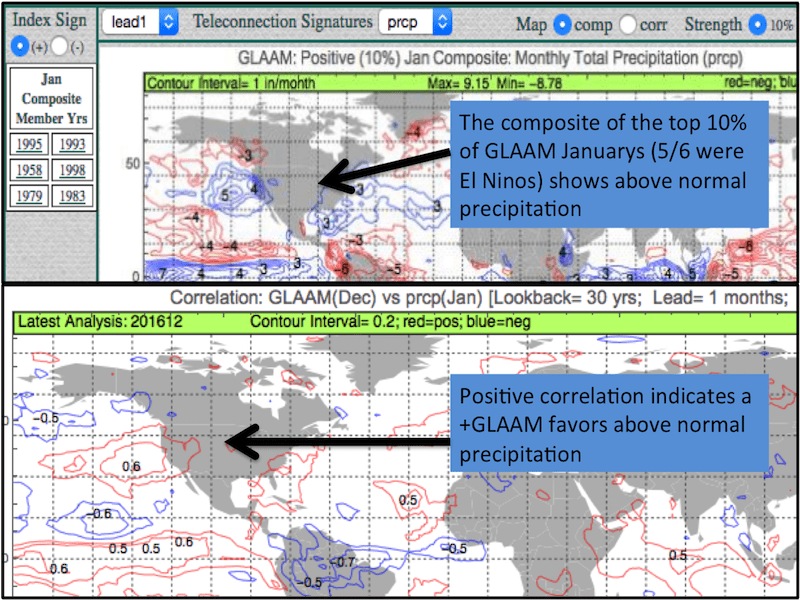
A +GLAAM also favors the record, damaging rains we’ve seen in California and Nevada over the past week. With +GLAAM in January, Climatech composites and correlations accurately predicted this wet weather pattern. Emergency managers are ‘all hands on deck’ in the valleys with flooding roadways and dangerous mudslides: https://www.youtube.com/watch?v=i26_tWxSCLA All the while, snow lovers are chomping at the bit to ski/snowboard near record mountain snows. Mammoth mountain received 82” over just the past 10 days!
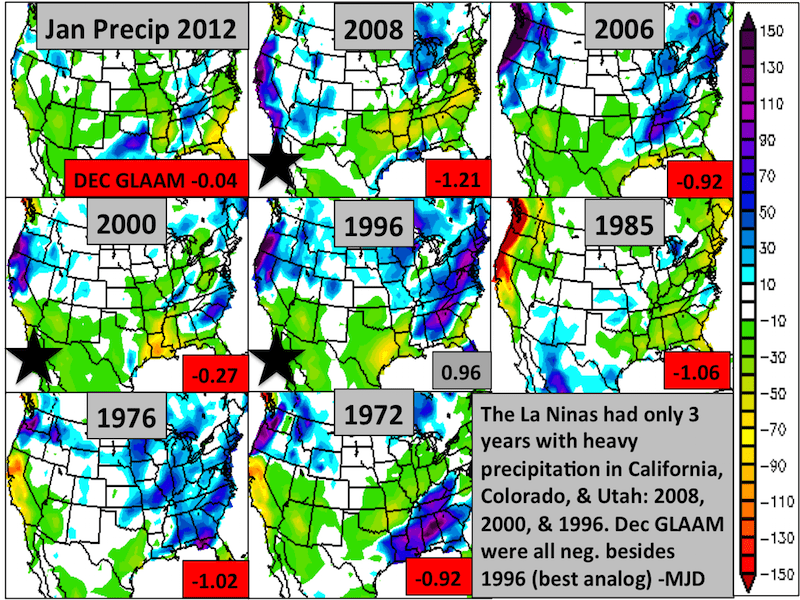
Shown below are the composites (blue indicates above normal precipitation) and correlations (red indicates a positive relationship) from Climatech. Notice most years with a +GLAAM were El Nino years, unlike this year.
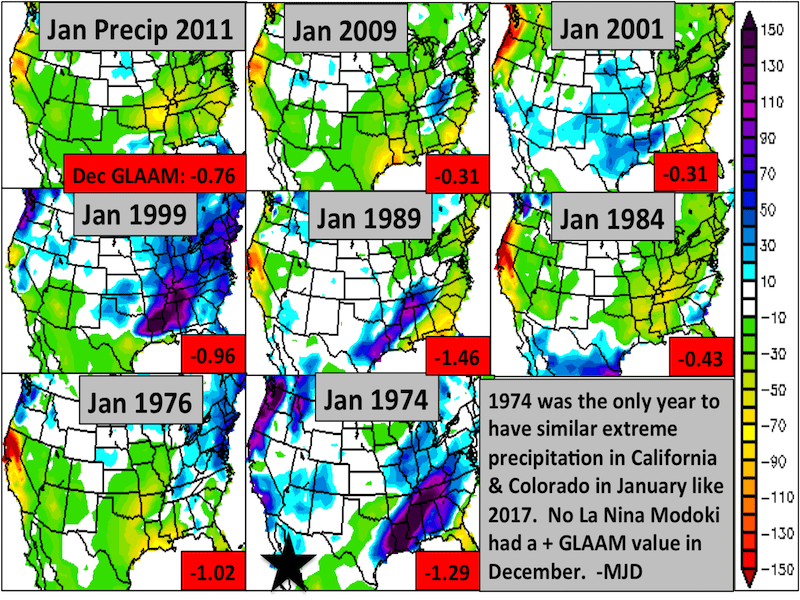
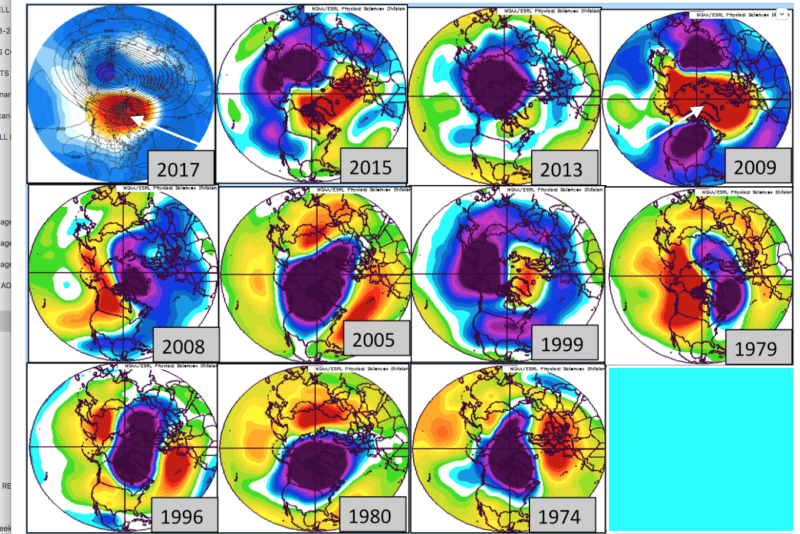
The question is, can we use these conditions to find good analog years? Meteorologists use analogs to forecast future weather. The theory is that similar initial conditions (e.g. strong pacific jet) or boundary conditions (e.g. sea ice extent, snow cover) will lead to similar conditions down the road. Only 4 La Nina years had similar rain/snow in January: 2008, 2000, 1996, & 1974, with 1974 being the only La Nina Modoki. 1996 was the only La Nina year which had a +GLAAM in December.
The images below show January precipitation patterns during La Nina and La Nina Modoki years. December GLAAM values are also shown.
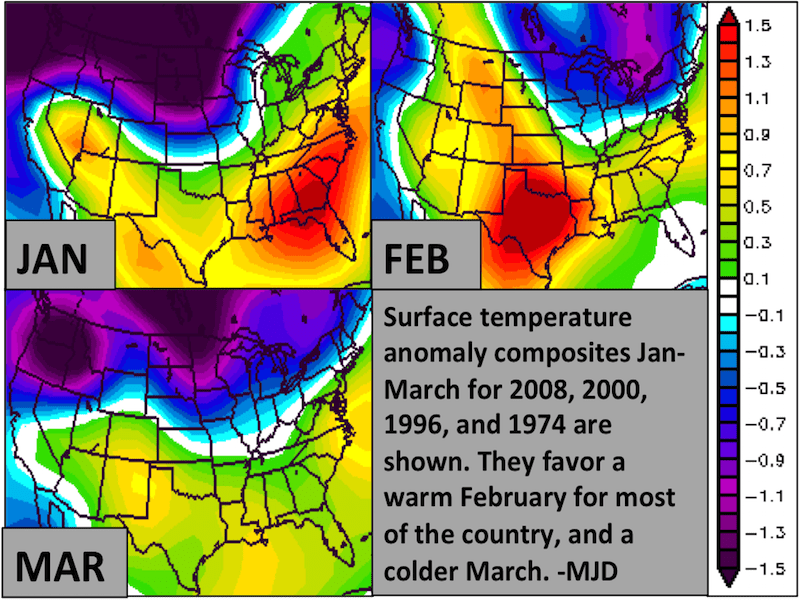
The analogs below are based on +GLAAM, a weak La Nina and huge snows out west have some colder risks, later this winter in the North and East. However, a warmer Atlantic and a lack of snow cover may mean warmer risks at first.
Although not perfect (January will end up warmer), these analogs somewhat agree with the forecast we have given our clients. This is a decent example of how analogs can be used in energy and agriculture weather forecasting, making Climatech an invaluable tool. In 3 of these 4 years, U.S. natural gas areas turned quite cold later in February and March, but odds remain high for warm weather until at least early February.
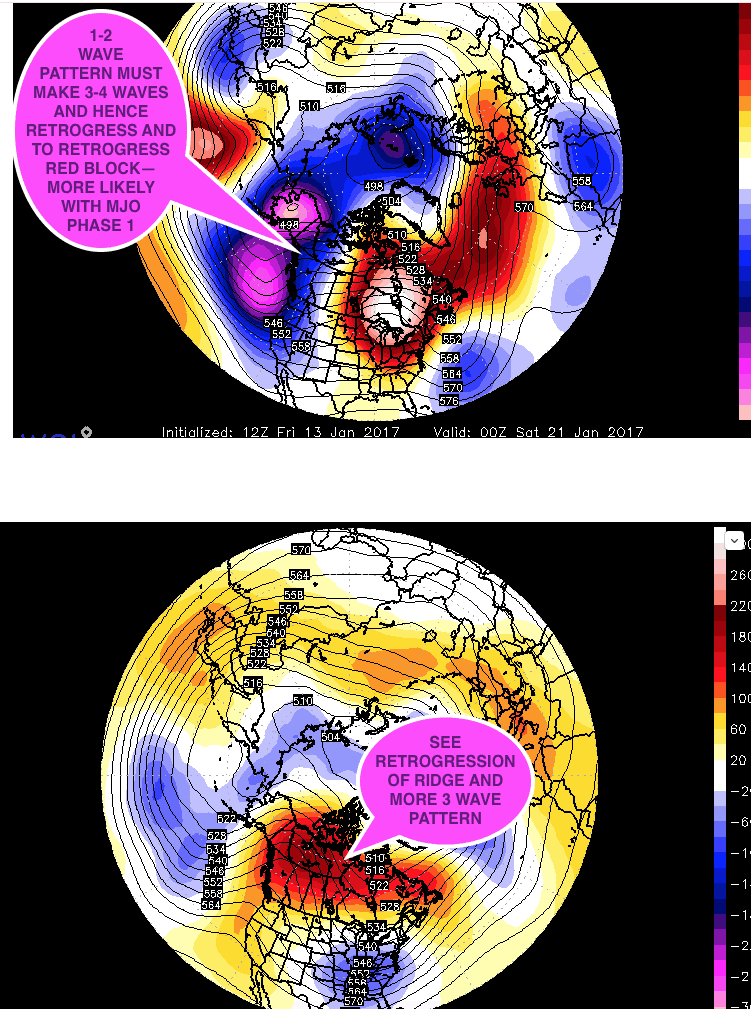
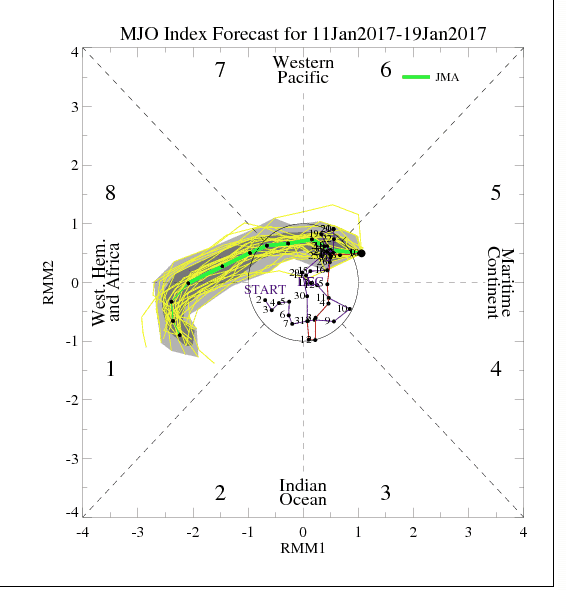
In one of the most complex, volatile U.S. weather patterns for natural gas prices in years, record warm weather and melting snows these next 10 days will be followed by yet some more changes. The Madden-Julian Oscillation (MJO) is the major fluctuation in tropical weather on weekly to monthly timescales. The MJO can be characterized as an eastward moving ‘pulse’ of cloud and rainfall near the equator that typically recurs every 30 to 60 days. It can sometimes change weather thousands of miles away around the globe.
We can see that it is forecasted to be in phase 1 in the next week or so that may result in a very stormy weather pattern coast to coast with potential snow events again in the Midwest and/or deep south or east, as we head later in January and February.
The second map towards the bottom of the page illustrates what may be the first stratospheric warming event in weeks south of the North Pole. If this occurs, it is possible by February the NAO/AO index may become more negative than originally thought.
KEY POINT—The weather pattern has had a ton of volatility. Most of our studies suggest a cold March for the Midwest and East, but volatile weather the next 5 weeks. Odds are good that a cold end to winter will occur and that eastern ski resorts will be blessed later on. However, once again we have 2 features (MJO) and stratospheric warming that if they persist could portend colder weather for much of the Midwest, deep south or Northeast later in January and early February. This will result in more volatility in the natural gas market, following the recent sell off on warm weather.
Trading natural gas will continue to be a weather market, but daily advice in this market is only accessible to a hedge fund I advise in this and multiple ag commodities around the world.
STRATOSPHERIC WARMING LOOKS MORE EVIDENT LATER THIS MONTH–THIS MAY PORTEND A COLDER OUTLOOK AGAIN LATER. IF THIS BLOCK (RED) GETS ESTABLISHED FOR MORE THAN JUST A WEEK, IT COULD SUGGEST THE LATER PART OF THE WINTER WILL BE COLDER AND SNOWIER THAN NORMAL. 2009 WAS A COLD MID-LATE WINTER. OVERALL, IT HAS BEEN HARDER THAN NORMAL THIS WINTER TO GET A HANDLE ON WHICH INDIVIDUAL ANALOG WOULD BE A BETTER FIT. SOMETIMES LOOKING AT ONE YEAR, SUCH AS 2009 OR AN OTHER, CAN BE A DANGEROUS GAME IN FORECASTING.
Our Climatech program below, the best long range product in the industry, saw these snows coming, weeks ago.
California Drought Easing
The on going California drought has caused billions of dollars in losses the last few years to municipalities, farmers and agriculture in general. California, whose GDP is higher than most countries in the world, depends greatly on winter snow pack for their water supplies.
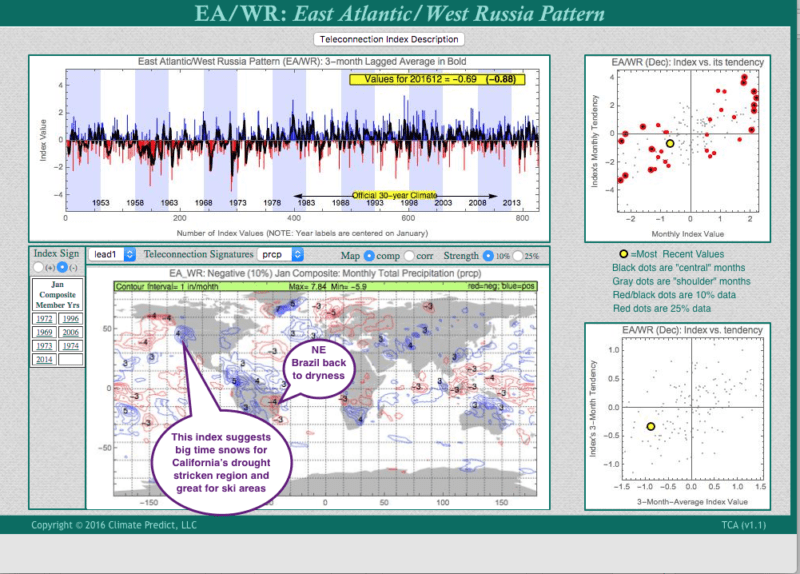
While many forecasters always blame the warm Pacific, or La Nina, etc. for the on going droughts out west, there is a little known teleconnection that may shed light for big time snows and a more active Pacific pattern this winter. The East Atlantic/West Russian Pattern Index is not discussed much, but the map below shows that its relationship with above normal January moisture in California for many ski resorts, is quite highly correlated.
This index also portends some potential problems for NE Brazil coffee areas and generally good weather for the west African cocoa crop.
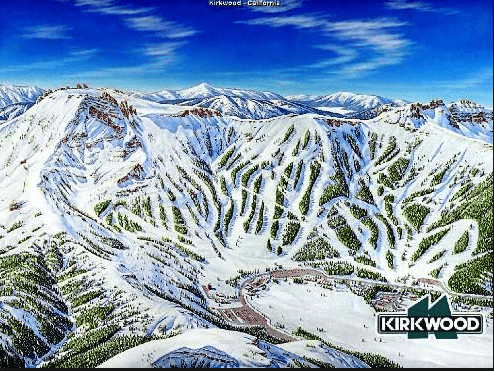
Ski areas such as Kirkwood, Lake Tahoe could see 5-10 feet of snow over the next week. Many areas have already seen 4 feet the last 7 days–the best skiing in years. Great skiing will continue in Colorado, Utah, etc., while eastern ski resorts see a big warming trend heading into mid-late January.
What is the East Atlantic/West Russia Index Pattern?
The East Atlantic/ West Russia (EATL/WRUS) pattern is one of three prominent teleconnection patterns that affects Eurasia throughout year. This pattern has been referred to as the Eurasia-2 pattern by Barnston and Livezey (1987). The East Atlantic/ West Russia pattern consists of four main anomaly centers. The positive phase is associated with positive height anomalies located over Europe and northern China, and negative height anomalies located over the central North Atlantic and north of the Caspian Sea.
The main surface temperature anomalies associated with the positive phase of the EATL/ WRUS pattern reflect above-average temperatures over eastern Asia, and below-average temperatures over large portions of western Russia and northeastern Africa. The main precipitation departures reflect generally above-average precipitation in eastern China and below-average precipitation across central Europe.
CLIMATECH
BLUE SHOWS ABOVE NORMAL JANUARY PRECIPITATION OVER CALIFORNIA AND RED, DRY OVER NE BRAZIL. This product can predict weather trends months in advance before other services.
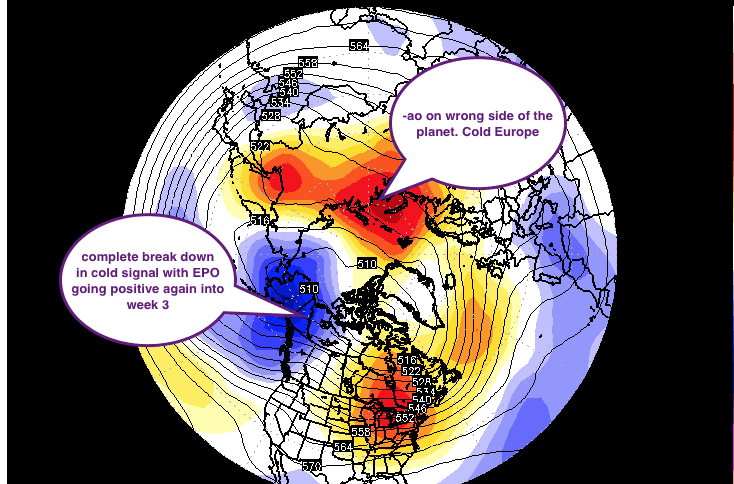
The natural gas market has whip sawed back and forth, in which traders are almost exclusively watching what happens over Alaska and points north and west.
Any blocking (warm-red signal) over or near Alaska can result in a cold streak, as what will be the case this week in the east with snows by Friday a.m. However, we can see a blue signal for mid January(weakening–blue block) that reminds us of the winter 1998-99 analog. This was a post-El Nino year. This particular winter, we have been fooled a couple times from these occasional cold signals and the bottom line is that persist cold in the U.S. natural gas areas will not persist until there is what we call “a stratospheric warming event.” The red block you see on the other side of the globe is creating a potential negative Arctic Oscillation Index (-AO). Typically, during weak La Nina’s and a -AO, the U.S. energy areas see cold weather. However, this has been an extremely difficult time forecasting week’s ahead, since this La Nina is acting in a non typical fashion. The result has been extreme volatility in the weather forecast and warming signals, for now in the natural as market.
Natural gas traders will be watching closely if the pattern changes over or near Alaska or not.
Right now, we are not at liberty to share our longer term views due to client obligations
MAP ABOVE IS FROM WSI CORPORATION AND MY PERSONAL COMMENTS
HELPING YOU MAKE THE BEST INVESTMENT DECISIONS BASED ON THE WEATHER
We use cookies to ensure that we give you the best experience on our website. If you continue to use this site we will assume that you are happy with it.