Receive my January issue of Climatelligence for just $13 and get long-range weather forecasts for global commodities, skiing, travel and much more.
Introduction:
There is no question that Climate Change and a warming planet has increased, not only the number and intensify of hurricanes over the last decade, but also the number of snowstorms. However, any individual, particular winter snow-storm cannot be blamed on Climate Change. The same is not true for Atlantic and Gulf hurricanes, in which much more rapid , sudden intensification is directly correlated to a warming planet and our oceans.
While 2019 was a record warm, mostly snowless winter across the Midwest and Eastern United States, this past decade saw 27 major east coast winter storms. This is three to four times greater than the previous four decades This report talks about La Nina, the warm Atlantic (+AMO index) and what snowfall trends will be for this winter–Jim Roemer.
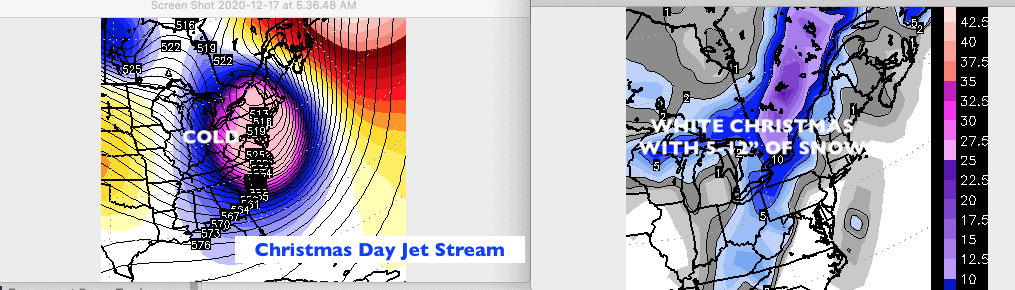
Christmas Day Storm Coming?
From Ohio to the Great Lakes, Ontario, Quebec, and parts of New England, another storm will hit Christmas Eve and Christmas Day with temps falling into the single numbers and teens due to the negative Arctic Oscillation Index. Look for a big Lake Effect snow event over the Great Lakes with 30-50 MPH winds and blinding snows over Upstate New York and Pennsylvania lee of the lakes.
Negative Arctic Oscillation Index, when Combined With La Nina
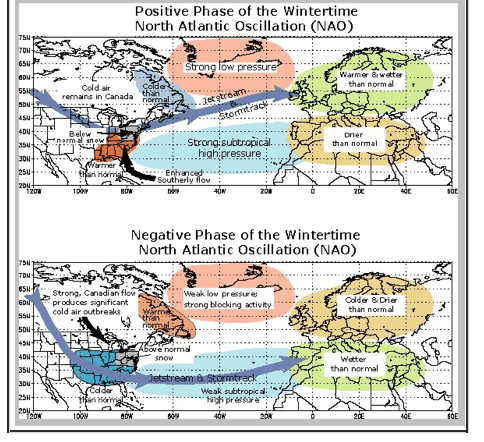
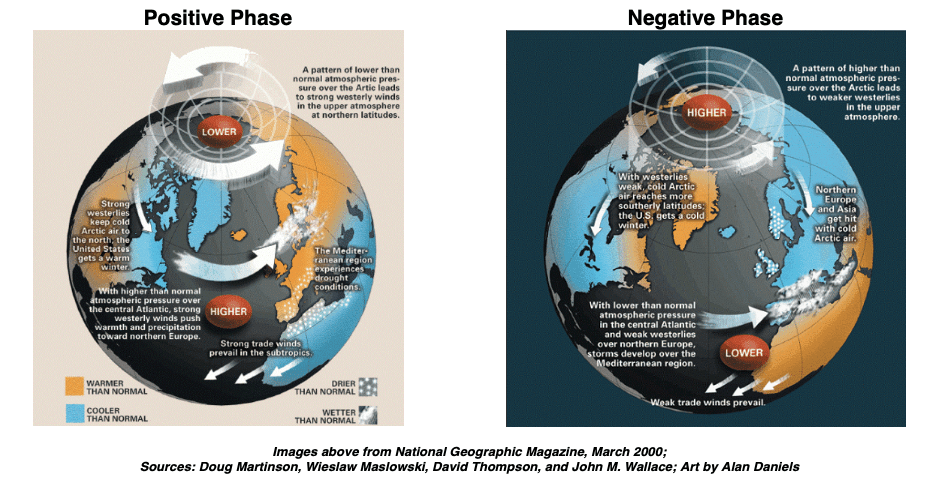
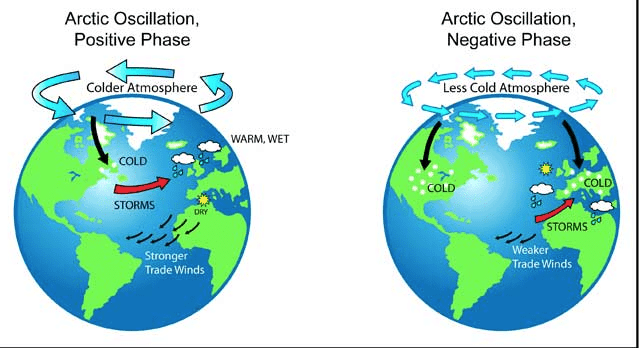
The NAO/AO index, the warm Atlantic and La Nina will all be influencing our winter weather and the snowfall outlook in the months to come. Many people have heard about the AO/NAO index. It has to do with what is happening at the North Pole and over Greenland. When there are warm blocks aloft at these locations, colder, snowier periods and a negative AO/NAO results. Warm, dry winter periods are associated with a positive AO/NAO index, in which the polar vortex remains at the N. Pole.
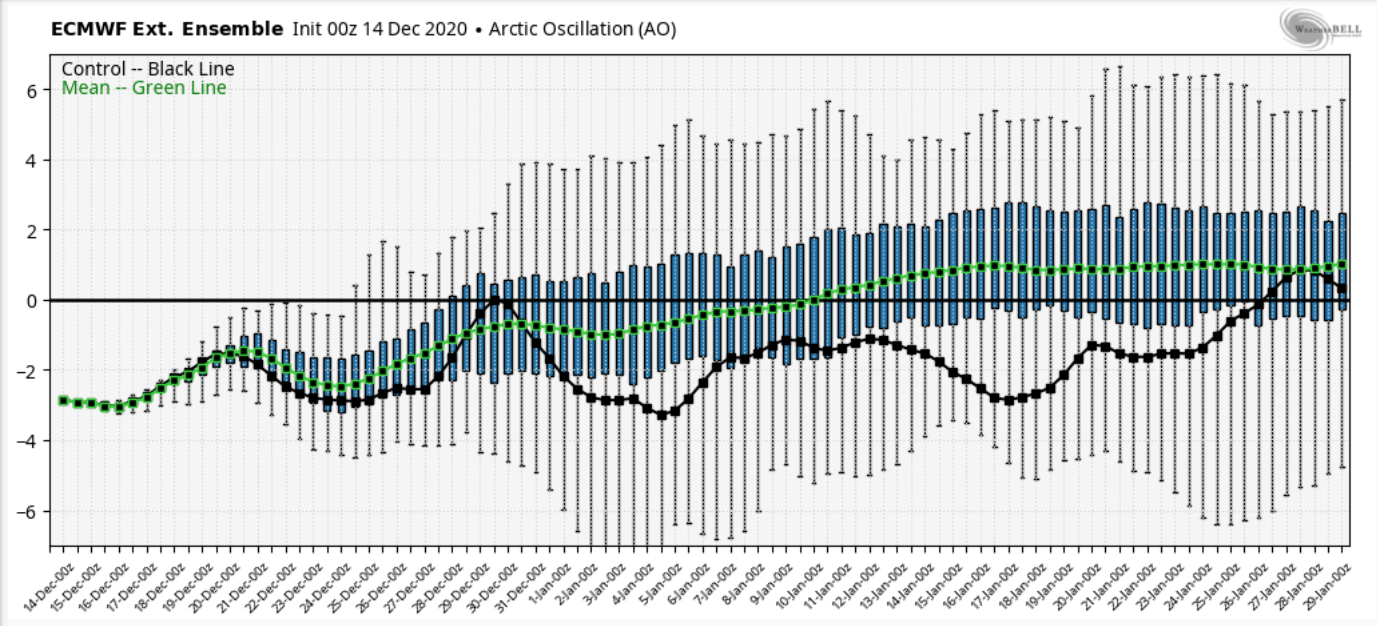
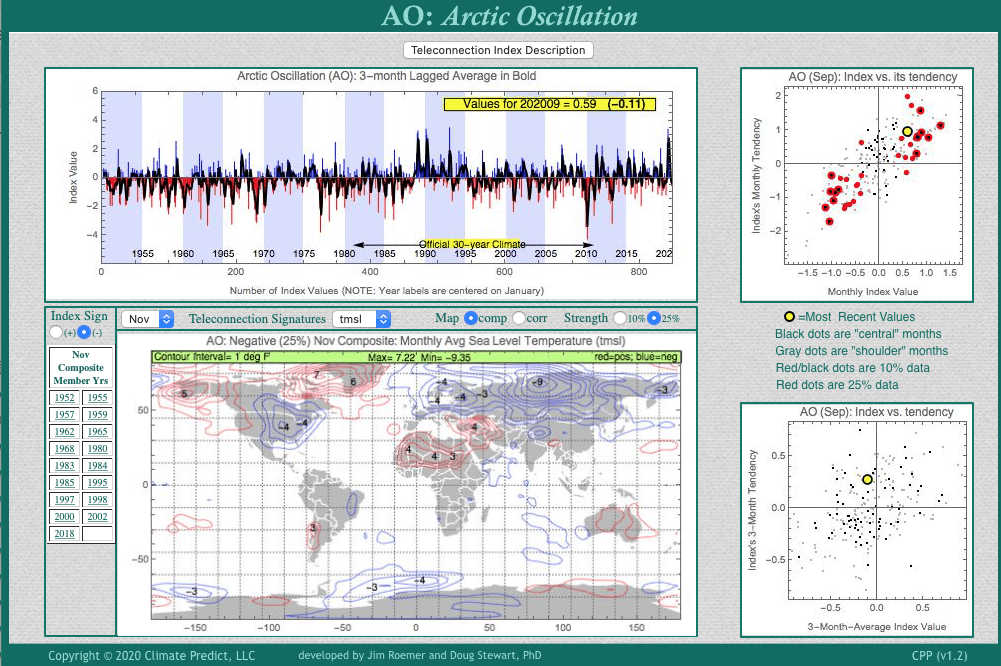
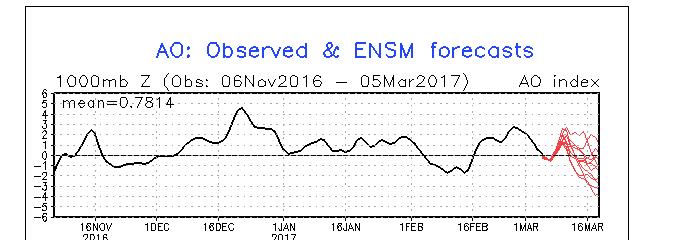
You can see (first map below) that at least one model has the AO index negative into late January. This may be over-zealous but if correct would open the door for periods of colder weather and more frequent snows. However, the Polar Vortex is weaker than normal in part due to the warming Arctic, so major, brutal sustained cold like that observed in the 1970’s and 1980’s is unlikely.
When the AO/NAO index is negative, this means there is warming blocking aloft from Greenland to the Arctic. The result is the negative phase (lower map, above) with more frequent cold and snows, in the areas shaded in blue. The top map is what happened in November with a positive AO/NAO index; a lack of early season snowfall and very mild weather that pressured natural gas prices, some 25%
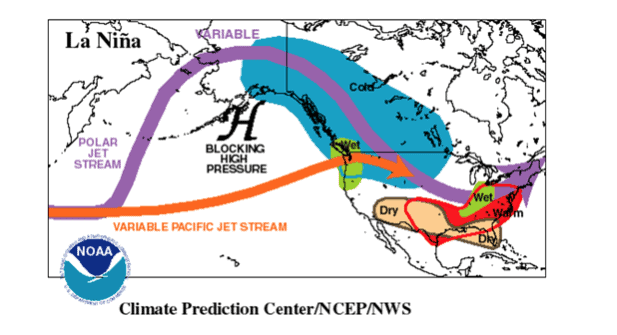
During La Nina, the jet stream normally looks from western Canada southward into the eastern U.S. resulting in an intense battle ground between cold air to the north and warm air over the southern U.S. This results in very stormy eastern weather, while the southern Plains tends to see droughts and problems with the wheat crop.
Climate Predict: La Nina, Warm Atlantic and Late Winter Snowfall Trends
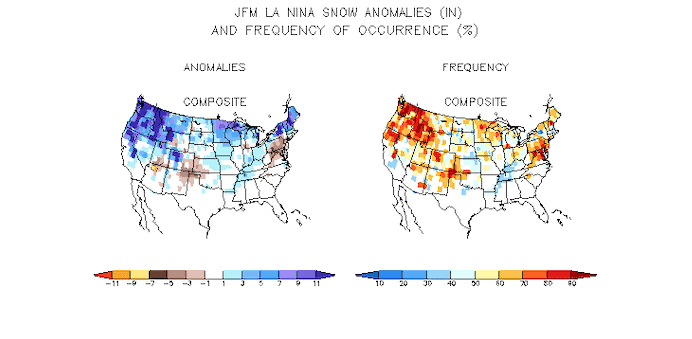
Shown below is a composite of snowfall trends during all La Nina’s. I should point out, of course, that not all La Nina’s are the same and Climate Change and other factors have influenced trends over the years. However, in “general” one can see that above-normal snowfall (blue) tends to fall over New England and the N. Plains and upper Midwest. The most snowfall during La Nina events falls in the Pacific NW, and northern Rockies. This is good news for ski resorts in Maine to Oregon, Washington, Wyoming, and Idaho
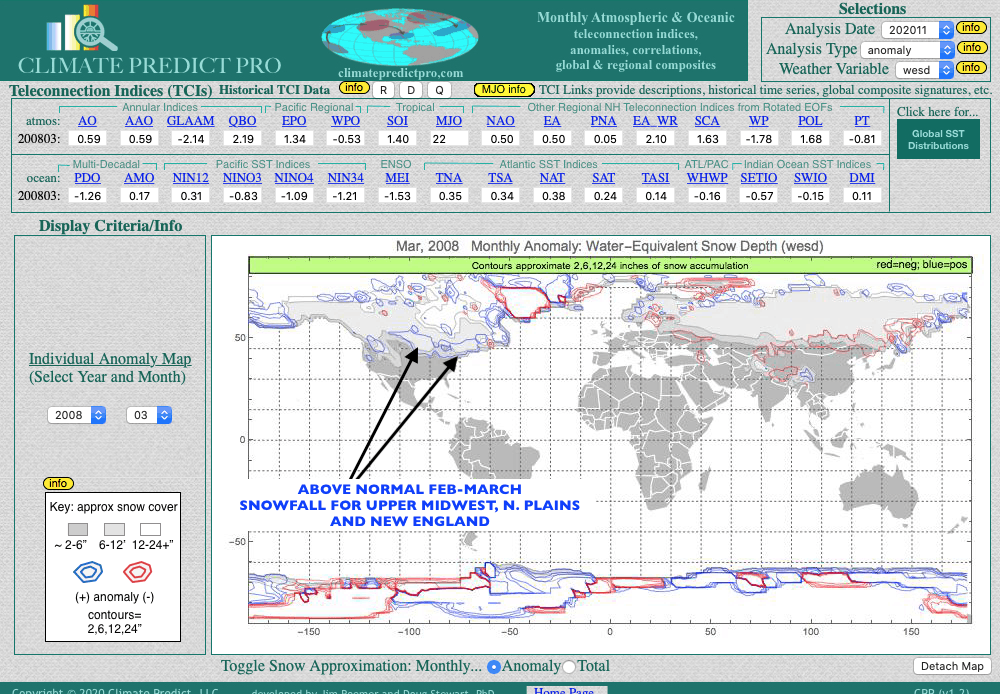
CLIMATE PREDICT AND TELECONNECTIONS: A WARM ATLANTIC, DECEMBER NEGATIVE AO INDEX AND LA NINA. WHAT HAPPENS BY LATE WINTER WITH RESPECT TO SNOWFALL?
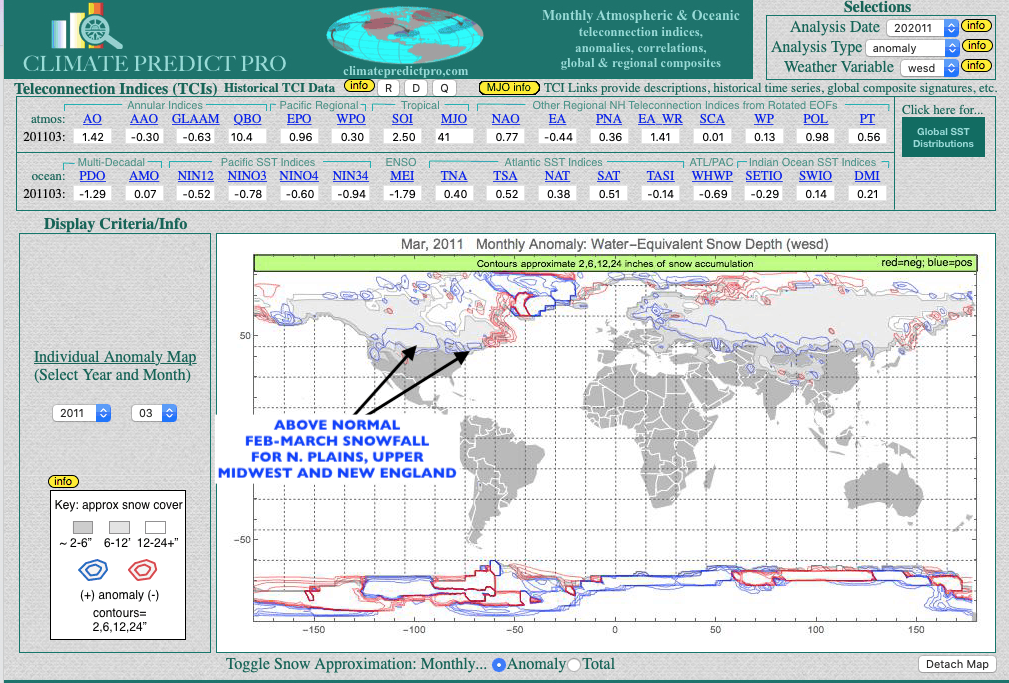
The two maps (above) is my weather forecast software showing March snowfall trends. This program uses teleconnections, other than just La Nina; such as the warm Atlantic (AMO), the NAO/AO, etc. Notice how late winter will be snowiest where you see the arrows. I used these two La Nina years (March of 2008, March 2011) because of the similarity of A) December eastern snowstorms; B) The Warm Atlantic and for other reasons. While early to mid Winter will be variable with respect to temps and snowfall, look for a cold late winter into March across much of the Midwest and East.
Upcoming Reports in Climatelligence Newsletter: Solar Cycles, South American Weather For Grains, La Nina and More
But just because the upper Midwest and New England and Great Lakes will have an active late winter snow season, does this mean that the Midwest and Plains wheat areas will escape La Nina type drought? Not necessarily as it is possible a bull market in grains could re-ignite if either A) South American has a hot, dry summer; B) The Midwest and Plains see the drought expand next spring.
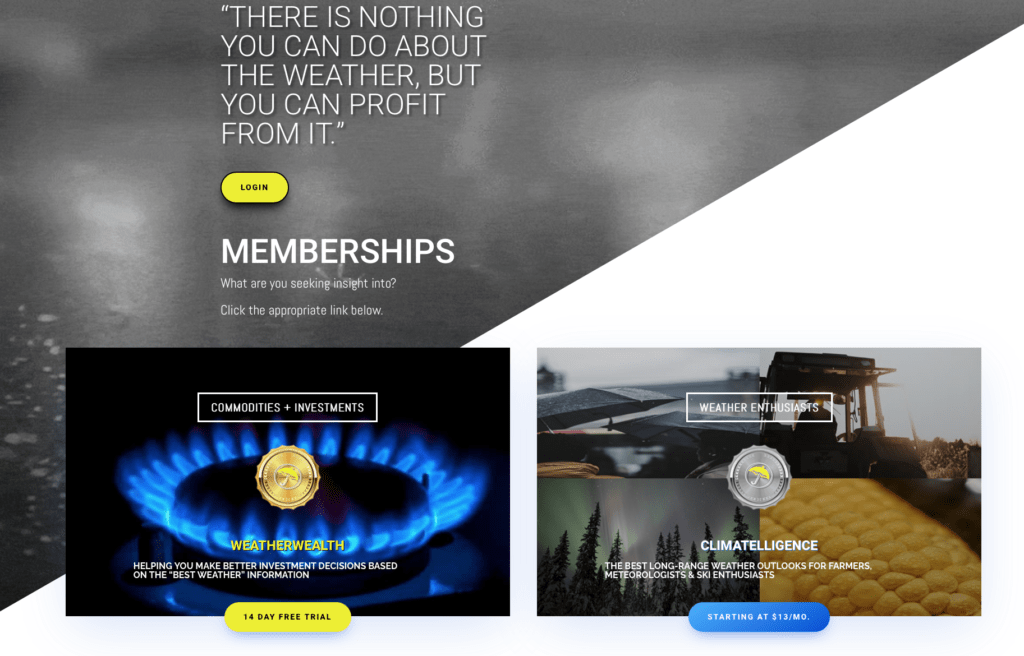
To find out more, I invited you to try my monthly newsletter Climatelligence for just $13. Please click on the link below and learn about how to use weather to trade commodities and our long-range weather forecast used by farmers and traders around the world
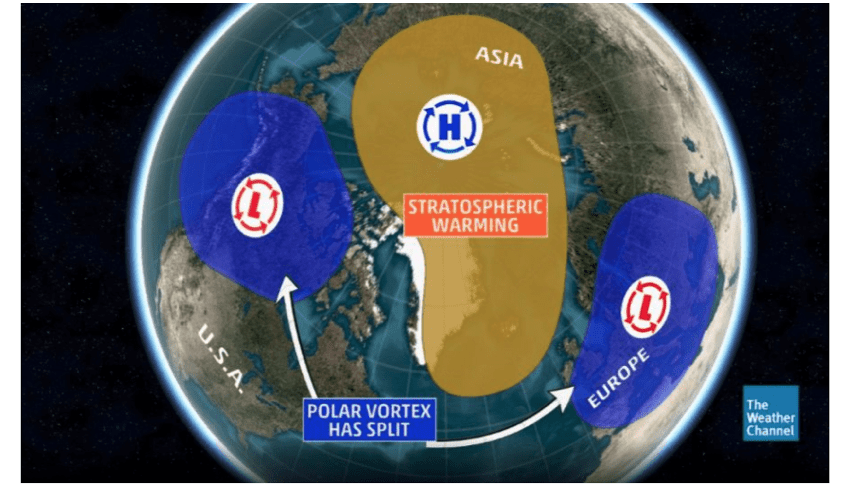
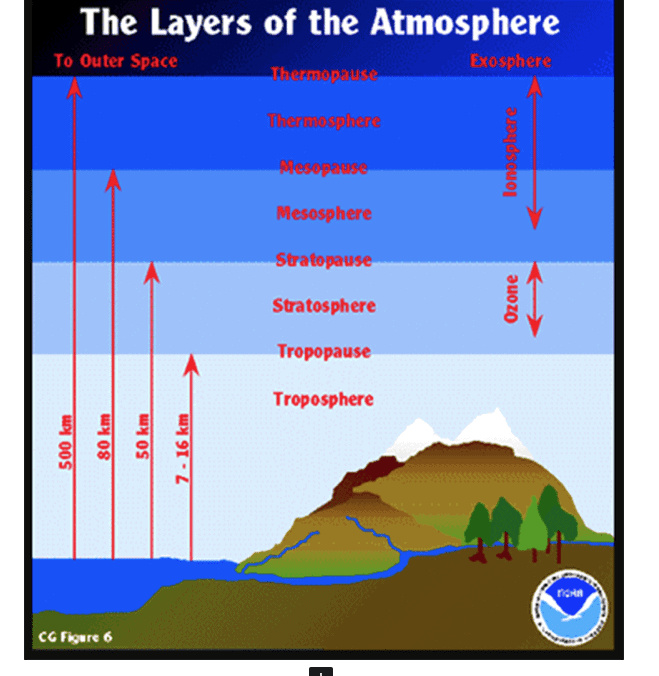
The image above shows a typical stratospheric warming event. This has not happened for years in part due to the melting Arctic. When this happens, cold weather can spark a rally in certain sectors of the energy complex.
The blue cooling you see on the image above isabout 75,000 feet up in the stratosphere. This often PREVENTS the Polar Vortex to move south and is often a bearish aspect to the heating oil market, with certain crack spreads and natural gas.
The stratosphere is the layer of the atmosphere just above our main weather atmosphere, the troposphere. Here’s a look at the atmosphere divided into layers.
What is a Sudden Stratospheric Warming?
In recent years some extreme cold, winter snow events have all been connected to the surface effects of sudden stratospheric warmings, such as those winters in 2009-10, 2013, and ‘the beast from the east’ in 2018. You may be asking why it is called warming than if it leads to cold conditions?
The term sudden stratospheric warming refers to what is observed in the stratosphere:- rapid warming (up to about 50 °C in just a couple of days), between 10 km and 50 km above the earth’s surface. This is so high up that we don’t feel the ‘warming’ ourselves. However, usually, a few weeks later, we can start to see knock-on effects on the jet stream, which in turn affects our weather lower down (in the troposphere).
When this happens way up in the stratosphere, the Polar Vortex can move south resulting in a severe US winter and be good news for ski resorts, winter retailers, and the natural gas market, but not so, so far this year. The opposite is occurring. Again, cooling over the Arctic, so the Polar Vortex remains there and the US–mostly warm.
CLICK ABOVE TO FIND OUT MORE TO GET THE BEST WEATHER AND INVESTMENT INFORMATION
Our clients have a variety of option spreads in natural gas and other markets based on our winter weather forecast. Try out our less expensive monthly service for just $13
How does sudden stratospheric warming occur?
Every year in winter, strong westerly winds circle around the pole high up in the stratosphere. This is called the stratospheric polar vortex and it circulates around cold air high over the Arctic. I believe, because of the melting Arctic, this has increased the wind speed around the polar vortex and has helped to keep the vortex mostly to the north of the U.S. Last winter was a key example with record warm weather and a collapse in heating oil and natural gas prices.Without a stratospheric warming event, the weather should remain bearish nat gas and heating oil spreads.
In some years, the winds in the polar vortex temporarily weaken, or even reverse to flow from east to west. The cold air then descends very rapidly in the polar vortex and this causes the temperature in the stratosphere to rise very rapidly, as much as 50°C over only a few days; hence the term sudden stratospheric warming.
As the cold air from high up in the stratosphere disperses, it can affect the shape of the jet stream as the cold air sinks from the stratosphere into the troposphere. It is this change in the jet stream that causes our weather to change.
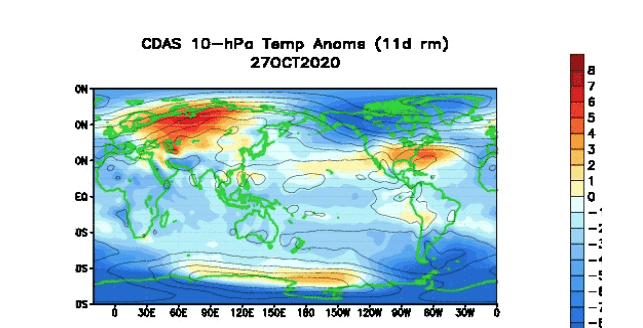
Notice the image above in December 2018 and the warming (red) at 75,000 feet over the North Pole. This helped to push the Polar Vortex south and result in a cold period in late December and a rally in energy prices. Again, we DO NOT have this situation, currently.
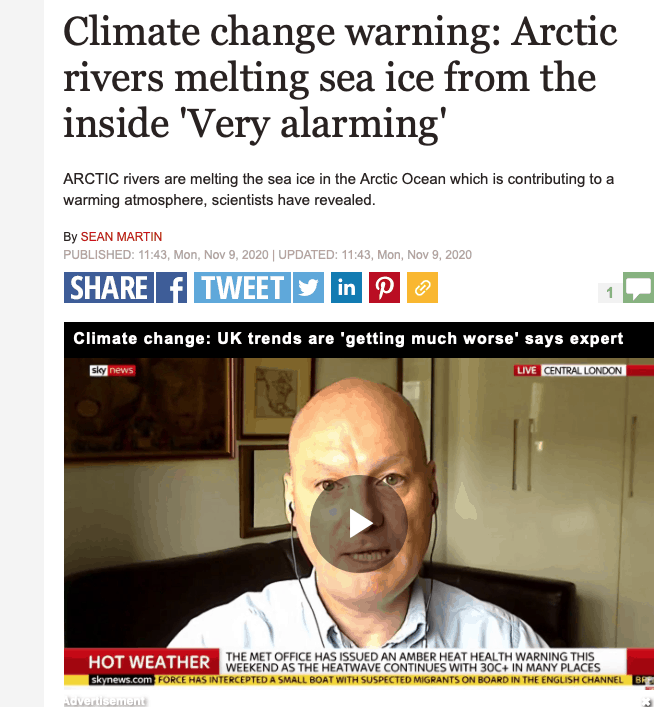
For some updated information about the melting Arctic, see the video, below
The NAO/AO can be thought of as an index of high latitude blocking. This term defines ridges of high pressure in the upper latitudes of the northern hemisphere that block the normal atmospheric circulation of wind. Such blocking can occur from the far Northeast Pacific through Canada, the Arctic, Greenland, and the North Atlantic. It can result in totally abnormal circulations in the atmosphere.
The upcoming current negative phase of the AO index promises to bring a colder later fall and early winter to much of the central or eastern United States and parts of Europe. This could get the ski season off to a better start in New England and Europe and potentially support certain energy spreads this winter “if” we see extreme winter cold. While the AO index is turning negative, it remains to be seen just how much additional global warming might occur due to the historic western fires and the melting polar ice cap.
The negative AO index (right) is with us and helped to rally natural gas and pressure coffee and soybeans earlier this week.
Whenever the NAO/AO is high (positive), high latitude blocking is much less frequent, and the jet stream flows quickly from west to east carrying weather systems. It acts as a divide between cold air to the north and warm air to the south. The Eastern US, Europe, and East Asia, which lie in the mid-latitudes, experience long stretches of mild weather. They remain cut off from cold, Arctic air masses. This happened last winter and was responsible for the major collapse in natural gas prices and heating oil spreads.
A negative AO index in November. Notice the cold weather (blue are temp departures) around the northern Hemisphere
At times when the NAO/AO is low (negative), high latitude blocking is more frequent. This will be happening this fall and perhaps this winter. The flow of air in the atmosphere is impeded or becomes blocked. The jet stream is diverted from its normal trajectory and meanders north and south around the high latitude blocking. Mixing of air masses occurs with warm air flowing north into the Arctic and cold air flowing south into the mid-latitudes and cause more severe winter weather for those regions. This is because Arctic air masses repeatedly drive southward. Furthermore, the mixing of warm and cold air masses fuel storms. With more abundant cold air, the precipitation from these storms often falls as snow.
I began alerting my WeatherWealth newsletter subscribers last week, that I thought we would walk in this week with talk of much colder late fall weather for US natural gas areas because I had expected the AO index to go negative. I believe that part of the warming over the Arctic and the “wavy polar vortex” (map above to the right) is because of the intense California fires and also due to La Niña.
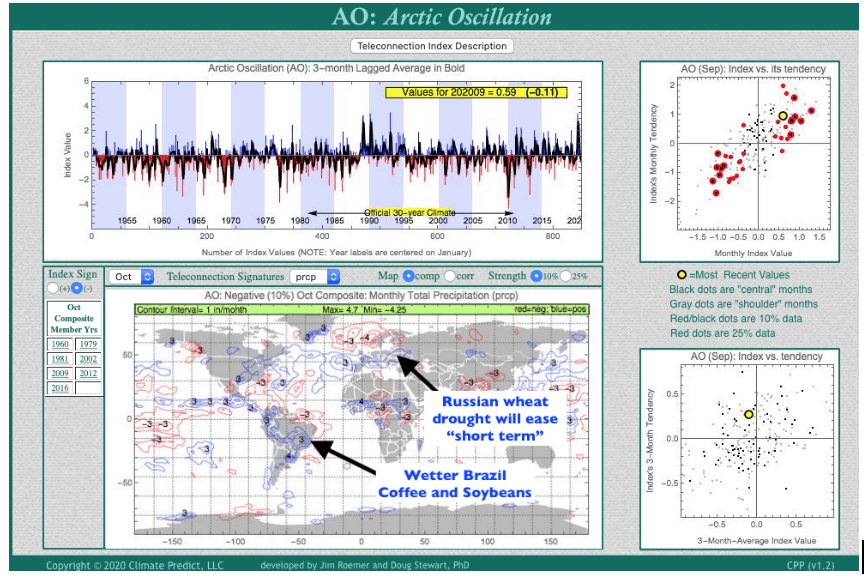
The AO Index can also affect global commodity regions, thousands of miles away
The AO index does not only influence northern Hemisphere weather for the energy markets but also several key crop regions for agricultural commodities.
Climate Predict is our proprietary forecast program. The screenshot shown below depicts an example of how we assess global weather trends for investors and farmers all around the world. Despite the fact that potential problems may exist later for coffee and soybeans in Brazil, due to drier weather:
Monday’s sell off coffee and soybeans was due to wetter forecasts for Brazil.
A negative AO index, not just El Nino or La Nina can influence global crop weather.
Will the grain market resume its uptrend longer term? What’s our feeling about natural gas and other markets? For that, we recommend you sign up for a complimentary trial to our WeatherWealth newsletter.
The near historical Midwest flooding and snow melt has offered a glimmer of hope to farmers and grain traders, that perhaps the corn market would bottom and head higher this spring. However, great South American weather, combined with large corn and soybean carry over stocks and poor demand has continued to pressure most grain prices. It is my feeling that in the next few weeks, a potential weather market in grains will create short covering as planting delays for corn and disease issues of winter wheat arise as we head deeper into May.
The three or four commodities that have been breaking out to the upside recently have been crude oil, cotton and sugar. Some of this is weather related but most of the reasons for higher prices in these commodities has been due to the outside markets, ideas of OPEC cuts and some potential El Nino driven weather issues, later.
The Arctic Oscillation index, (AO) is one of the most well known teleconnections used by meteorologist to make weather forecast predictions for the northern latitudes; especially during the winter when it comes to the natural gas and heating oil market. When the index is negative, there is often a cold U.S. and/or European winter. The AO index can also have an influence on Midwest spring and summer weather. While a weak El Nino event could still portend some wet weather issues for Midwest grains this spring, it is greatly benefitting the wheat crop from Nebraska to Kansas, Oklahoma and Texas, which previously suffered drought last year.
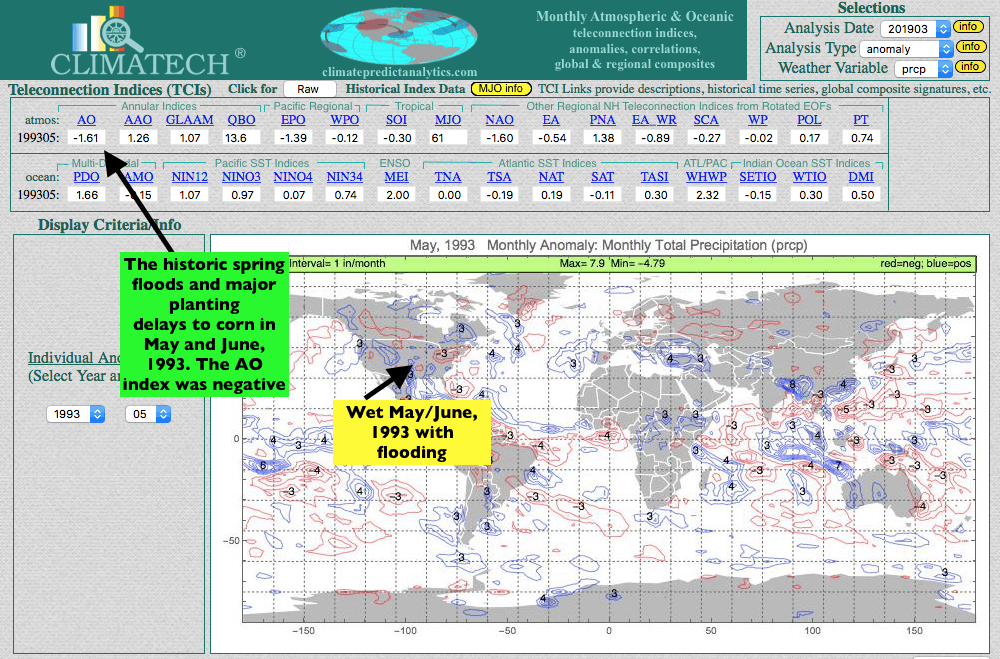
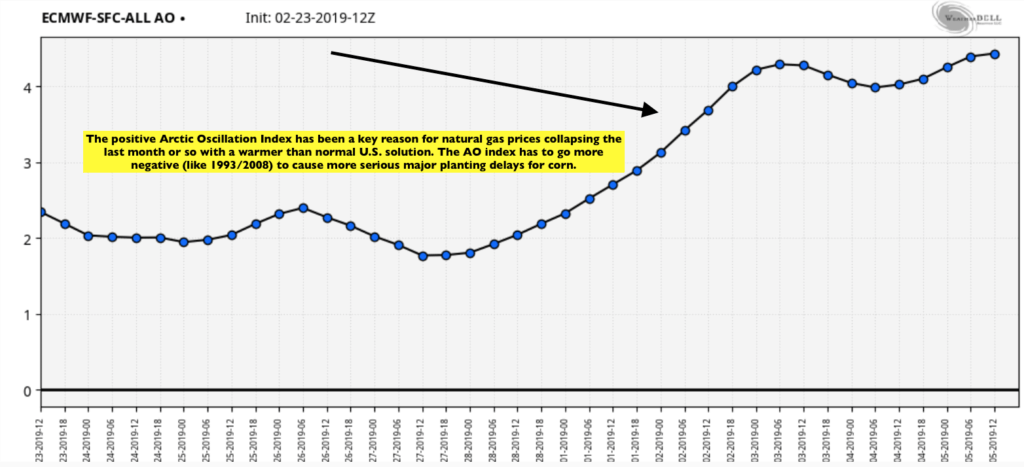
With respect to Midwest corn and soybean planting in May and June, it may take the AO index to go negative to cause major concerns for crop planting the next month or two. Something we will watch for clients and I think could happen. The upper right image of a negative AO index is most conducive to a cold, wet Midwest spring. This is especially true when we have a weak El Nino at the same time–so we will watch this.
Source of map: weather bell.com
The positive AO index (above) has helped natural gas prices fall and also brings a warmer solution for Midwest corn planting offsetting some of the recent wet weather; at least, for now. Notice below, how in 1993, the tail end of El Nino combined with a -AO index resulted in the spring flooding that helped the corn and soybean market soar in May and June. Things are a bit different that this, today. If the AO index begins to become more negative, then much greater concerns could mount about Midwest planting weather in the coming weeks. There will be various trading opportunities in corn, wheat and soybean based on acreage perceptions and wet weather concerns in the coming weeks. Jim Roemer
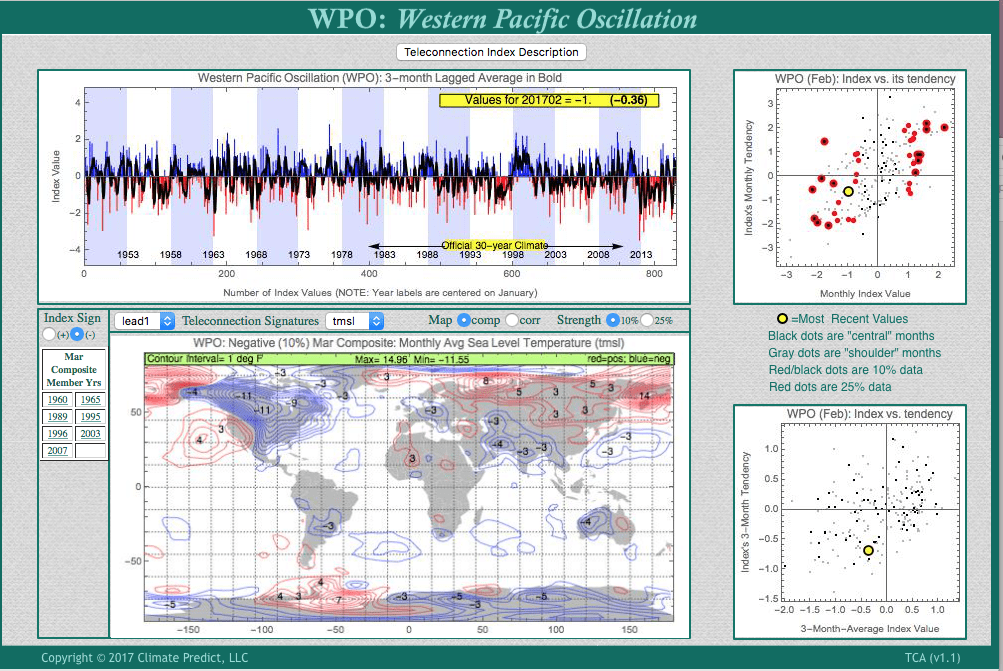
(Map Above) CLIMATECH AND MARCH TEMPS WITH A NEGATIVE WPO INDEX NORTHWEST OF ALASKA AND OVER NORTHEAST EURASIA. Normally this should suggest a colder March, but due to a developing El Nino, melting global sea ice and a warming planet, any sustained cold has not been the rule this winter. Natural gas prices have rallied at times even when March and April have been warm.
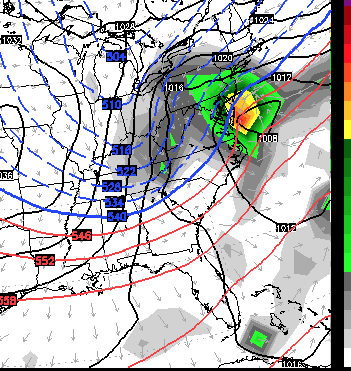
The -AO and -WPO on the front page, from our program, Climatech, suggests a possible big Nor’easter around the 14th, as well as snows this Friday.
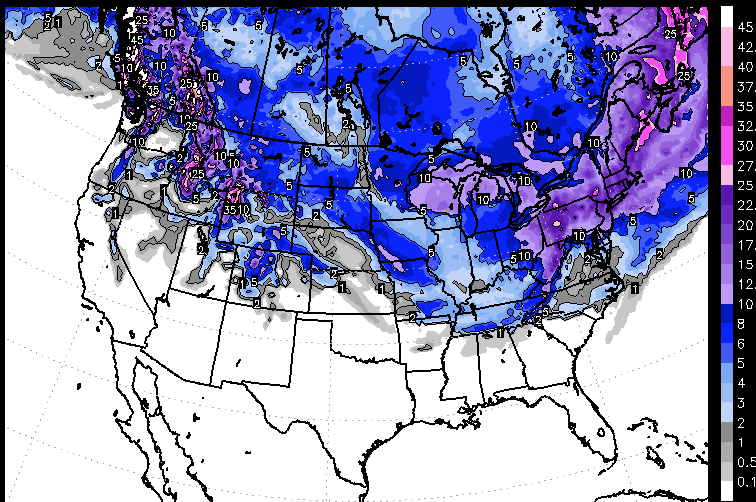
For the first time in weeks, we see the Arctic Oscillation go negative. This offers some colder risks and snow for the upper Midwest and the Northeast into mid- March and offers a potential bottom in the natural gas market and some treacherous driving conditions for parts of the Northeast, especially after the 14th As the map below shows, some places in the Northeast could see more than 10-15″ of snow. Some ski resorts will benefit from late season snows in Vermont, New Hampshire, Maine and upstate New York, which have seen a warm winter and freeze-thawing lately.
Total snowfall next 2 weeks
SNOWFALL PROJECTIONS (above). Ensemble maps from WSI
Arctic Oscillation index has been positive most winter, but you can see it heading slightly negative for the first time in weeks. The main impetus for the colder weather has to do with a weather feature, thousands of miles away over Northeast Asia. (negative WPO index–map below). Notice the colder mid-late March forecast (blue). Nevertheless, the warm Atlantic and a developing east-based El Nino have resulted in a warm winter pressuring natural gas prices and various natural gas equities. However, given colder weather and snows into mid-March, the natural gas market has built into much of the winter bearishness.
WEATHER WEALTH SAMPLE CONTENT
HELPING YOU MAKE THE BEST INVESTMENT DECISIONS BASED ON THE WEATHER
We use cookies to ensure that we give you the best experience on our website. If you continue to use this site we will assume that you are happy with it.