Receive my January issue of Climatelligence for just $13 and get long-range weather forecasts for global commodities, skiing, travel and much more.

Introduction:
There is no question that Climate Change and a warming planet has increased, not only the number and intensify of hurricanes over the last decade, but also the number of snowstorms. However, any individual, particular winter snow-storm cannot be blamed on Climate Change. The same is not true for Atlantic and Gulf hurricanes, in which much more rapid , sudden intensification is directly correlated to a warming planet and our oceans.
While 2019 was a record warm, mostly snowless winter across the Midwest and Eastern United States, this past decade saw 27 major east coast winter storms. This is three to four times greater than the previous four decades This report talks about La Nina, the warm Atlantic (+AMO index) and what snowfall trends will be for this winter–Jim Roemer.
Christmas Day Storm Coming?
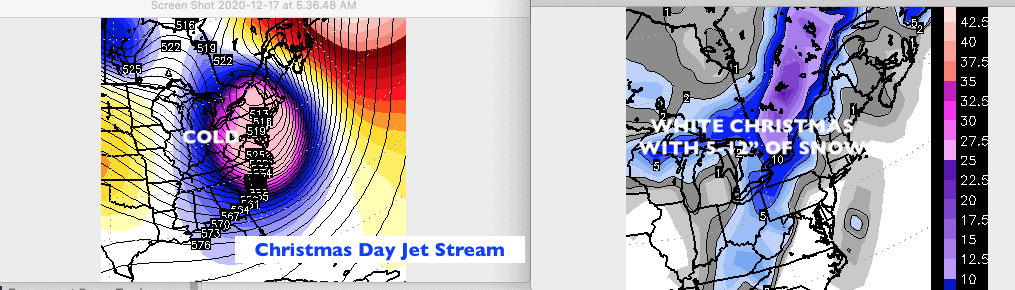
From Ohio to the Great Lakes, Ontario, Quebec, and parts of New England, another storm will hit Christmas Eve and Christmas Day with temps falling into the single numbers and teens due to the negative Arctic Oscillation Index. Look for a big Lake Effect snow event over the Great Lakes with 30-50 MPH winds and blinding snows over Upstate New York and Pennsylvania lee of the lakes.
Negative Arctic Oscillation Index, when Combined With La Nina
The NAO/AO index, the warm Atlantic and La Nina will all be influencing our winter weather and the snowfall outlook in the months to come. Many people have heard about the AO/NAO index. It has to do with what is happening at the North Pole and over Greenland. When there are warm blocks aloft at these locations, colder, snowier periods and a negative AO/NAO results. Warm, dry winter periods are associated with a positive AO/NAO index, in which the polar vortex remains at the N. Pole.
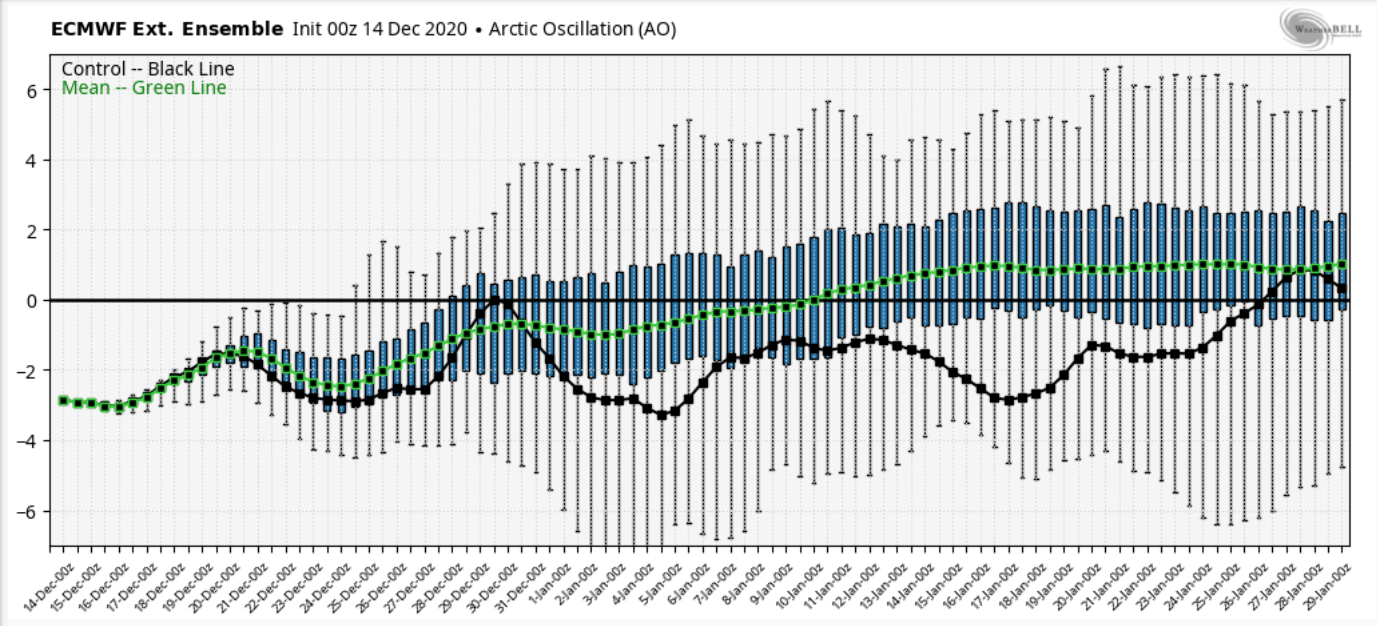
You can see (first map below) that at least one model has the AO index negative into late January. This may be over-zealous but if correct would open the door for periods of colder weather and more frequent snows. However, the Polar Vortex is weaker than normal in part due to the warming Arctic, so major, brutal sustained cold like that observed in the 1970’s and 1980’s is unlikely.
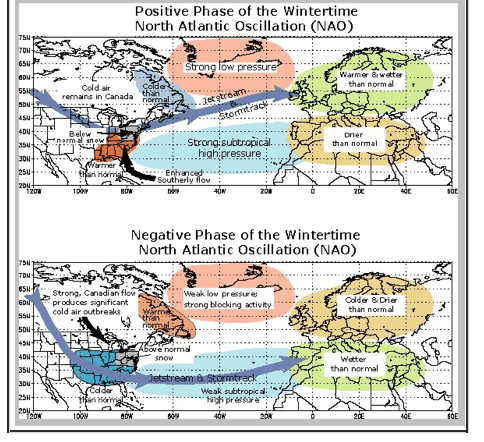
When the AO/NAO index is negative, this means there is warming blocking aloft from Greenland to the Arctic. The result is the negative phase (lower map, above) with more frequent cold and snows, in the areas shaded in blue. The top map is what happened in November with a positive AO/NAO index; a lack of early season snowfall and very mild weather that pressured natural gas prices, some 25%
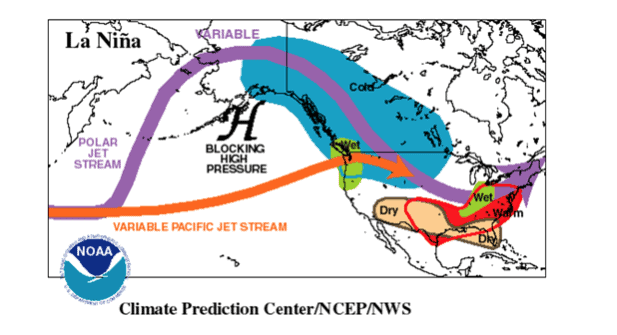
During La Nina, the jet stream normally looks from western Canada southward into the eastern U.S. resulting in an intense battle ground between cold air to the north and warm air over the southern U.S. This results in very stormy eastern weather, while the southern Plains tends to see droughts and problems with the wheat crop.
Climate Predict: La Nina, Warm Atlantic and Late Winter Snowfall Trends
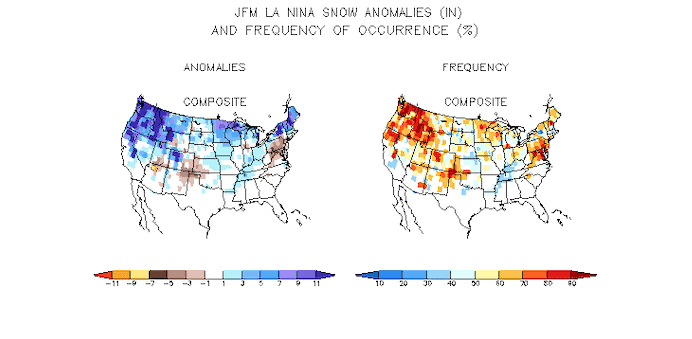
Shown below is a composite of snowfall trends during all La Nina’s. I should point out, of course, that not all La Nina’s are the same and Climate Change and other factors have influenced trends over the years. However, in “general” one can see that above-normal snowfall (blue) tends to fall over New England and the N. Plains and upper Midwest. The most snowfall during La Nina events falls in the Pacific NW, and northern Rockies. This is good news for ski resorts in Maine to Oregon, Washington, Wyoming, and Idaho
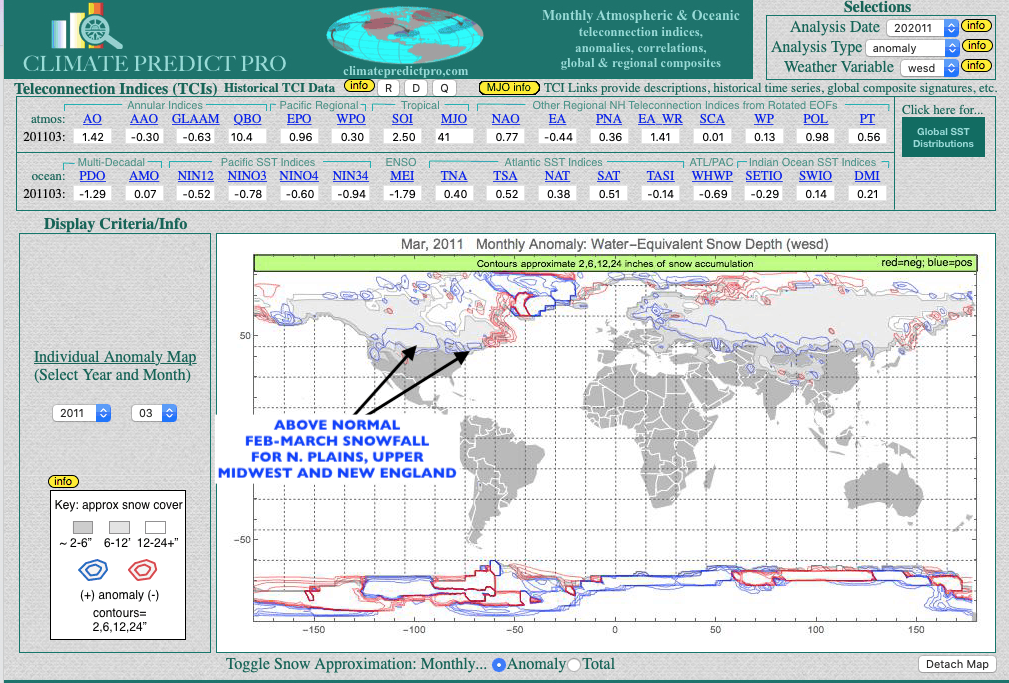
CLIMATE PREDICT AND TELECONNECTIONS: A WARM ATLANTIC, DECEMBER NEGATIVE AO INDEX AND LA NINA. WHAT HAPPENS BY LATE WINTER WITH RESPECT TO SNOWFALL?
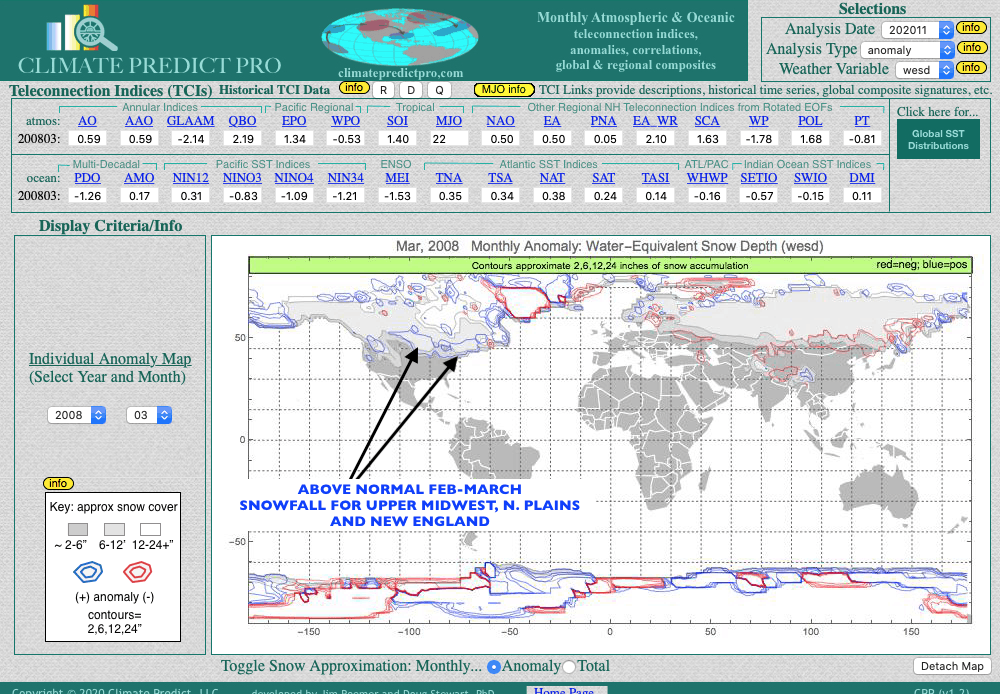
The two maps (above) is my weather forecast software showing March snowfall trends. This program uses teleconnections, other than just La Nina; such as the warm Atlantic (AMO), the NAO/AO, etc. Notice how late winter will be snowiest where you see the arrows. I used these two La Nina years (March of 2008, March 2011) because of the similarity of A) December eastern snowstorms; B) The Warm Atlantic and for other reasons. While early to mid Winter will be variable with respect to temps and snowfall, look for a cold late winter into March across much of the Midwest and East.
Upcoming Reports in Climatelligence Newsletter: Solar Cycles, South American Weather For Grains, La Nina and More
But just because the upper Midwest and New England and Great Lakes will have an active late winter snow season, does this mean that the Midwest and Plains wheat areas will escape La Nina type drought? Not necessarily as it is possible a bull market in grains could re-ignite if either A) South American has a hot, dry summer; B) The Midwest and Plains see the drought expand next spring.
To find out more, I invited you to try my monthly newsletter Climatelligence for just $13. Please click on the link below and learn about how to use weather to trade commodities and our long-range weather forecast used by farmers and traders around the world