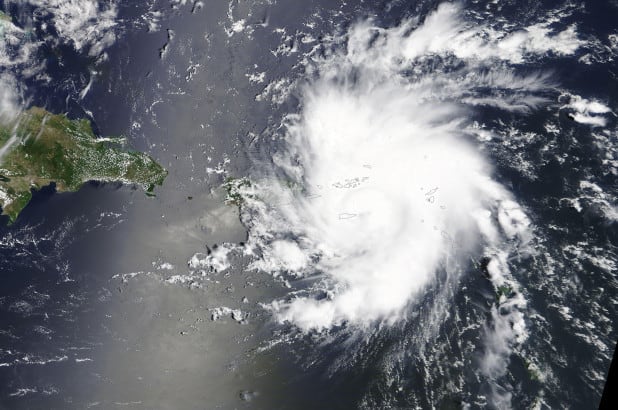
I mentioned a few days ago to clients that Dorian would likely explode more than models suggested. Indeed, as of this writing, she is now a category 4 hurricane–tremendous explosion in less than 12 hours. This rapid development and lack of any major steering currents aloft (as was the case with Katrina, Michael, Irma, Andrew and many others, which were easier to predict), could potentially cause Dorian to be much further east then all computer models have suggested. This would be very unusual that all standard computer models used by meteorologists, are a bust. BOTTOM LINE–Much of the State of Florida is being shut down till next Tuesday, but Dorian may create its own wind flow and track pattern due to mesoscale features not picked up by computer models. Hence, much of Florida could be spared the worst of the storm, but residents along the Southeast U.S. coast should be on greater alert. The Bahamas will have one of the worst recorded hurricanes on record with incredible devastation potentially.–Jim Roemer
August 28th-
I recently posted a blog about why African dust and the Amazon burning up, could have some partial influence in reducing the Atlantic hurricane season, particularly for Texas, Mexico and perhaps Puerto Rica this season.
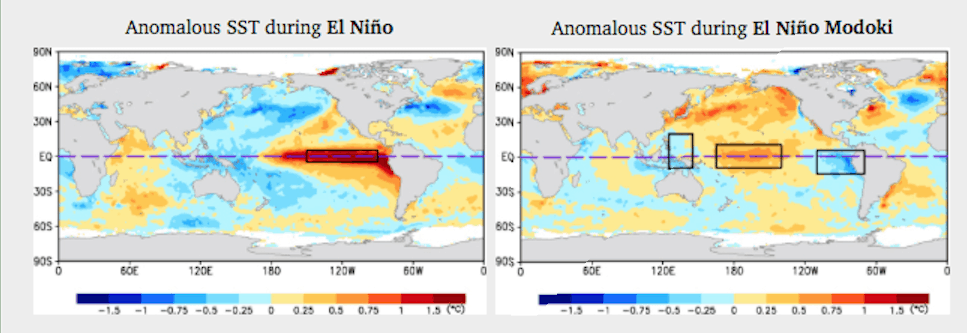
However, this is the main time of the year for the Atlantic hurricane season and a lingering weak El Nino Modoki and warming oceans are key factors in upcoming hurricane threats for Florida and perhaps the east coast this fall. An El Nino Modoki is a west based type El Nino, in which ocean temps west of the dateline are warmer than normal but cooler than normal near Peru.
Warm ocean waters in the western Pacific and cool along the NW South American coast represent an El Nino Modoki. We have had this the last few months
This is a bit unusual. Historically, El Nino’s cause shear in the Atlantic and reduce the Atlantic and Gulf hurricane season. However, the combination of an El Nino Modoki and global warming contributing to the warming oceans , can feed hurricanes. Not all El Nino Modoki’s result in U.S. hurricane strikes, but many of them do.
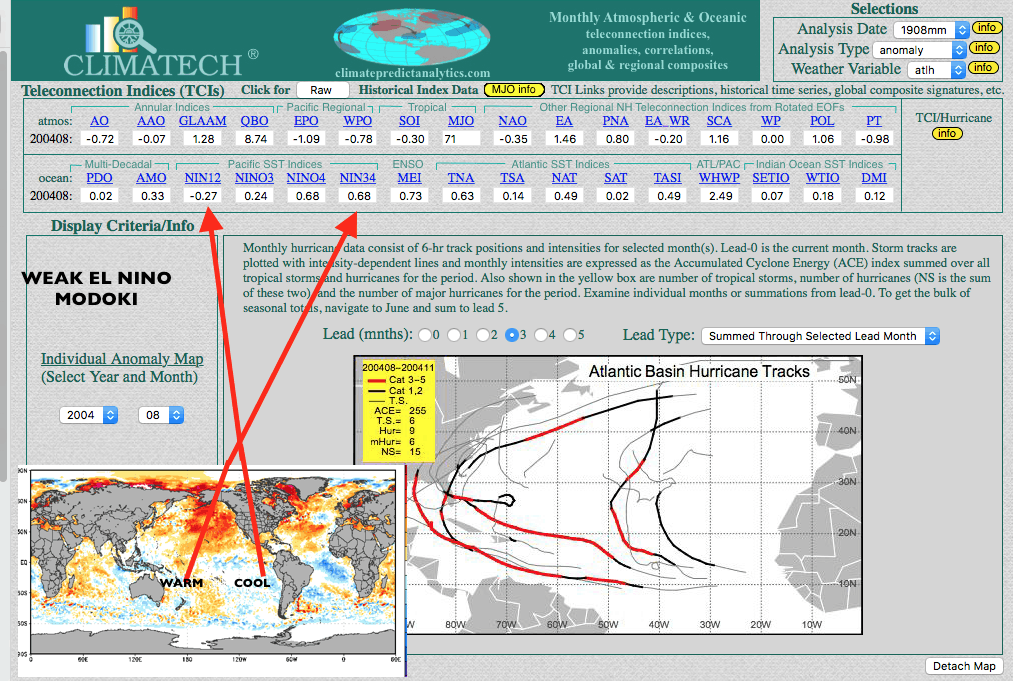
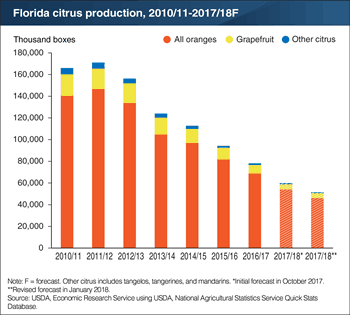
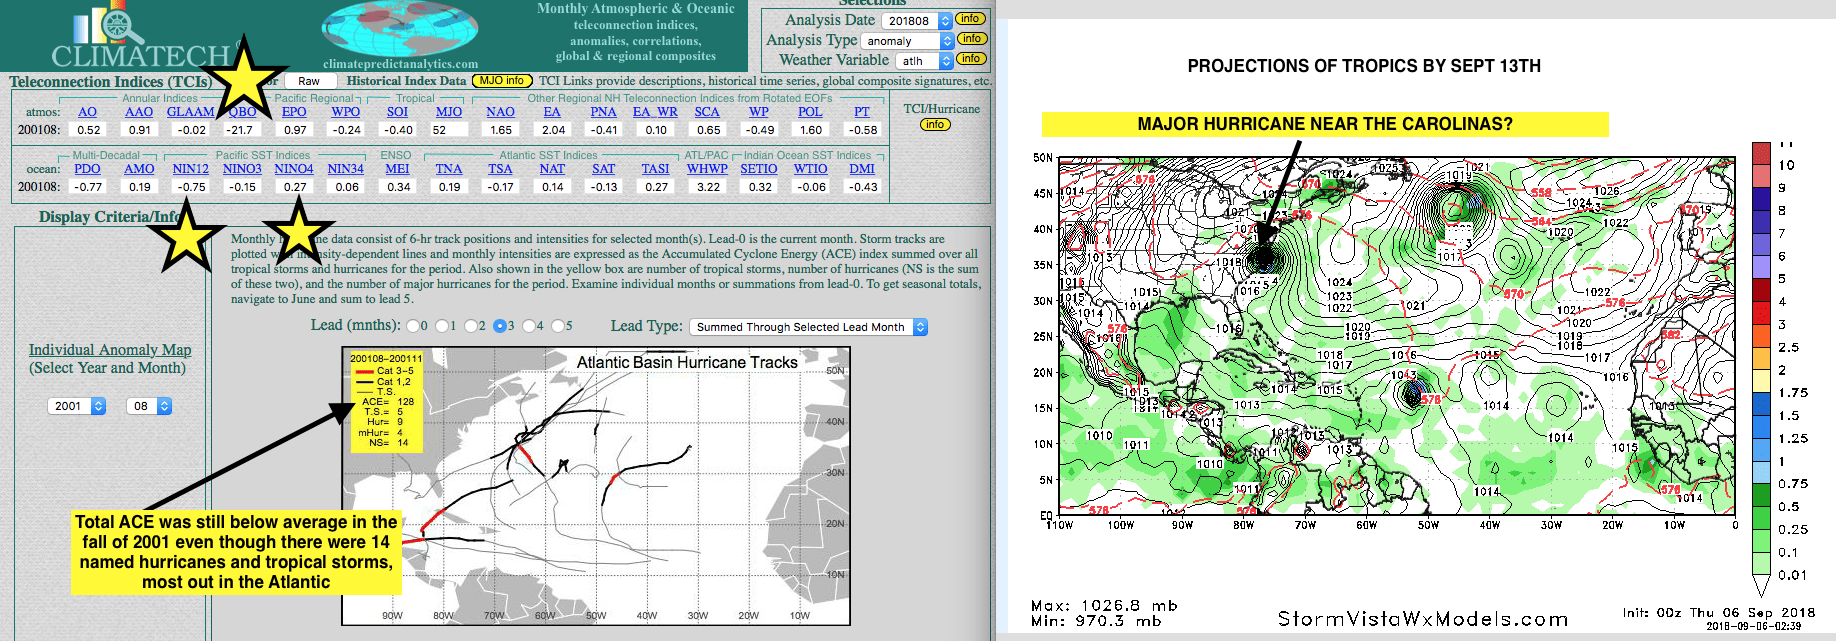
Take for instance the infamous Florida hurricane season of 2004. My Climatech program (above) shows all of the hurricane tracks that summer/fall. These storms decimated the Florida citrus industry and then citrus canker made things even worse the last 5 years. Total ACE was 255 with 15 hurricanes and several major ones.
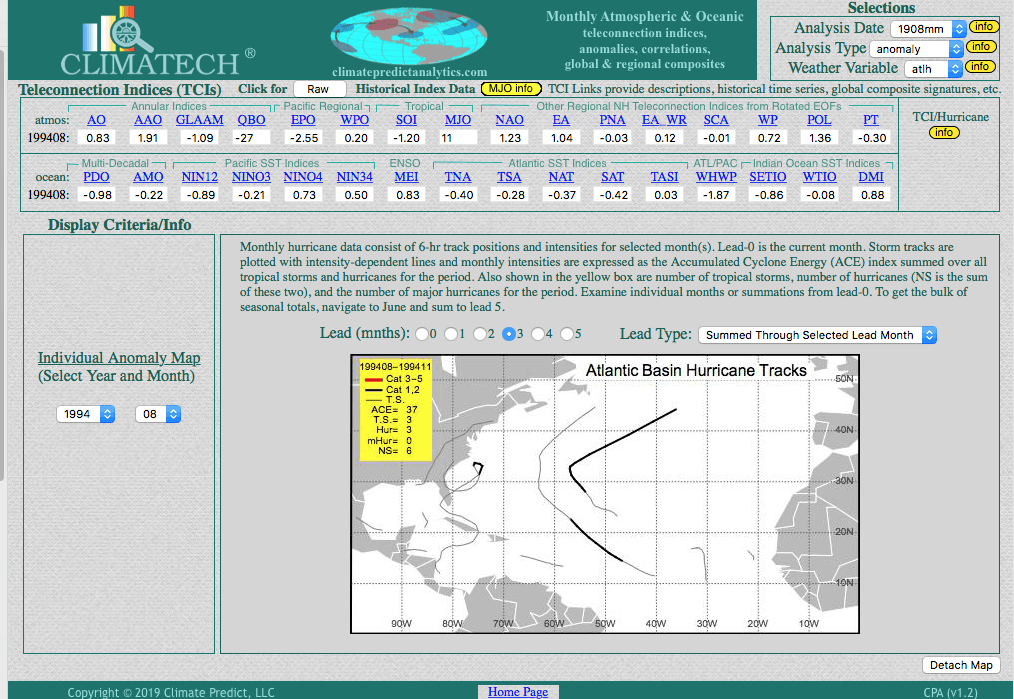
In contrast, look at the inactive hurricane season of 1994; another El Nino Modoki (below). Total ACE that year was only 37. Since 1994, the oceans have warmed considerably possibly adding fuel to the fire to spark greater hurricane development
What about Hurricane Dorian , commodity markets and the rest of the hurricane season?
Commodities such as orange juice, lumber and possibly cotton could see some short term affects from Dorian as it moves through Florida and possibly into southeast U.S. next week. However, often, these type of commodity price moves are short term, knee jerk reactions and not major longer term influences in commodity prices. Natural gas has been rallying on the potential for LNG exports, cheap natural gas prices, some recent hot weather that has slowed production a bit and worries about the hurricane season. However, I doubt if Dorian will have any major impact on U.S. natural gas production and with cooler weather on the way for much of the U.S., any further rally in natural gas prices would likely be due to NON weather factors. It is the Florida citrus industry and other agricultural regions that stand to be the most adversely affected. However, these hurricanes can play tricks at the last minute and veer in directions sometimes not detected or predicted by models (yes, even with the billions of dollars poured into research and computer moderization).
Orange juice prices have been in the doldrums due to big global supplies and weakened demand. People drink a lot more coconut water, etc. these days and not as much OJ. However, the psychology of hurricane Dorian has helped prices rally a bit. Nevertheless, Florida production has dropped off so much in recent years, that weather is not nearly the longer term factor in orange juice prices as it once was, years ago
Hurricane Dorian
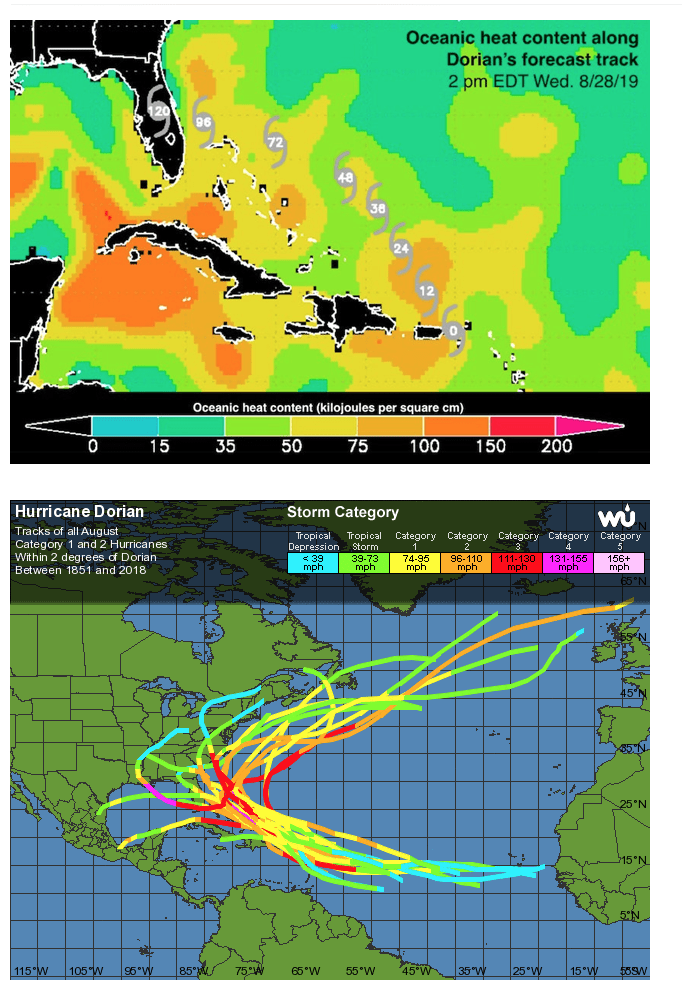
The ocean heat content is high enough that Dorian could explode into greater than a CAT 3, even a CAT 5 hurricane before it hits land. The 2nd map (below) illustrates historical storm tracks with hurricanes and tropical storms in a similar position to where Dorian currently is (As of Thursday a.m. 8/29/19). Notice that some of these paths are further east of Florida and not an issue to the Sunshine State, while others are in the Gulf. However, I doubt we will see the west coast of Florida or Gulf affected by Dorian.
Hurricanes can change course on a “dime”, like what happened with IRMA several years ago. At the time, warnings were up for the east coast of Florida and Miami and as I pointed out to clients and those just concerned about the storm, I mentioned it would likely take a more southerly track towards Cuba and then the west coast of Florida. This indeed happened. There is only a slight chance that Dorian could move into the Gulf of Mexico, based on the historical chart you see above. But again, it should stay far enough way from key natural gas and crude oil production areas.
So how about Hurricane Dorian? Its track will be dictated by an Atlantic ridge, how strong it is and also the ocean temperatures closer to Florida.
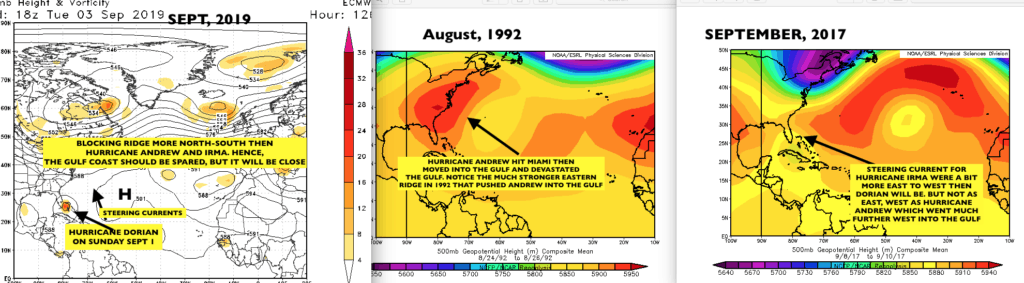
I look for models to initially trend a bit further south, similar to the European model over the next few days. Severe flooding could affect the Everglades and parts of central and southern Florida. If Dorian slows down and drifts further south towards the warmer pool of air, she could be stronger than a CAT 4 at landfall. The three charts above show the upper level steering currents for hurricane Irma (right); infamous hurricane Andrew (center) and for hurricane Dorian (left). The fact the upper level winds are not as easterly as they were for Andrew and Irma will hopefully spare the Gulf coast a major strike, with Dorian probably closer to Miami, but could then stay further east along the eastern Florida coast and up the Atlantic Seaboard.
Here is one of the models Hence, residents of south Florida and possibly along the east coast could see severe flooding.
The track above of Dorian could initially be further south then some models suggest due to the warmer waters over southeastern Florida and near Cuba and the ridge in the Atlantic. However, while most models have Dorian as a CAT 2 hurricane, the warming oceans, brought on in part due to global warming could explode Dorian to a CAT 3 or stronger. If this happens, it could affect and change its track. Jim Roemer
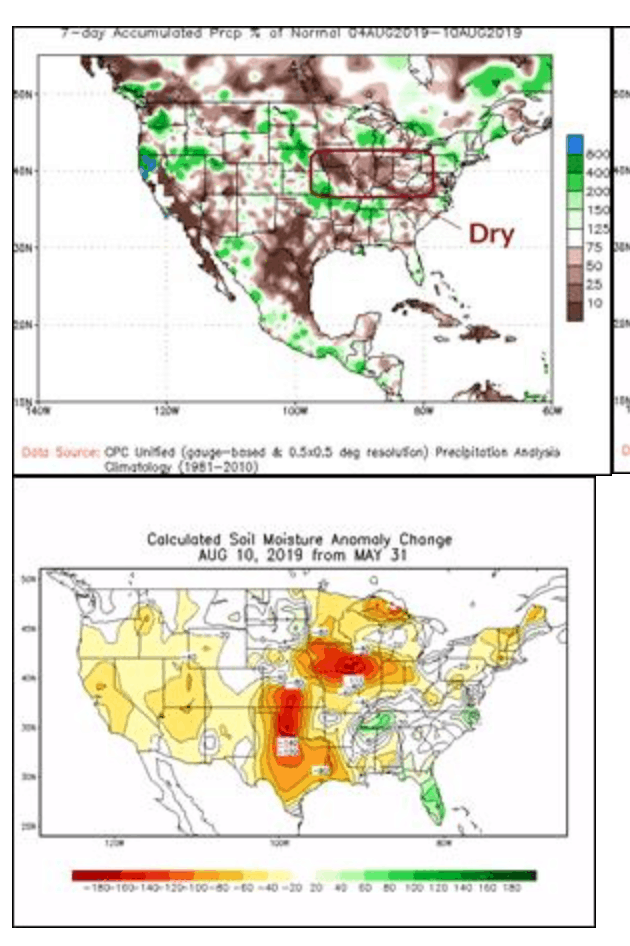
Many farmers and commodity traders were blind-sided by the incredibly bearish USDA crop report on Monday. However, I have alerted paying clients for nearly 2 weeks that the following fundamentals would potentially result in a bearish August 12th crop report. Even if it was not a bearish report, a return of warmer Midwest weather to speed up crop maturity and rains for the dry central and eastern corn belt would likely pressure corn prices soon. In addition, I wrote an article a month ago that the hot spell hitting Europe and Ukraine would likely NOT result in a reduction in grain crops this summer. Indeed, Ukraine will have a record large corn crop at potentially 36.5 MMT. The recent cool July weather across the Midwest corn belt has not resulted in lower crop yields as many had featured. Excellent subsoil moisture and a lack of heat, fooled many “other” analysts who were only looking at this map (below) of more extreme topsoil dryness. What was surprising was the USDA increase in corn yields. However, we have felt, again, the cool July and August weather would not cause a decrease in yields.
Dryness as of early August. This fooled many other analysts, but not us.
Midwest Rains and Warmer Temps on the Way. How I Forecasted This Two Weeks ago.
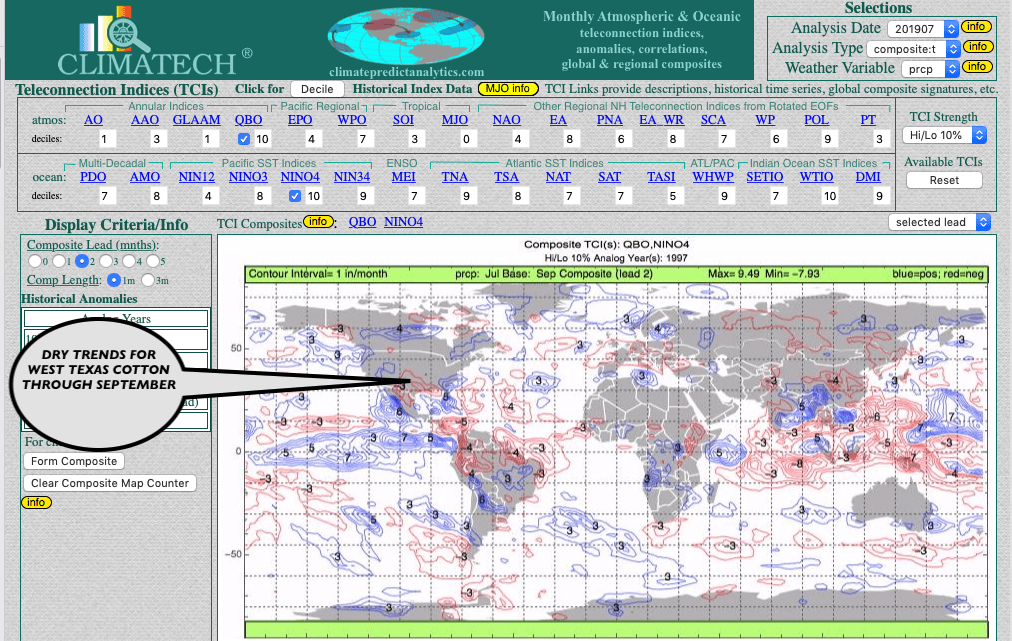
Many analysts thought the USDA would lower corn acreage and yields due to the wet spring and most recent dryness. The USDA is probably being conservative in their Prevent Acreage estimate and may lower acreage further in future reports. However, the dry weather you see above has NOT been a detriment by any means to corn and bean yields yet. In addition, important rains are coming to Iowa, Illinois and Indiana throughout the rest of August. My main concern is for West Texas cotton that may begin to suffer.
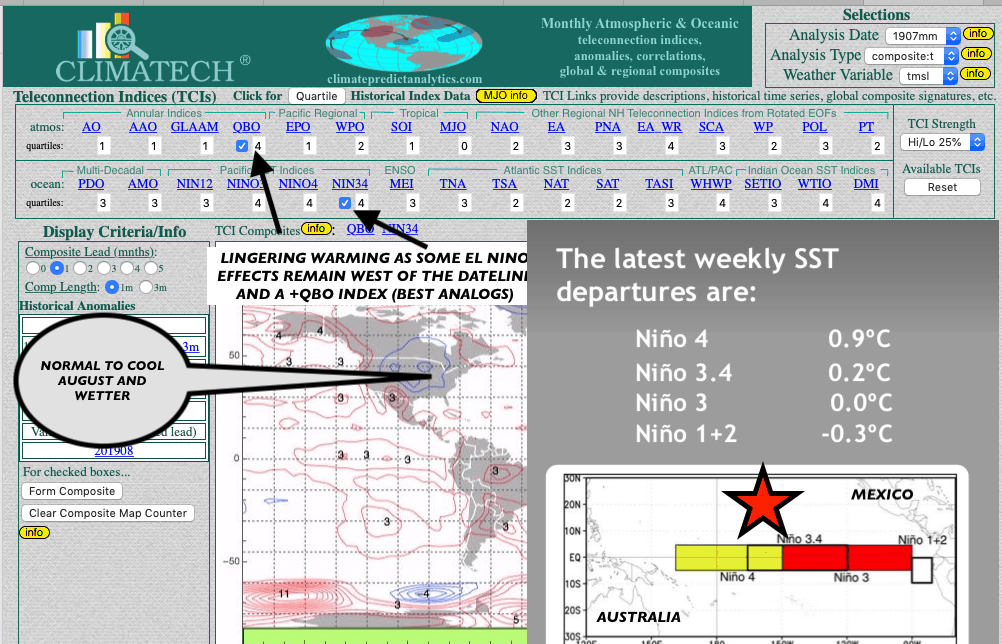
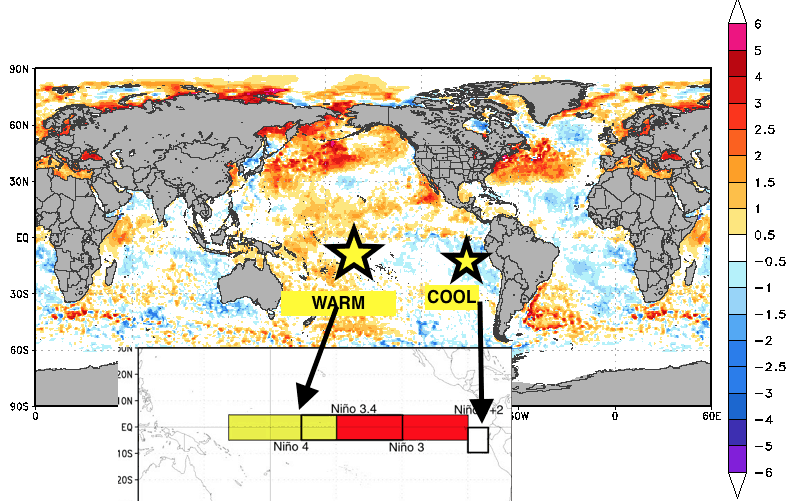
So how did I warn clients close to three weeks ago, about an overall cool pattern extending into August and a return for much needed rainfall? Using teleconnections, such as the weakening El Nino signal and the +QBO index helped us second guess models.
When Nino 1+2 is cool close to the coast of Peru but Nino 4 warmer than normal, we have what we call an El Nino Modoki. Though El Nino is weak, these teleconnections shown by the arrow (below) will cause US corn and soybean conditions to hold stable or increase slightly the next few weeks. On the other hand dryness may continue for west Texas cotton.
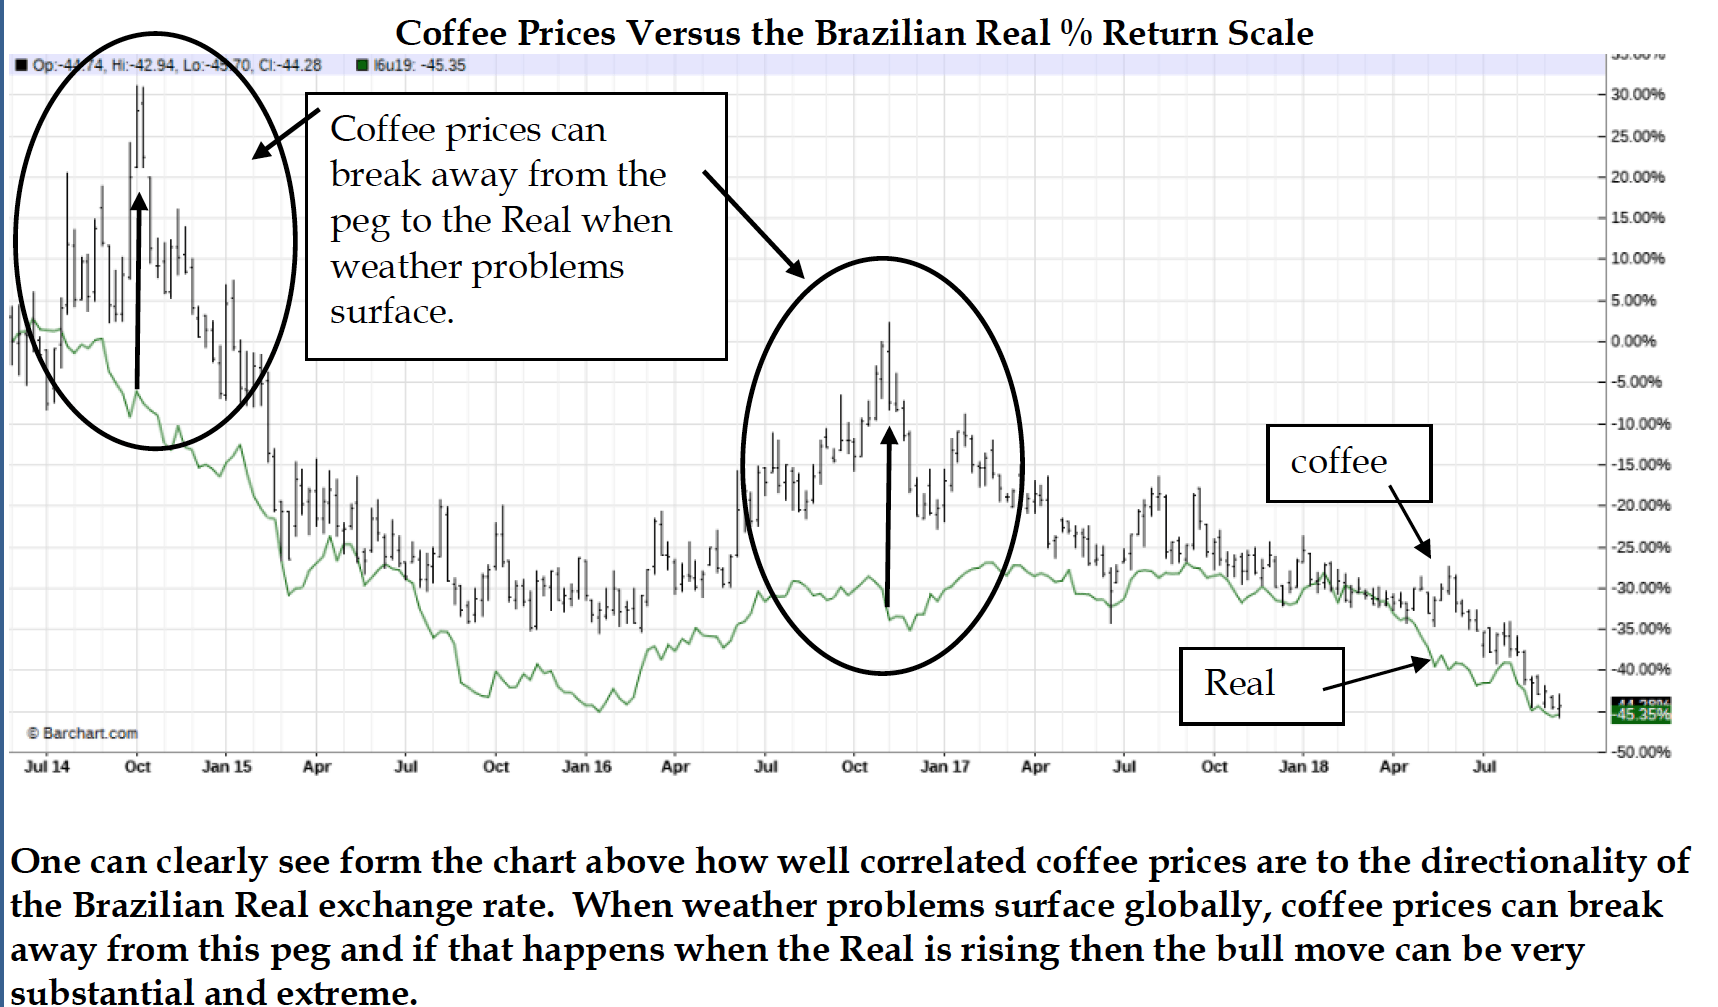
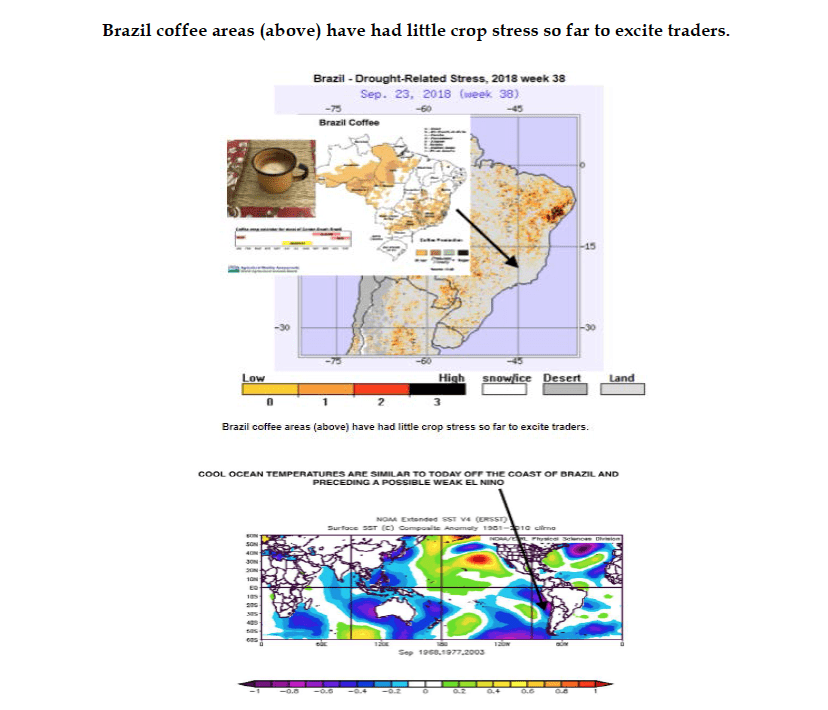
Until this week, the coffee market had defied the big, record short position in the market as it continues to muster its way through bear market territory. The International Coffee and Cocoa Organization (ICCO) recently increased the 2018-2019 Brazil coffee crop again, while the Brazil Real has stayed under pressure. We showed some charts regarding the relationship of coffee prices to the Brazil Real in the September 20th issue of Climatelligence Report (HERE)
Without going into too much detail, the biggest Oct-December drought to Brazil coffee in the last 30 years occurred in 1985. Contrary to popular belief, the 1985 coffee drought occurred during weak La Nina conditions. Dry Brazil weather historically occurs during El Nino events. However, NOT all El Nino’s are associated with lower global coffee yields and higher prices. This scenario occurs about 50% of the time. With deforestation, a growing problem in Brazil, El Nino’s can add to the woes of coffee crops, especially further north in the Robusta coffee regions. Robusta coffee is the “lower quality”instant type coffee, you may buy in a “jar” at your local grocery store. It is grown, not only in Brazil, but also in Indonesia and Vietnam.
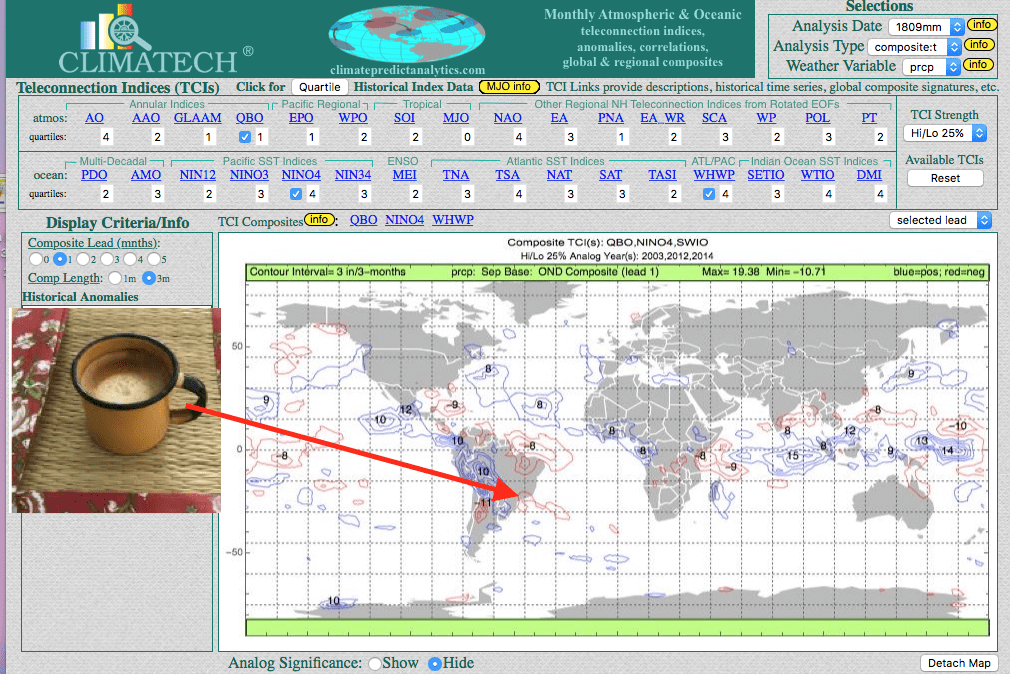
Anyway, until recently, the map below illustrates that the lack of Brazil related crop stress at this time, has prevented any bull market in coffee. Nevertheless, three analog years that have similar ocean temperatures around Brazil are listed below (1968, 1977, 2003) tended to have drier than normal weather heading into October or November-December, which is the important “bloom stage” for coffee. While we do not have a coffee chart for 1968 and the world has certainly changed a lot since then, the report below illustrates how coffee prices bottomed sometime between October-December in both 1977 and 2003.Nevertheless, markets look ahead and our unique, long-range weather forecast model CLIMATECH, shows at the top of the page, the potential for dry weather (red) over “portions” of Brazil’s coffee belt during the important “bloom” period over the next month or two.
(Map above)–The lack of crop stress in Brazil (dryness red/brown is away from the coffee areas). However, this could change over the next month or two
SUBSCRIBE HERETO OUR WEEKLY COMMODITY NEWSLETTER AND GET THE ABSOLUTE BEST WEATHER FORECASTS AND MARKET IDEAS FOR GLOBAL COMMODITIES. GET 25% OF THE NORMAL $1200 YEAR COST FOR 42 ISSUES, FOR A LIMITED TIME. WILL THE COFFEE MARKET EXPLODE ON GLOBAL WEATHER PROBLEMS IN THE MONTHS AND WILL SUGAR AND OTHER COMMODITIES BOTTOM? FIND OUT BY SUBSCRIBING
CLIMATECH—-HURRICANE SEASON; 2001 ANALOG PATTERN MAY POINT TO NO EL NINO
I mentioned back in May that I thought the hurricane season this summer and fall would be “weaker” than normal with low chances for a MAJOR hurricane in the Gulf Coast and perhaps Florida as well.
However, I mentioned if there was any risk it would be along the East coast of the United States, possibly.
Here we see CLIMATECH on the left. The 3 teleconnections are most similar to today and the 2001 analog. 1) The -QBO and near record easterly stratospheric winds; 2) Nino 1+2 is cooler than normal near Peru; 2) Nino 4, however, is showing warmer than normal temps in the central Pacific.2001 remained mostly an El Nino neutral year through the winter.
This has to do with an El Nino neutral setup currently. The fact there is NO El Nino present yet, illustrates that the hurricane season is heating up. However, the map to the left shows how in 2001 almost all the major hurricanes were out in the Atlantic.
The Map to the right shows the forecast for September 13th and a “possible” major strike along the east coast of the United States.
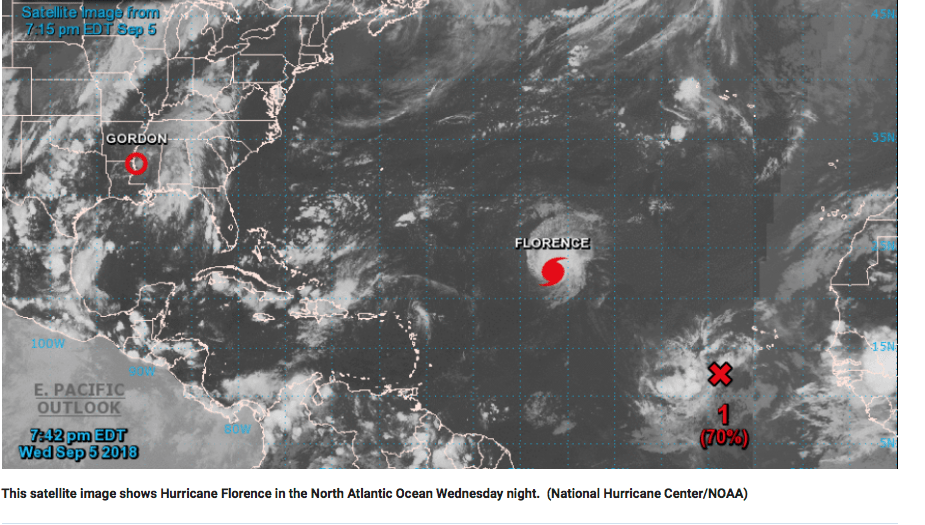
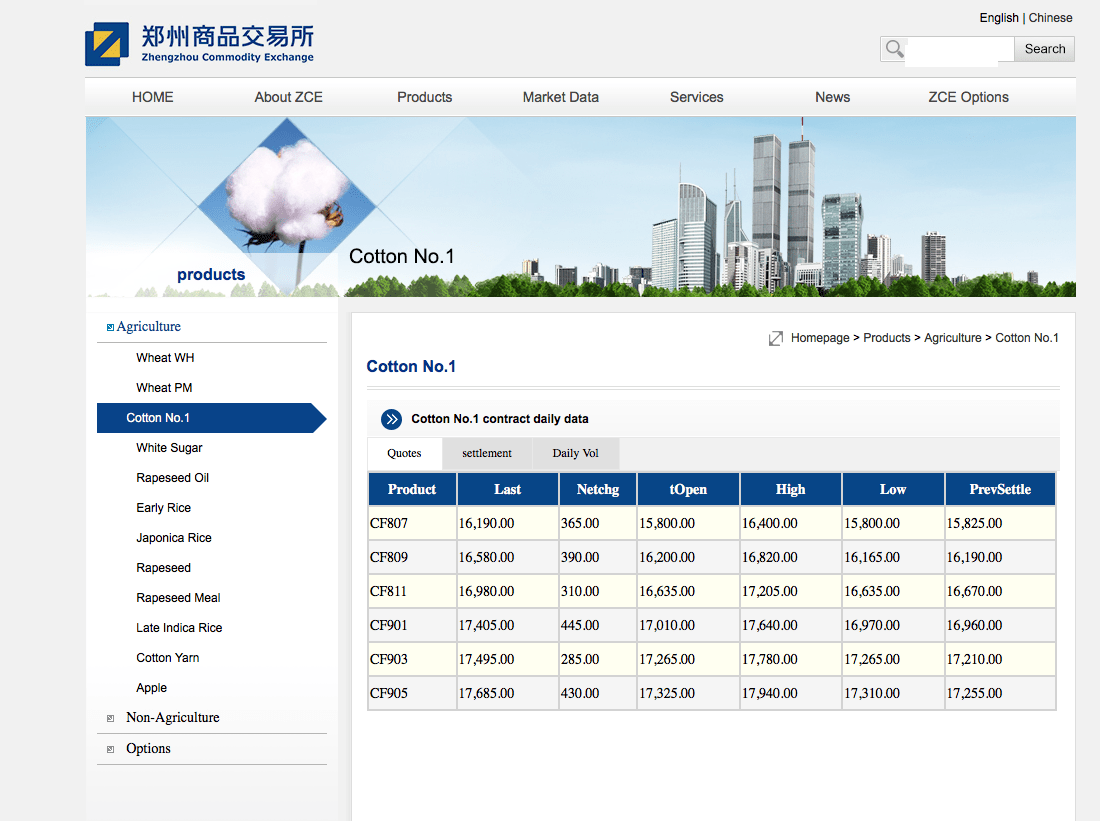
Hurricane Florence could have market impacts in the cotton market and stocks some as Home Depot (HD) and other markets. Our Climatelligence newsletter will discuss which markets will be impacted and for how long. However, historically, impacts to the cotton market are only temporary and often an over-reaction. However, will weather problems develop in other parts of the world for cotton?
The stars above represent teleconnections that are similar to today. The map to the left (above) is a look at the total hurricane season for 2001.
(click on maps above to see a bigger image)
(above). The cool ocean temperatures near Peru and warm waters east of Australia are signs that El Nino could be slow to form, if at all. We will be watching this over the next few months, as how these ocean temperatures change will have a huge impact, not only on the rest of the hurricane season but for the energy , soft and grain commodity markets in the months ahead.
The grain market has been battling the best U.S. corn and soybean crop conditions in more than 20 years, plus trade war worries with China.
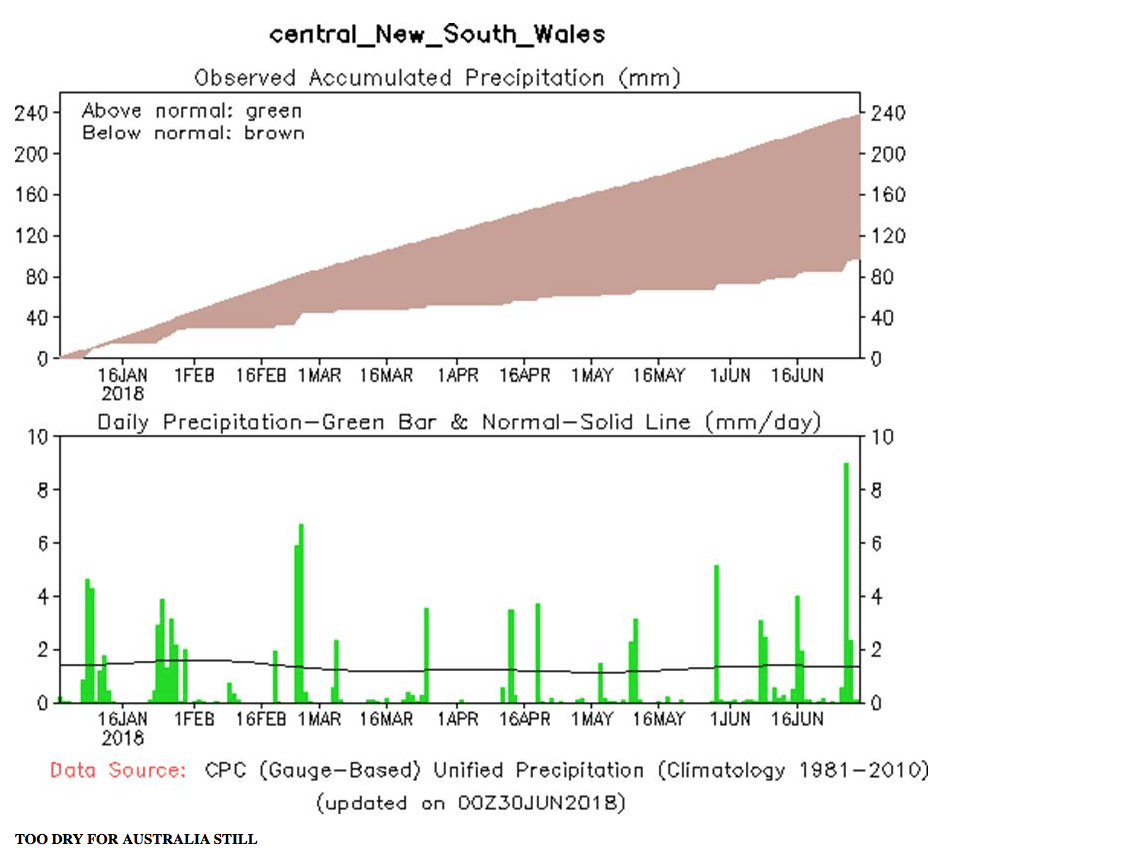
However, the one grain that continues to witness global weather problems is wheat. After a drought in the Plains, which sharply lowered wheat production this spring, both the French and Russian wheat crops are coming down, due to previous dry weather. In addition, rains in Australia have not been enough to alleviate a 5 month old drought. With El Nino possibly forming later this year, this opens the door for further worries for some wheat crops.
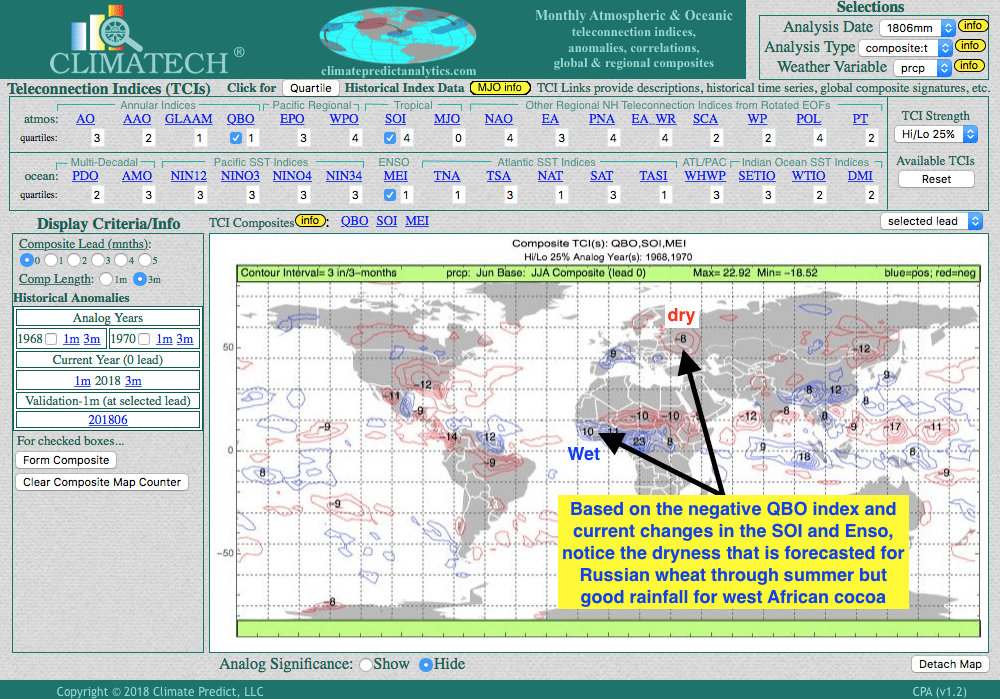
Our medium term weather forecast product CLIMATECH, along with our own separate research, continues to suggest that Russian and/or European wheat crop prospects will fall in the coming weeks. However, painting a bullish scenario is “questionable” given that huge global stocks remain in wheat, trade tarrifs and what has been, mostly, excellent early summer crop prospects for corn and soybeans.
So why then, do wheat prices continue to tumble, every-time there is a short term bullish weather concern? It all has to do with huge global stocks continuing to haunt the market and worries over a Trade War, not just with China, but Canada and other countries.
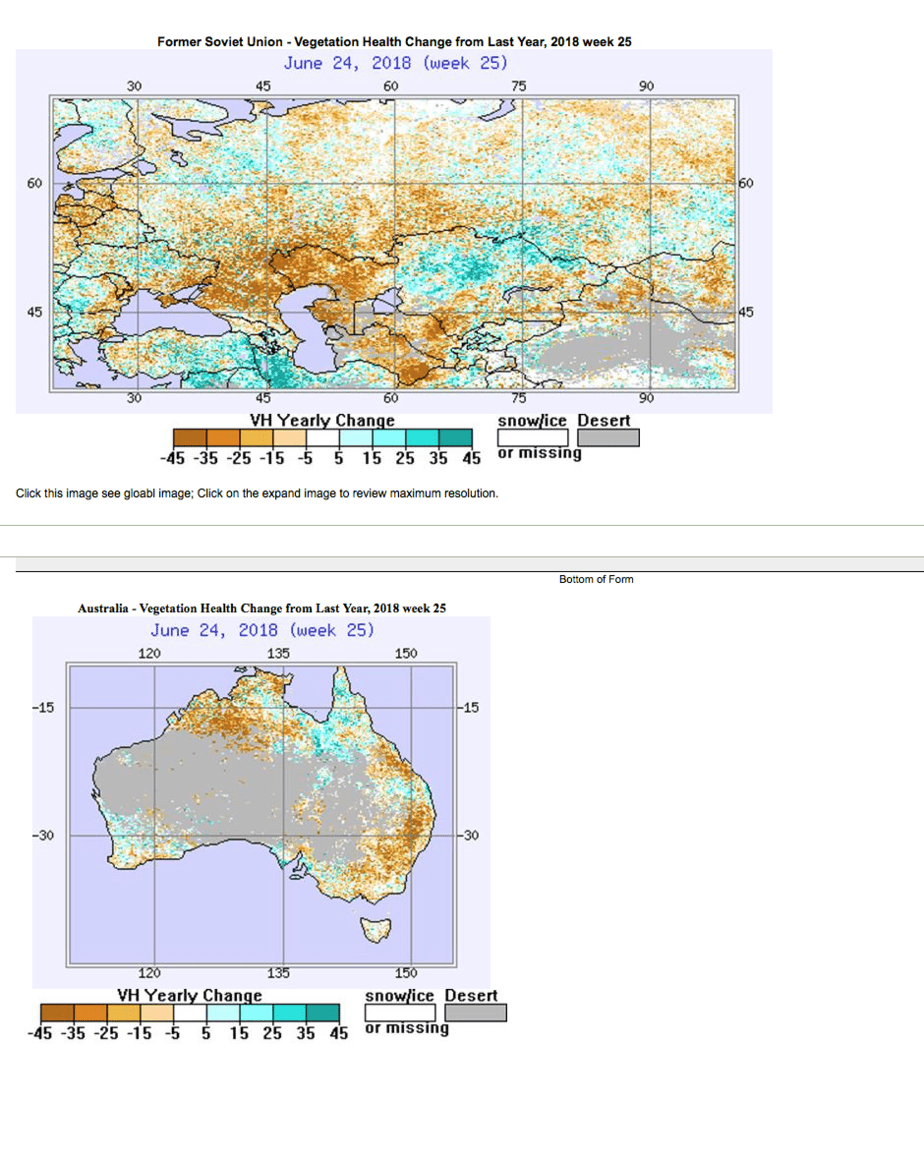
Notice (above) how much worse crop conditions for wheat are vs a year ago. The orange shows regions of crop conditions worse than a year ago that will likely continue.
Shown below in brown and red are the dry regions that are threatening wheat crops in parts of Russia and Australia
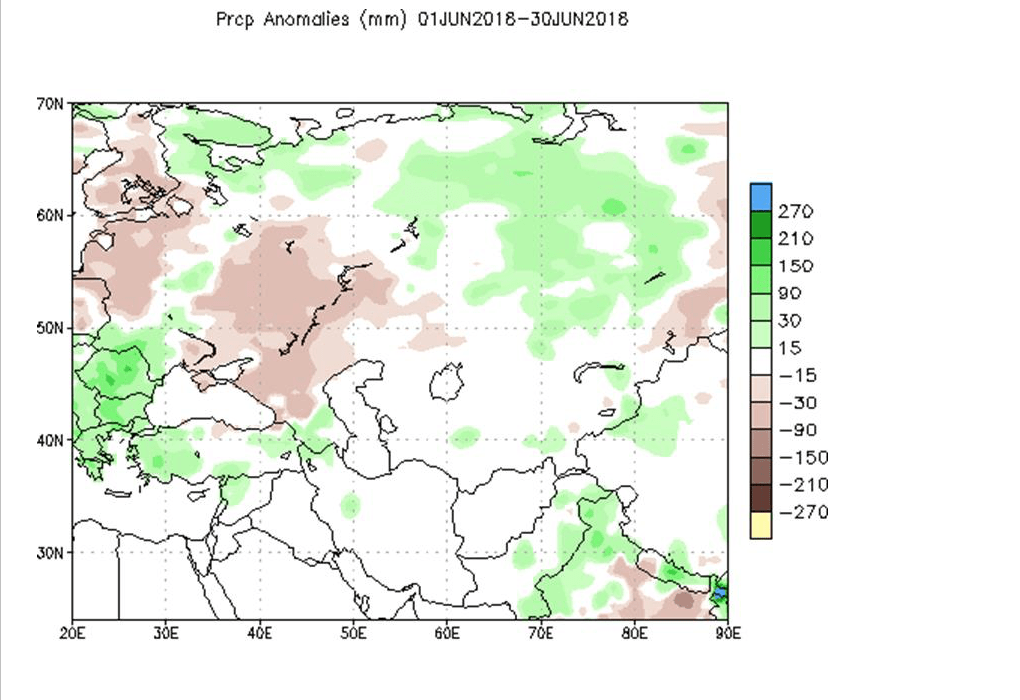
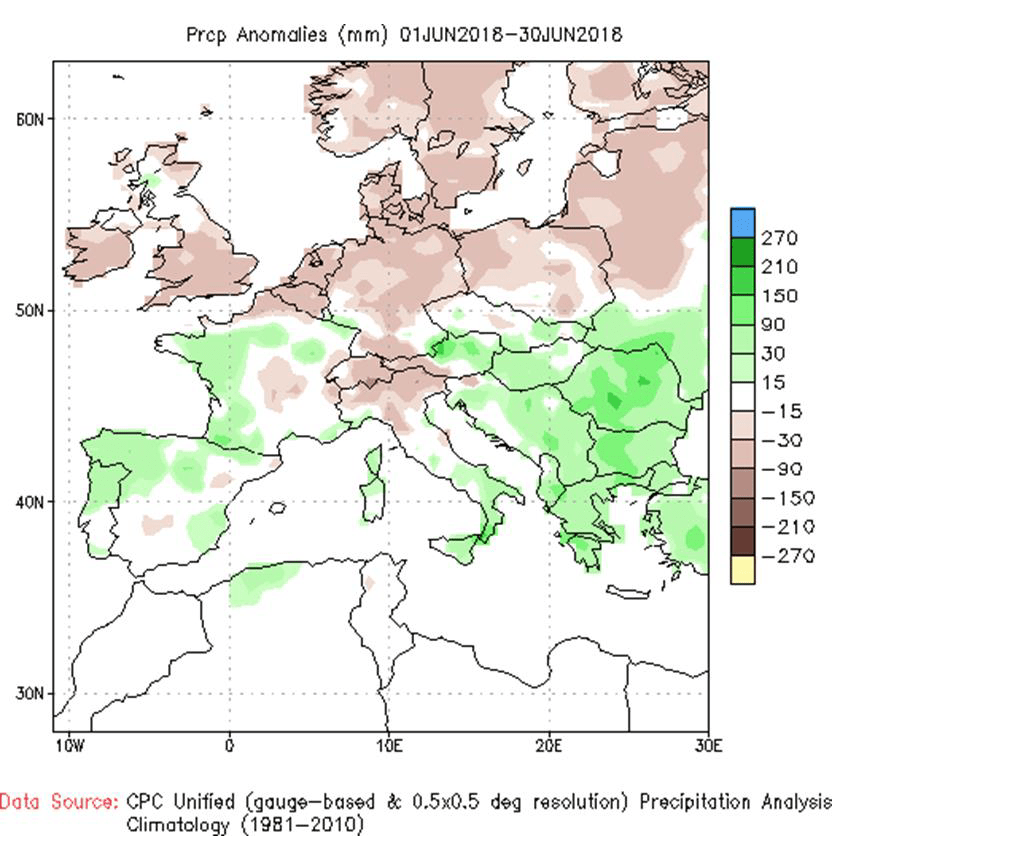
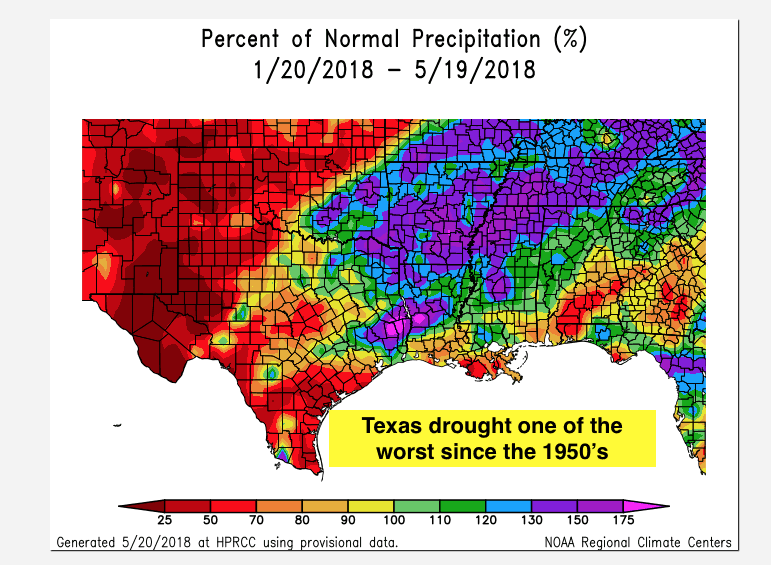
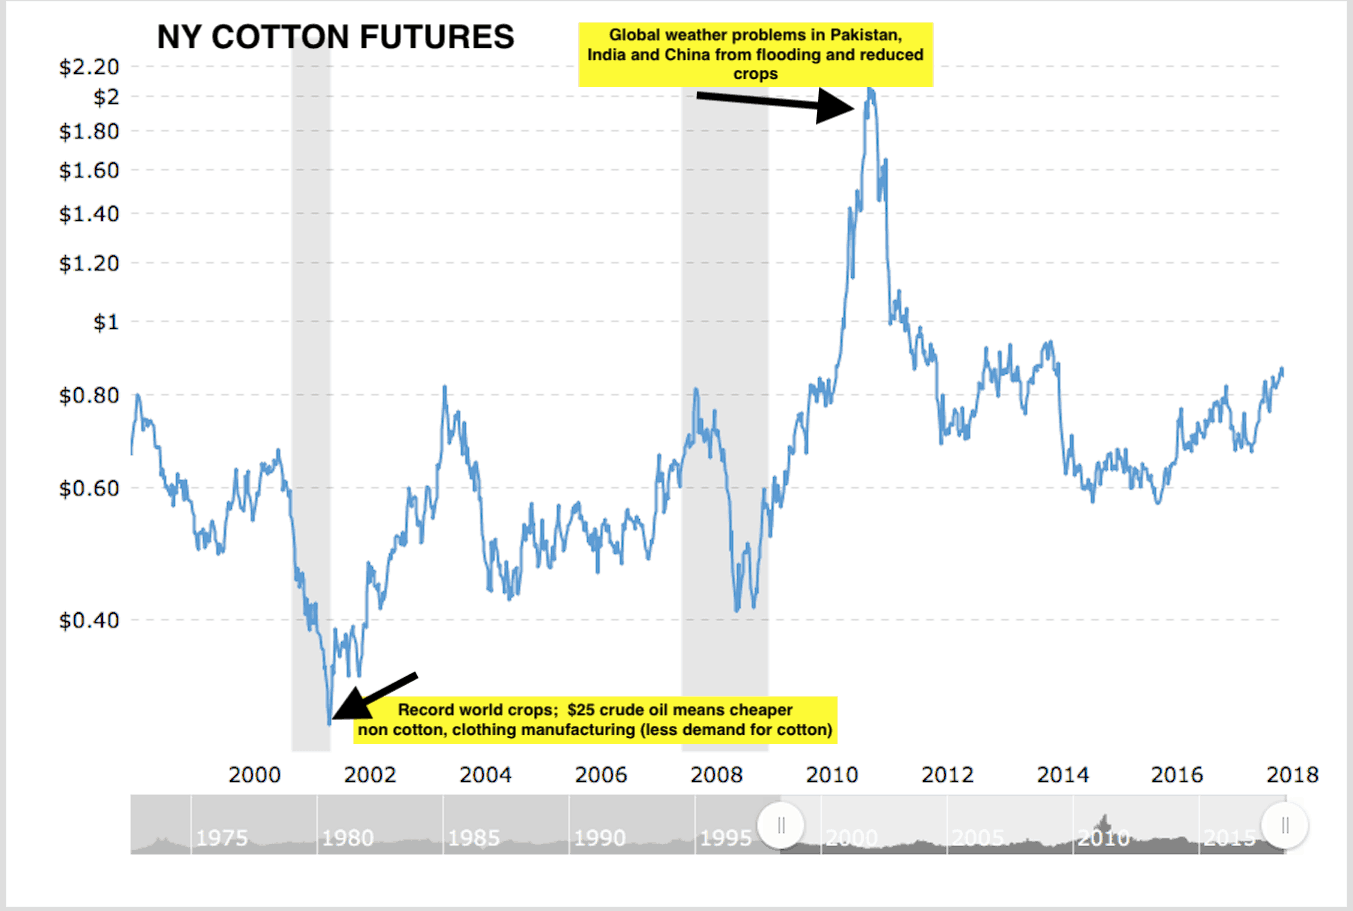
Cotton has been the only consistent bull market in agricultural commodities for more than 6 months. This was brought on by global economic growth, stronger demand and lower production expectations. Yield short falls are likely in Texas, where the worst drought since the 1950s threatens millions of cropland acres. An ugly weather wrinkle is rearing its head in China. Stirring new weather problems together with lower Chinese cotton production, add a bit of easing in trade tensions with the U.S. and we have the right ingredients for this bull market to continue.
.
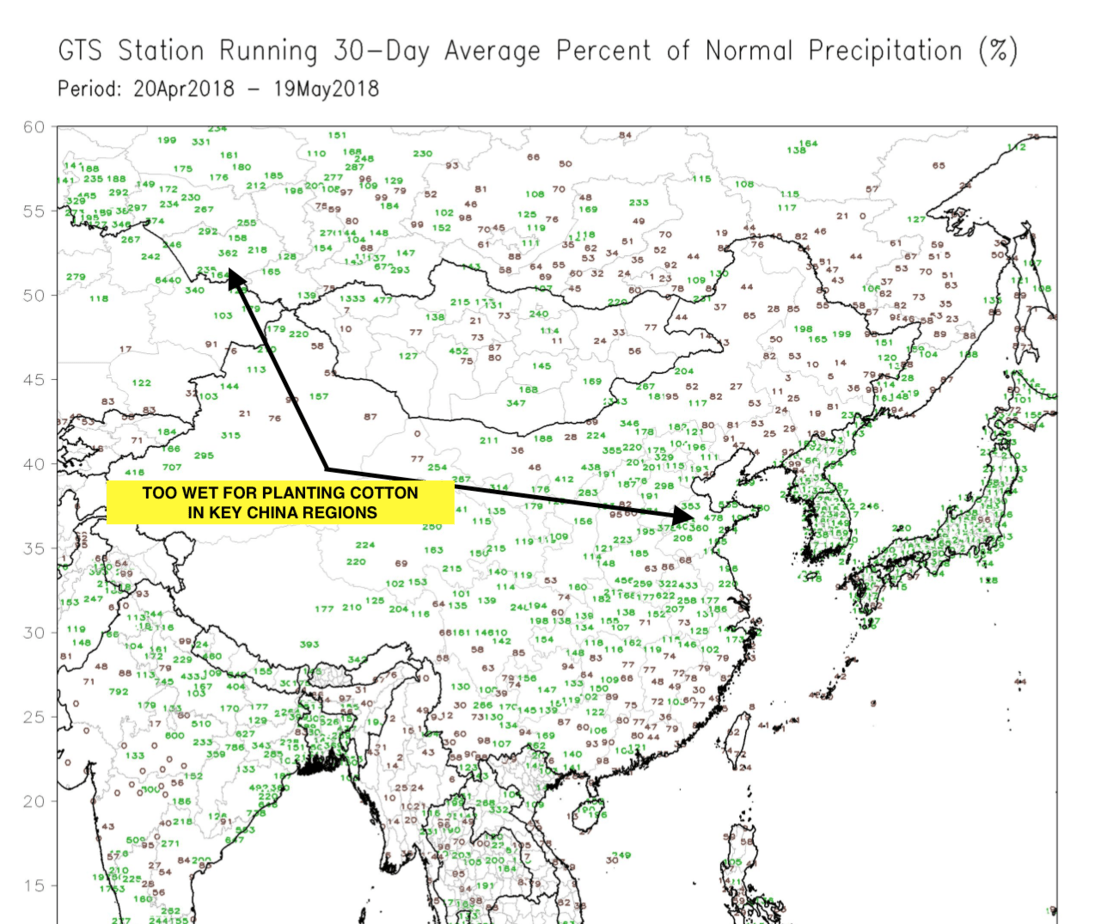
2017 saw $5.8 billion in U.S. cotton exports, and China was the top destination. Futures on the Dalian Commodity Exchange have surged to a 4 year high after bad weather hit crops in Xinjiang, the #1 producing region. Declining stockpiles may cause China to
import more cotton from the U.S.
The map below shows the above normal rainfall that has hit key China crop regions in the last few weeks. Re-plantings will be necessary, but, based on our forecast, wet weather could reduce crop yields in the weeks and months ahead.
COMMODITIES THAT WILL WIN FROM TRADE WAR TRUCE WITH CHINA
Once again, weather will be a key factor in major Ag products. Hence, I expect the traders will soon begin to focus on what spring and summer weather has in store for growers.
For more information about how to trade cotton futures or the ETF (BALB), and what our forecast is for global production this year, please email us here
HELPING YOU MAKE THE BEST INVESTMENT DECISIONS BASED ON THE WEATHER
We use cookies to ensure that we give you the best experience on our website. If you continue to use this site we will assume that you are happy with it.OkPrivacy policy