The report below discusses various global weather occurrences and factors that make me feel that El Nino conditions exist, globally. This is in contrast to most computer models and weather forecast firms. The Taal volcano could possibly alter some computer model forecasts.
El Nino
Global weather acting like an El Nino
Grain Weather—
After a stellar rally in soybeans the last month on ideas of a truce with China and the potential for more major soybean purchases in the months ahead, generally ideal South American weather has (at least for now), topped out the soybean market. Typically, during El Nino type events, Argentina corn and soybean crops are spared any major weather problems. In fact, usually yields are above normal for grain crops
While wheat prices continue to act technically strong, influenced from a variety of factors–1) The highest soft-red wheat stocks in several years; B) Lower US planted acreage; C) The chances of a major reduction in wheat plantings this spring (Australian fall) due to the historical dry soils and fires, excellent rains have hit Argentina soybean areas. This too happens during certain El Nino events, though the record forest fires and deaths to millions of animals must be, at least partly, attributed to climate change.
Warm, stormy US Weather—
Severe weather continues to batter much of the US south, while record warm temperatures can be at least partly attributed to El Nino type conditions.
Tropical Commodity Growing Areas–
Drought easing rains in northern Brazil coffee areas and a warm, dry winter for Ghana in west Africa are also signs that perhaps El Nino has returned. The Indonesian drought is another example
In my view, standard computer models and almost all weather forecast firms are incorrect saying we have “El Nino” neutral conditions. The above mentioned global weather and crop conditions suggest this.
Here are more reasons, below that I believe El Nino is present.
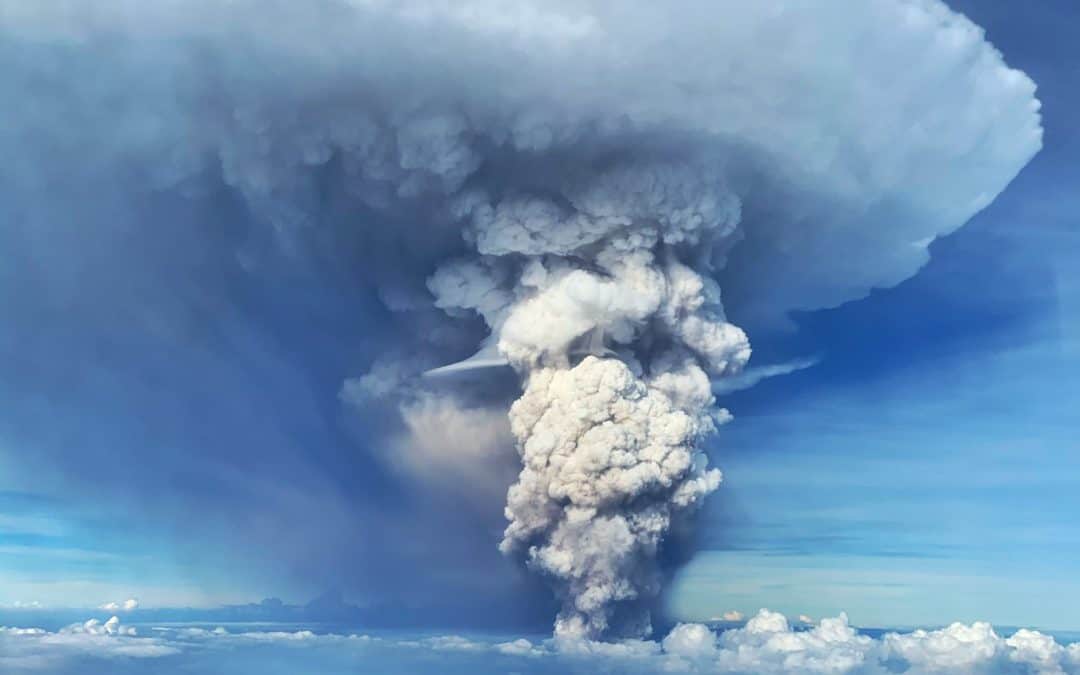
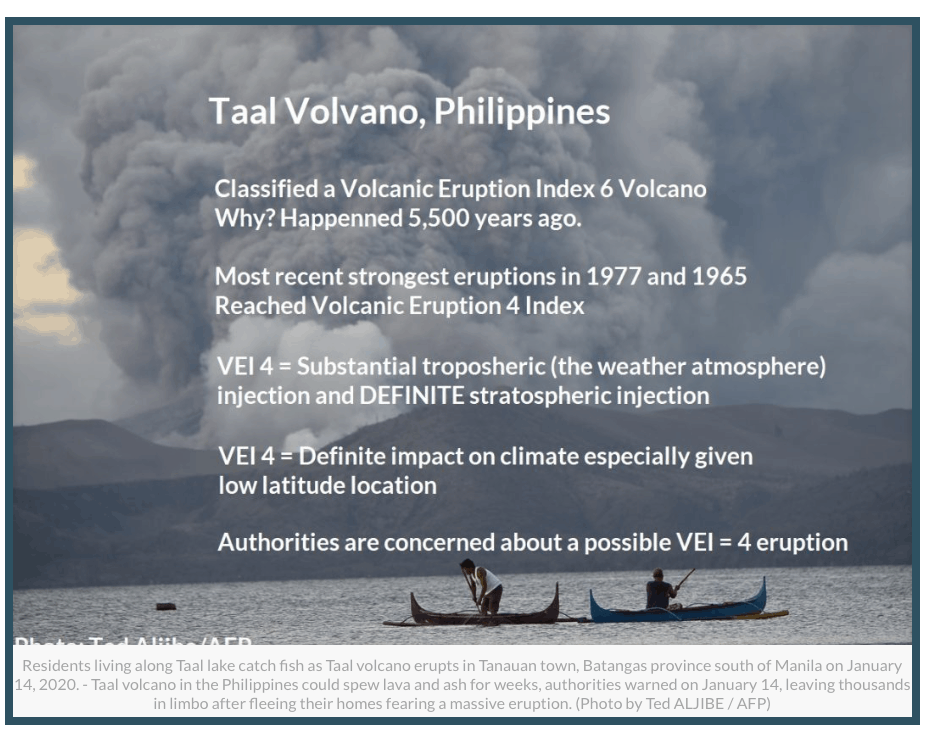
1–Taal Volcano needs to be watched.
If enough ash spills into the stratosphere, this would be labeled a VEI 4 volcano. A VEI 4 has only happened several times in the last 30 years and has been known to help cause an El Nino (Mt. Pinutuba), for example.
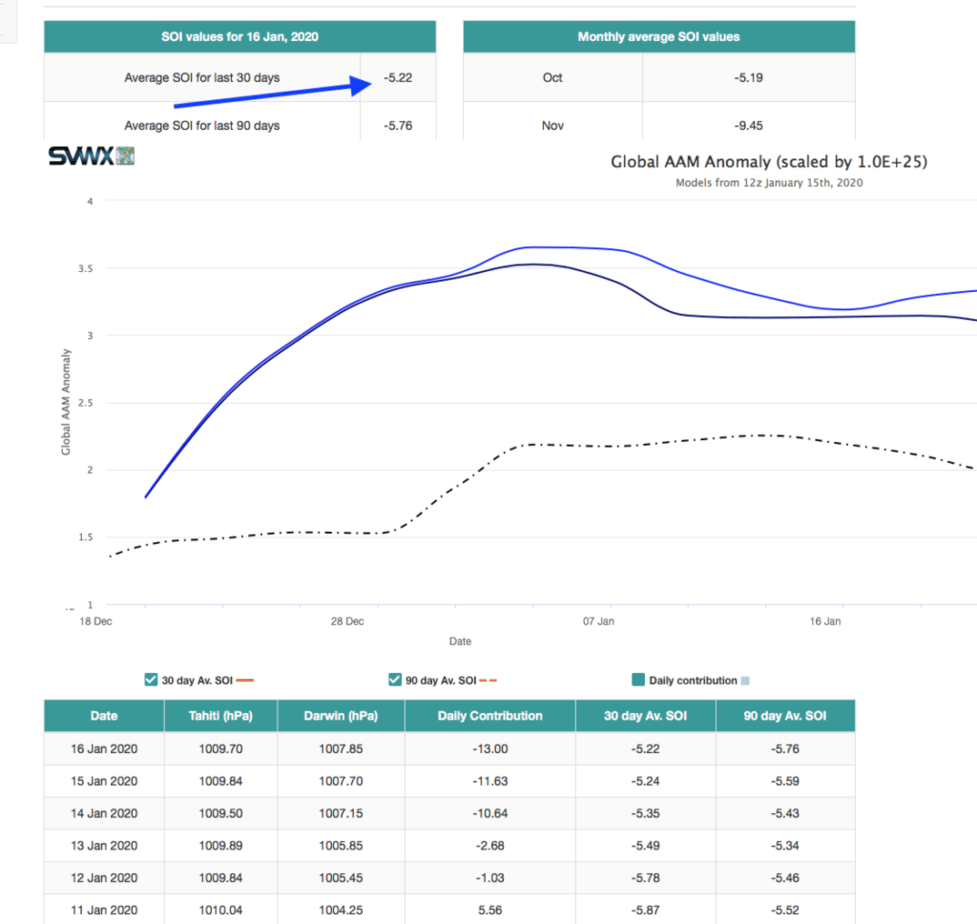
2–SOI index continues to trend negative; while GLAAM is positive
While everyone refers to ocean temperatures in the equatorial Pacific as being key to whether there is an El Nino or La Nina, just as important is the Southern Oscillation Index and whether there is positive or negative Global Angular Momentum (GLAAM).
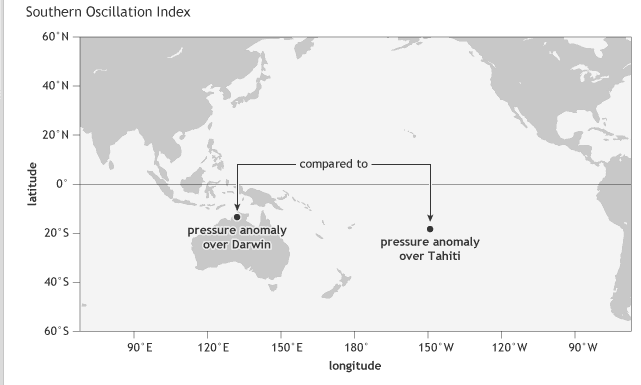
SOI INDEX
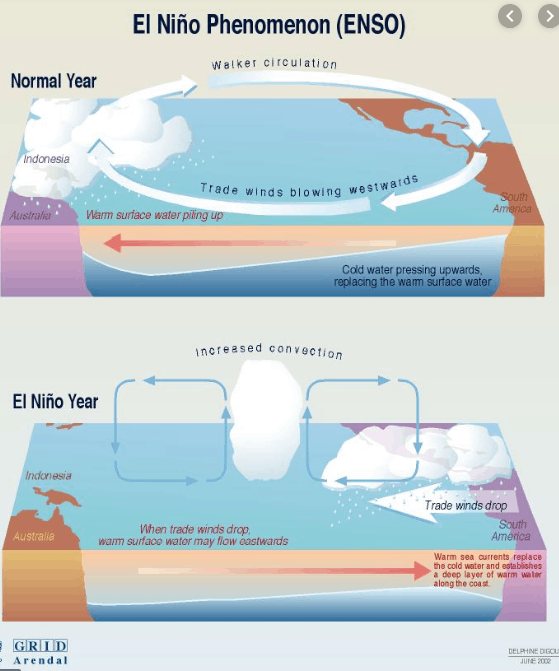
The oldest indicator of the ENSO state is the Southern Oscillation Index (SOI): the difference between the atmospheric pressure at sea level at Tahiti and at Darwin (1). A seesaw in pressure at these locations reflects the atmospheric component of ENSO, discovered in the early 1900s by Walker and Bliss (1932) and others. During El Niño, the pressure becomes below average in Tahiti and above average in Darwin, and the Southern Oscillation Index is negative. During La Niña, the pressure behaves oppositely, and the index becomes positive. Right now, pressures have been lower than normal over Australia, partly responsible for the severe drought and heat recently.
The SOI index has been trending mostly negative for weeks
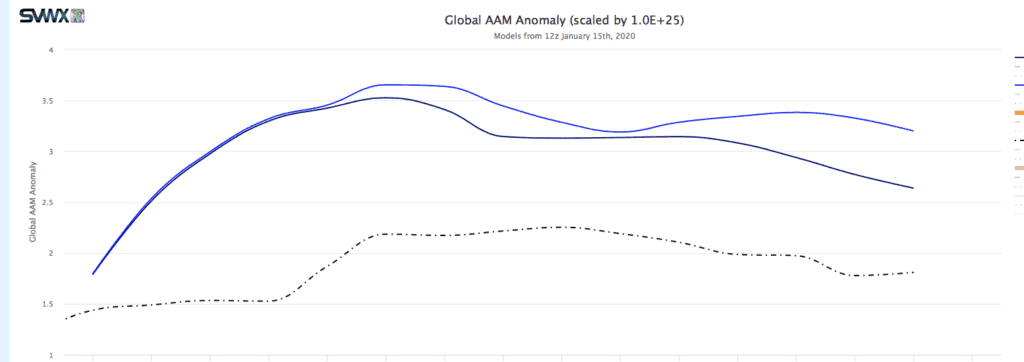
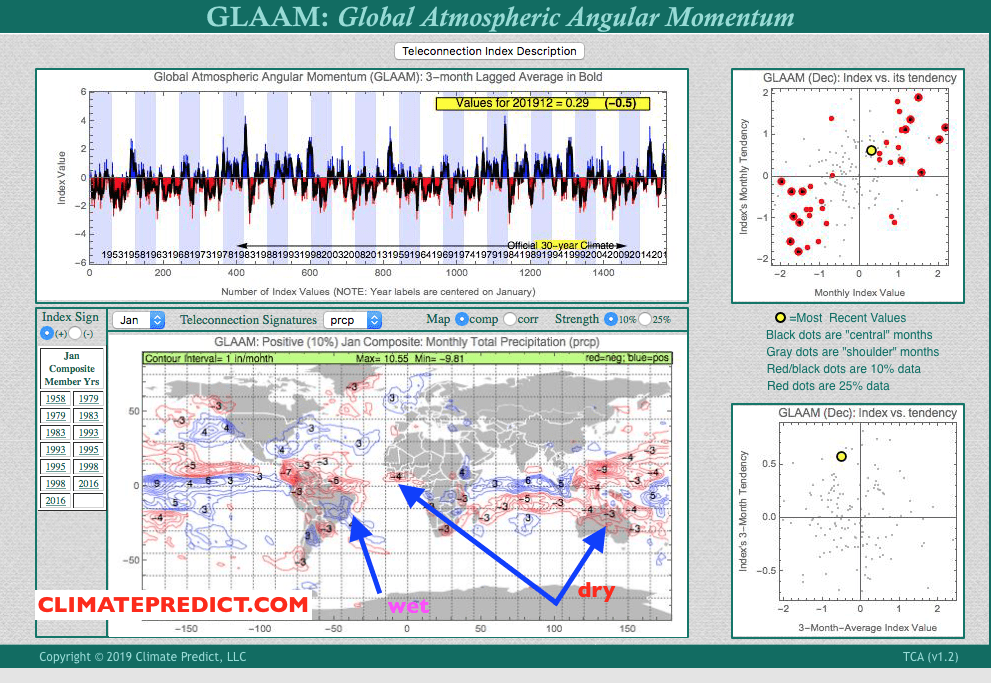
3–GLAAM is trending positive
Another teleconnection that Jim Roemer has been using to forecast El Nino conditions is GLAAM. When it is positive, El Nino conditions can exist. However, this is only true when the SOI index is negative (as described above) and there are warm ocean temperatures in the Equatorial Pacific (we have all of these factors, now).
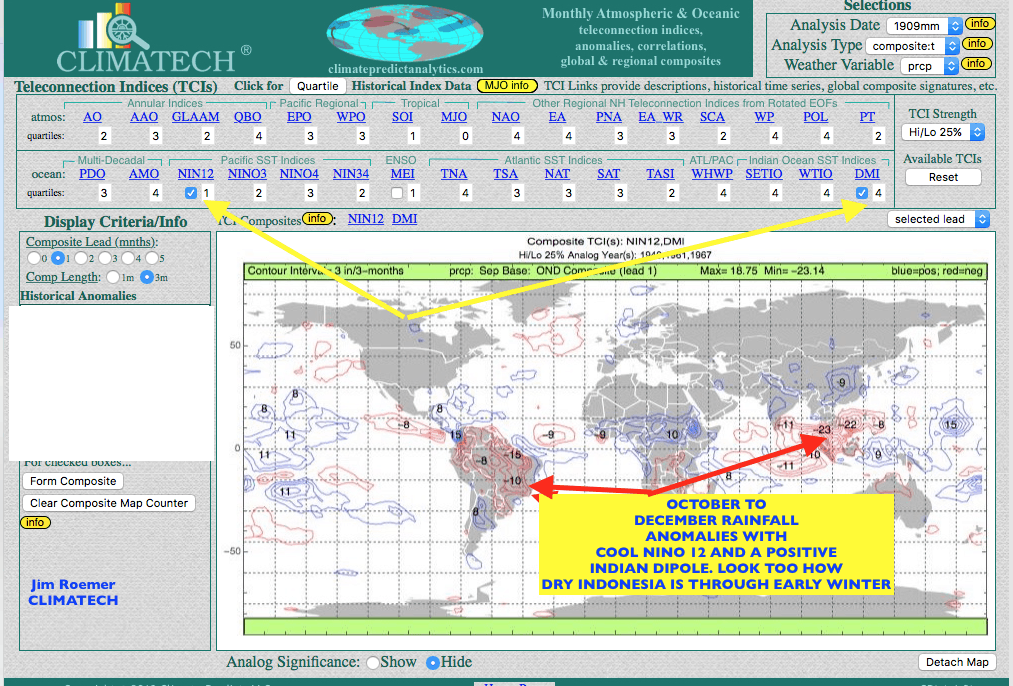
You can see how Jim Roemer’s long-range weather forecast program predicted (below) and easing in the northern Brazil dryness to coffee earlier in January and some heat and dryness coming to west African cocoa. This is associated with +GLAAM values and could well suggest that El Nino, not neutral conditions have been occurring in at least some parts of the world.
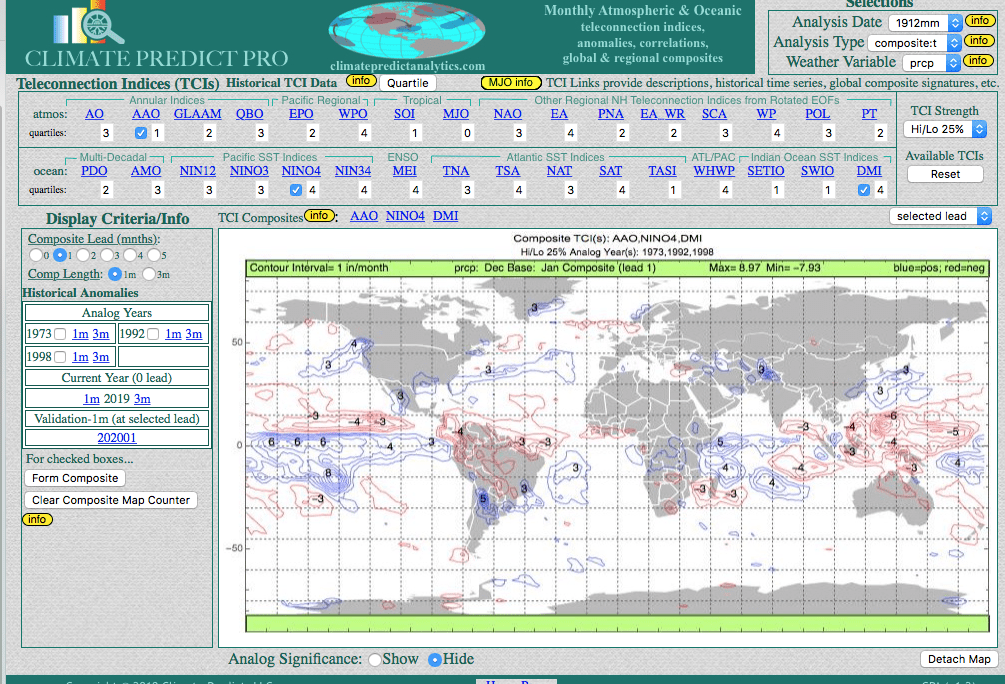
January analog years (left) and global rainfall trends with positive GLAAM
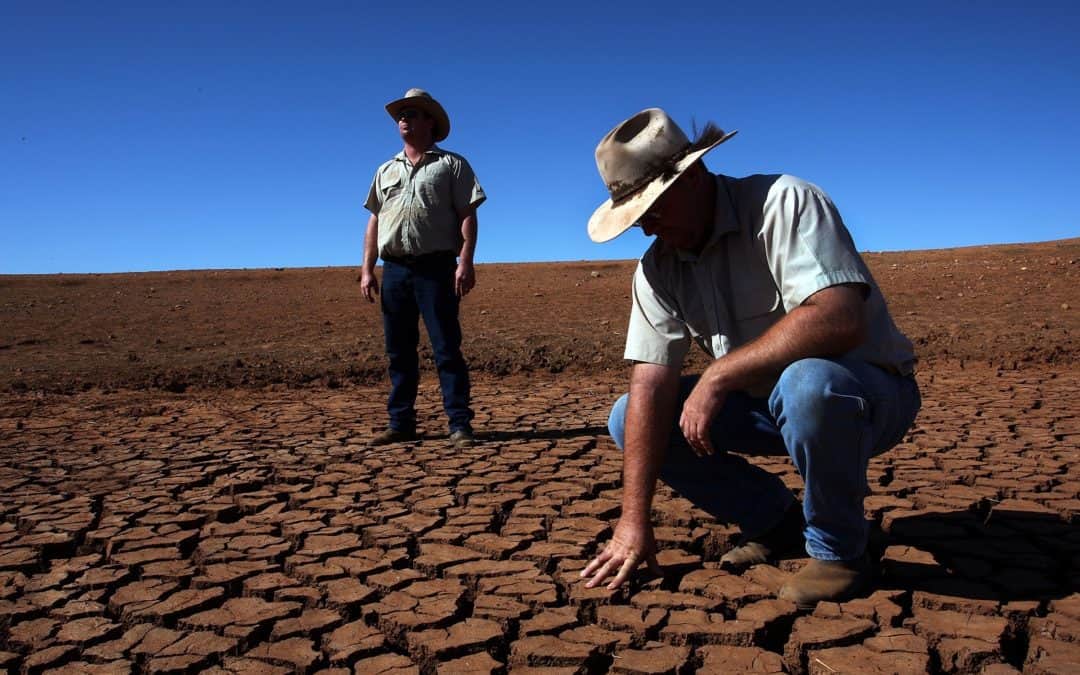
Reasons for the Aussie drought, fires and record heat
It’s a depressing, horrible scene in Australia as numerous wild fires, record heat and threats to wildlife is creating fear and misery. What has been an historical 20+ year boom economic boom could be threatened to be derailed by this historic drought.
There are multiple reasons for the intense heat and back to back Australian droughts; The lingering effects of El Nino in the western Pacific, a positive Indian Dipole, a previous strongly negative Antarctic Oscillation Index and climate change.
Crops such as cotton and potentially sugar and other commodities could be adversely affected heading into 2020. The Aussie wheat crop has already tanked for the third straight year, helping to stabilize the world wheat market a bit.
A dehydrated Koala approaches a cyclist, looking for water in New South Wales
The mid-north coast of New South Wales is one of Australia’s most populous koala habitats, estimated at 15,000-28,000.
Experts believe 480 million animals could have been killed since the start of the devastating fires in September, which have burnt more than 5 million hectares (12 million acres) and killed eight people.
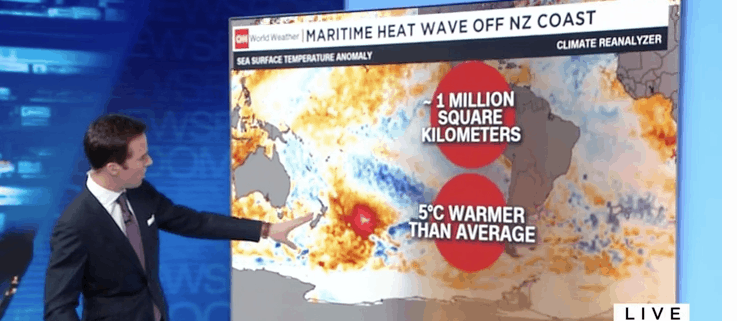
Other than Australia, there could be a big impact to marine life around New Zealand in which record warm ocean temperatures can be seen on ocean temperature maps and from satellites. Cool waters are necessary from upwelling to feed fish and the impact of climate change and all of the meteorological factors I mentioned above could have a negative effect on coral bleaching and more
source:CNN
A Warm US winter putting pressure on natural gas prices—still.
While there have been several weather forecast firms and hundreds of other meteorologists and scientists who continue to preach the near “record low” solar activity would create a cold winter, they continue to be climate change deniers as the world continues to heat up.
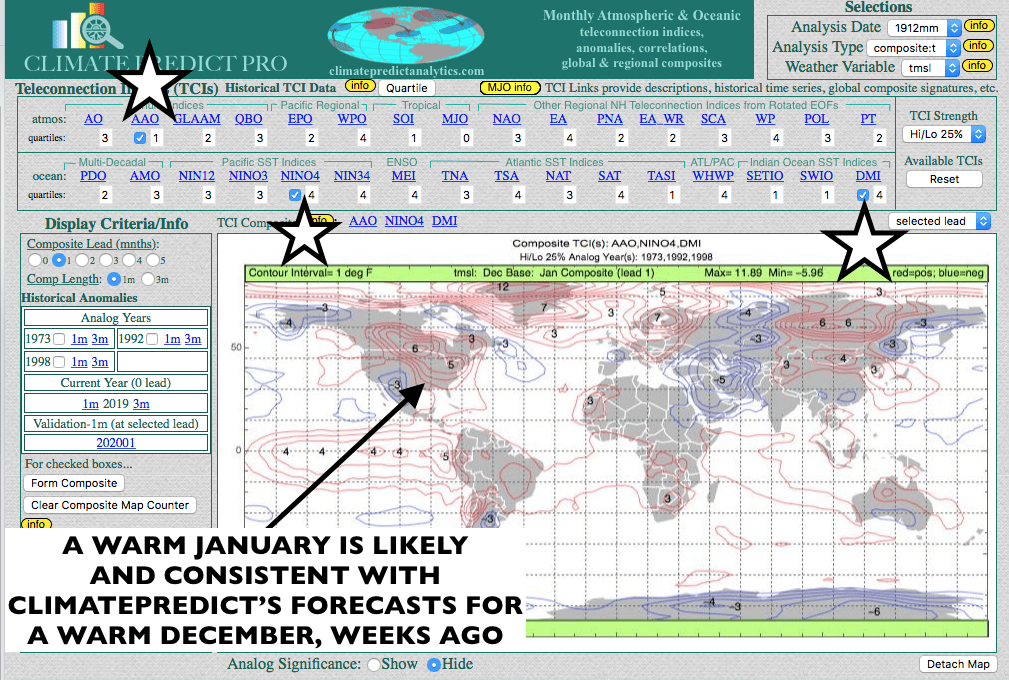
However, there are also three teleconnections that have had the most impact on the world’s weather and represented by the stars (below). The associated January temperature forecast is predicted.
Below we show our in house program (CLIMATEPREDICT) and why we felt weeks ago that a lingering El Nino in the western Pacific, the negative AAO index and positive Indian Dipole would continue to result in an overall warm winter in the Midwest and east, with the western US having the colder temperatures and great winter skiing conditions.
There may be a coastal Northeast or New England snowstorm within the next week, but overall, any sustained cold weather is unlikely till later this winter.
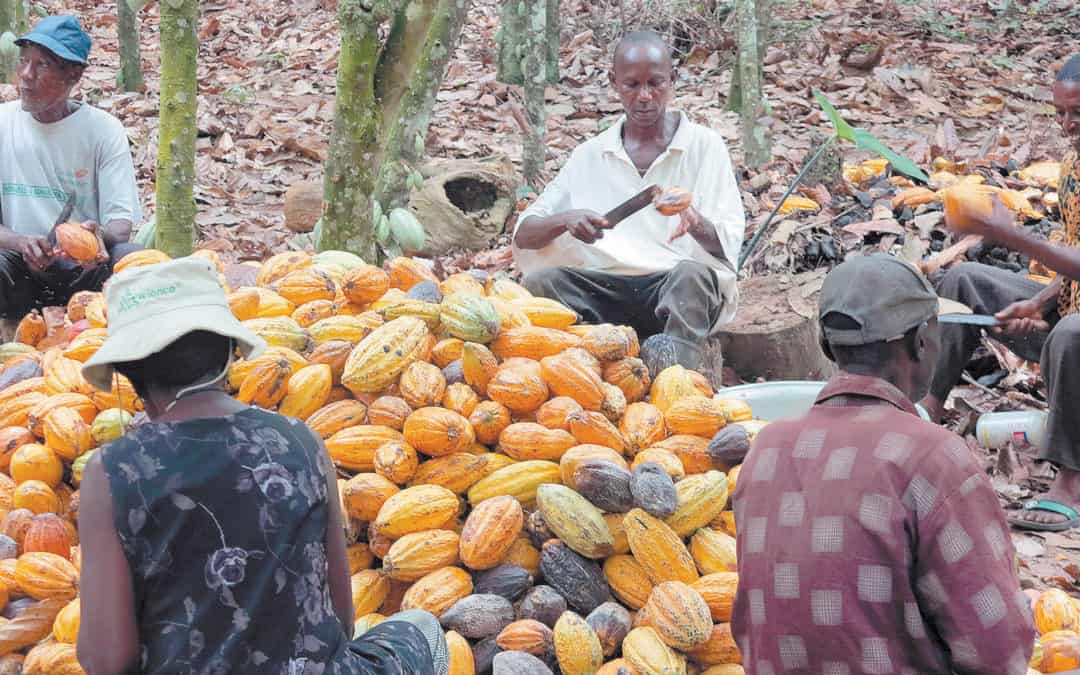
After generally stellar crop conditions for the 2019 west Africa cocoa crop, all eyes are now turned to whether strong dusty NE winds in Africa could potentially impact cocoa production heading into 2020.
Swollen Root Virus was reported in more than 15% of Ghana’s cocoa region this year, brought on, but what I believe is at least a partial factor from a warming climate and climate change. While Ivory Coast is plush with pods and had great rainfall all during 2019, the possibility exists that a re-emergence of occasional El Nino conditions this winter, combined with something we call a positive North Atlantic Oscillation Index could bring some occasional harsh conditions to west Africa cocoa the next couple months.
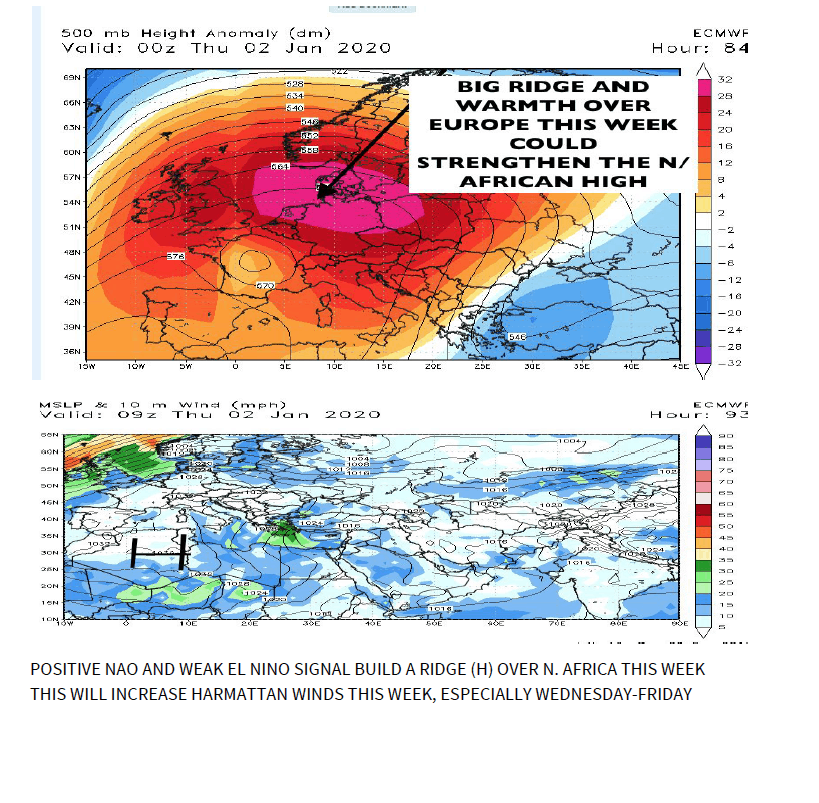
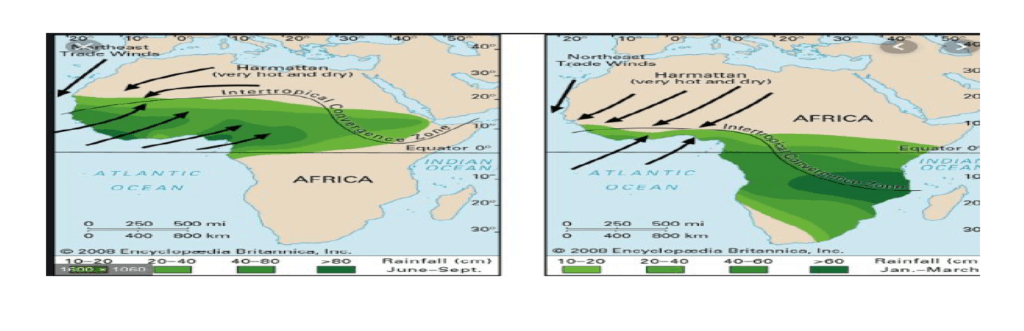
The Harmattan does not occur every year, but when high pressure builds of North Africa, Europe tends to have a warm winter and strong NE winds can bring Sahara dust into west African cocoa regions
The map above shows the typical climate scenario for a Harmattan in west Africa. Until this week, weather conditions have been fine, but I began telling premium clients last week that I thought the first strong Harmattan wind of the season would arrive the first week of January.
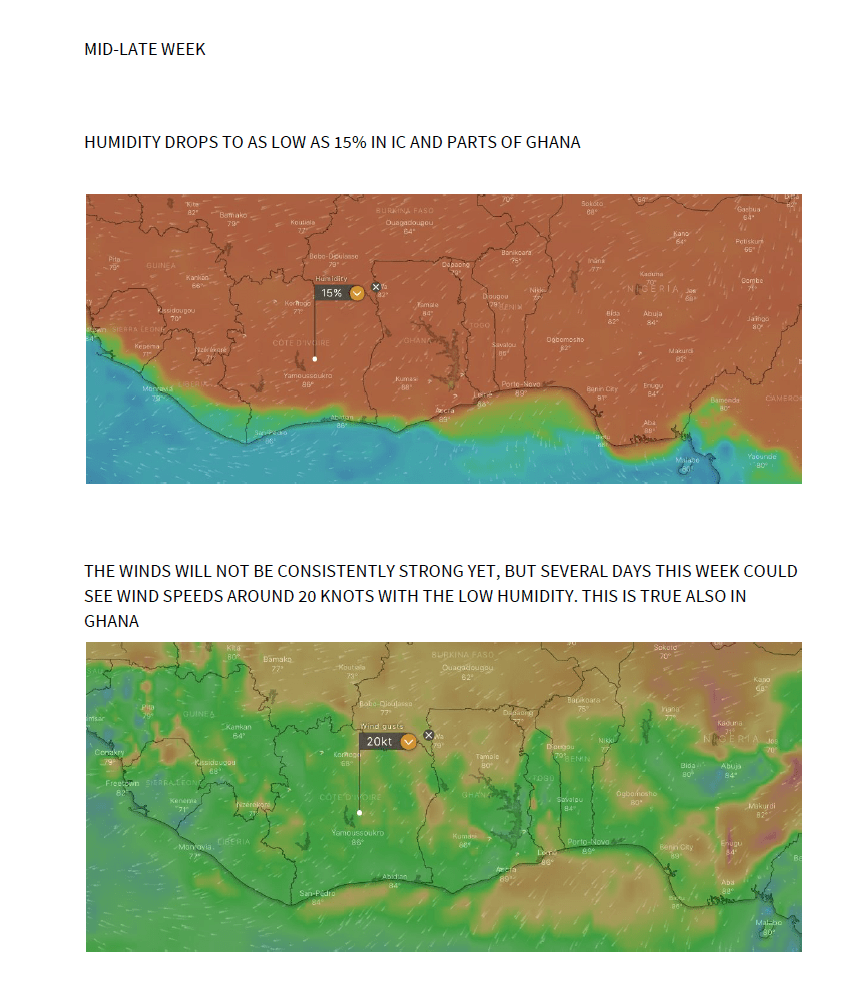
One can see above how winds could be as strong as 20 Knots in Ivory Coast and possibly Ghana this week and humidities drop to under 15-20%.
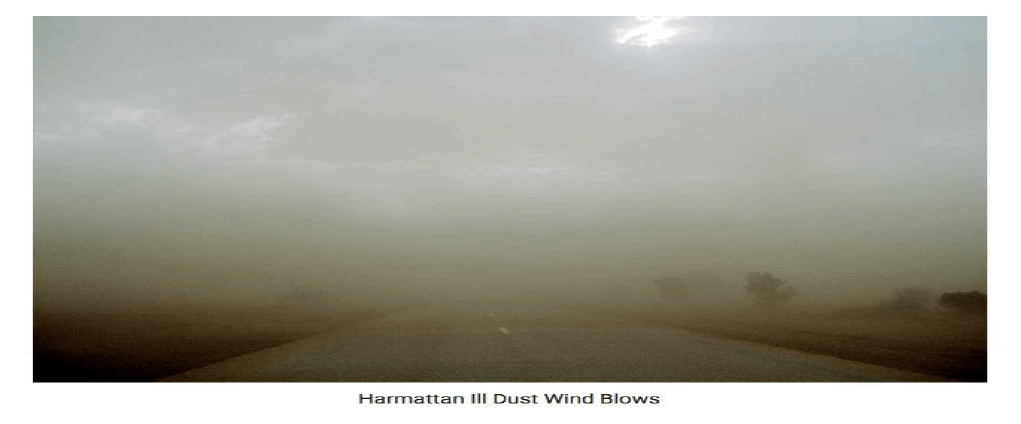
So what does a typical Harmattan look like? The image below shows the dust from the infamous 2015-2016 El Nino event that greatly zapped the mid-cocoa crop and caused widespread respiratory problems for many people throughout Africa.
I believe the advent of the Harmattan is one of several factors affecting cocoa trading again. What is my long range forecast and will things change in the weeks ahead? Subscribing clients get first hand daily details.
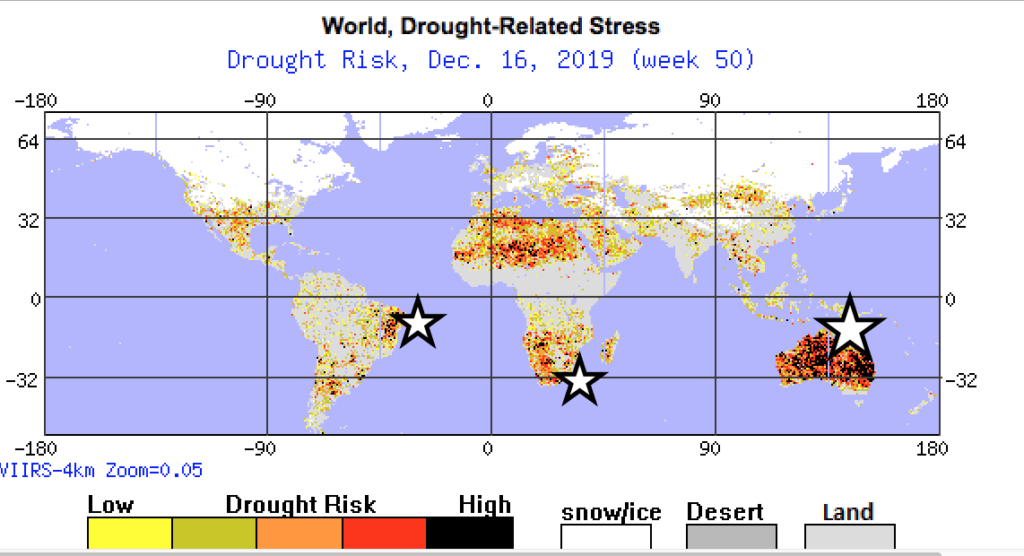
Droughts in NE Brazil (just barely away from the main coffee regions); a 2-3 year drought in Australia with more record heat coming up; drought in South Africa that may affect millions of maize and other farmers; raging fires and drought in Indonesia, more big time snows out west; and heavy rains and some flooding from Florida to Georgia, etc. later this weekend.These climatic tell-tale signs suggest that El Nino conditions have persisted throughout parts of the world.
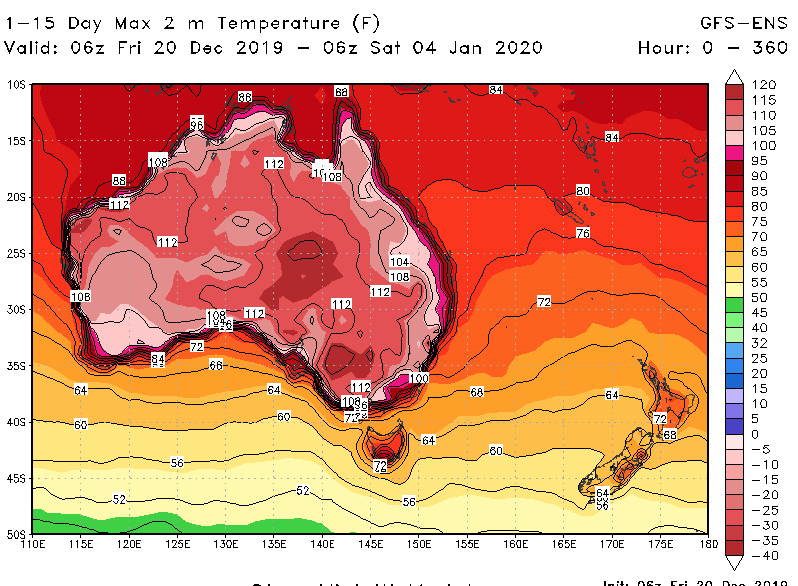
(map above) Temps will continue to soar about 100 degrees in Australia stressing millions of farmland and people who have suffered drought for three years. Nevertheless, the Australian economy has seen record shattering growth for more than 20 consecutive years.Here is an article about the Aussie heat wave.
(map above) Potential global January rainfall trends based on a weak El Nino, a recent negative AAO and positive Indian Dipole. For those of you interested in receiving more of these maps for commodities and skiing throughout the world, please register here for FREE
While some of these conditions are also signals of a warm planet and more climate change, as well as a negative AAO index and a positive Indian Dipole, we have seen since last summer, El Nino type conditions (if they continue), could ease the developing dryness in Argentina the next few months, continue the heat waves and droughts in Indonesia and Australia and bring about a mostly warmer than normal winter December and January in the United States. This is one reason why natural gas prices have fallen.
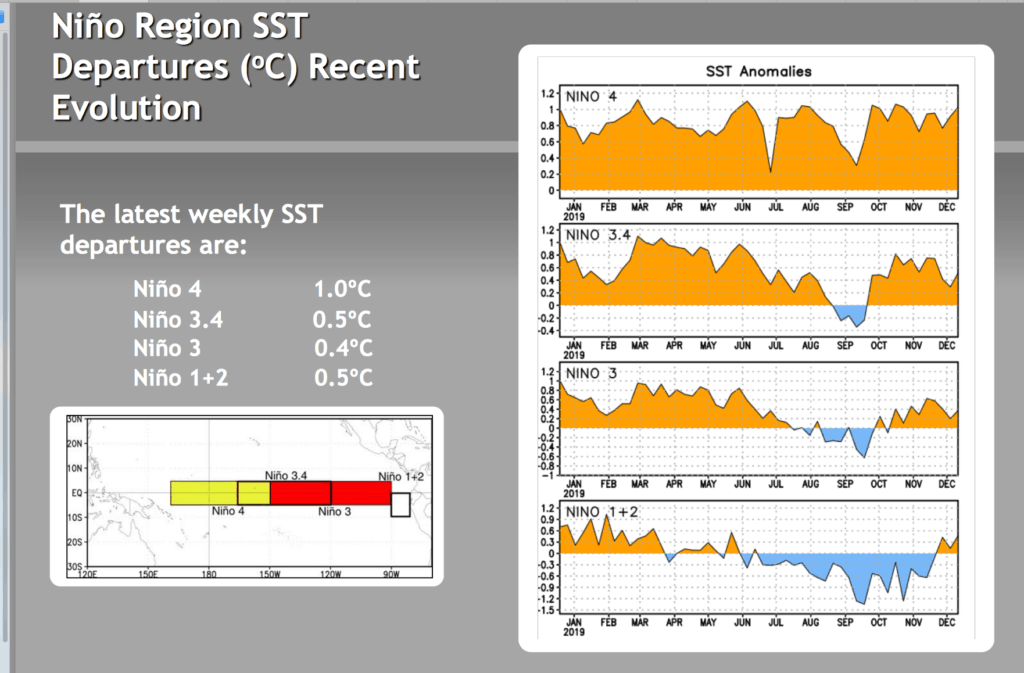
(map above) The continued warming in the Pacific suggests some El Nino conditions again. Though not a strong El Nino, the fact that the SOI index has been negative (high pressure over Australia causing drought) and low pressure near Tahiti), also is an important indicator of El Nino
This weak El Nino event should continue to bless western ski areas and potentially bring important moisture to the Plains wheat regions.
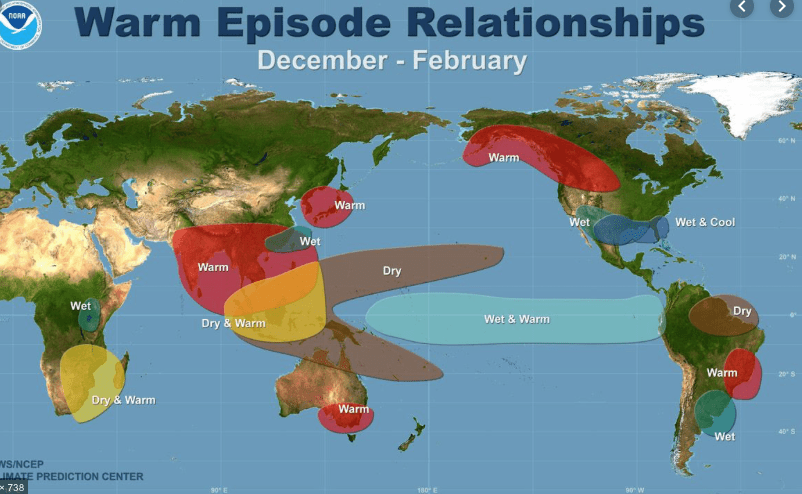
(maps above) The top map reveals typical global weather patterns with El Nino. However, the atmosphere is much more complex than this and El Nino is not the only weather variable currently. On the 2nd map “World Drought Related Stress” , I placed stars in crop regions where El Nino type droughts continue.
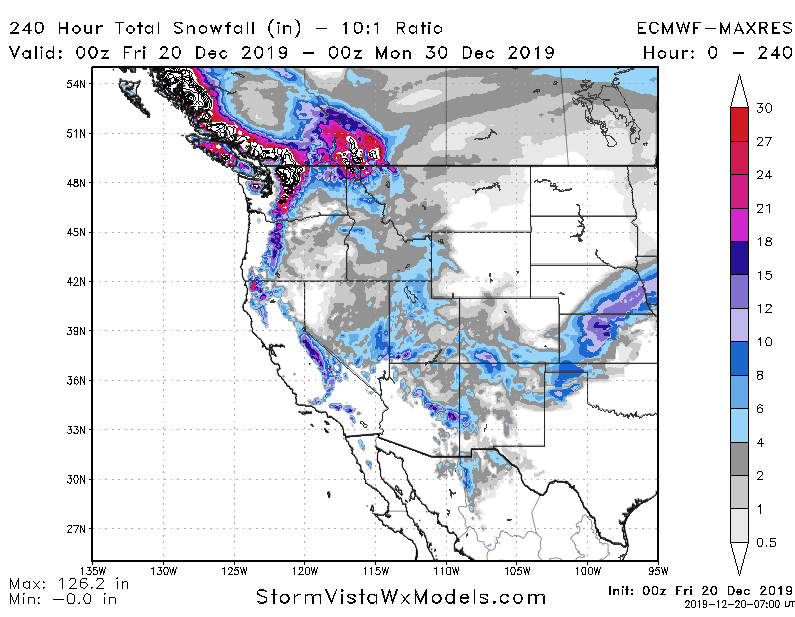
More heavy snows measured in feet will affect the California Sierra ski resorts to ski resorts such as Snowbird, Utah and perhaps much of Colorado and the southwest US. In addition, the warm early US winter and heavy rains and severe weather in the deep South are another strong sign of an El Nino
(map above) Snowfall measures in feet will hit many western ski resorts over the next 2 weeks. This is in part due to El Nino. The map above is conservative showing total snow amounts in inches at the lower elevations.
Many ski resorts from Tahoe to Snowbird and possibly even Taos, New Mexico and southern Colorado, could see at least 1-2 feet.
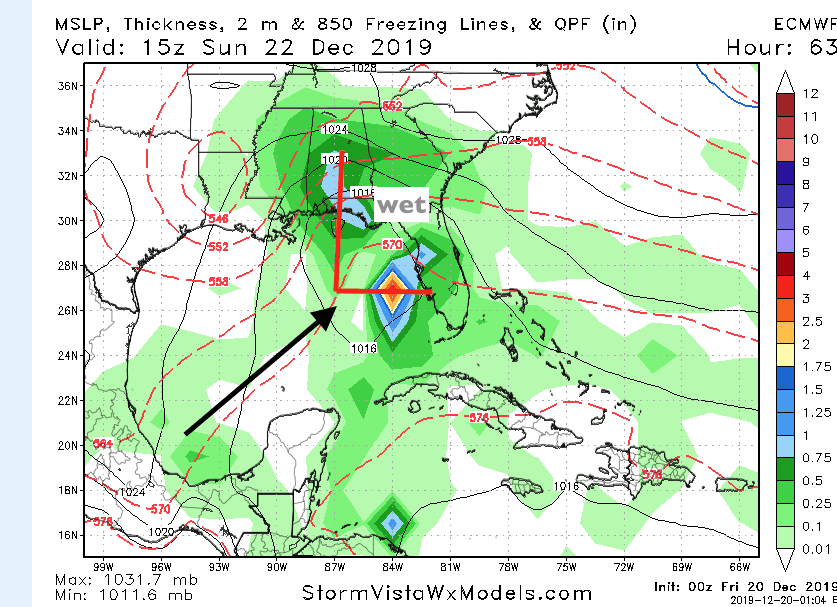
(map above) More severe weather, flooding this weekend in parts of Florida to Alabama and Georgia.
I have a new weather feature that can be accessed for FREE by amateur and professional meteorologists, ski resorts, university science professors and anyone that is a snow lover, or hater. It is called CLIMATE PREDICT (lite version) HISTORICAL SNOW MAPS.
This snow feature will allow anyone to search a 70 year data base for any month of their choice and to see how global teleconnections (such as El Nino, La Nina and ocean temperatures thousands of miles away) influence global winter snow cover. If you are interested in receiving FREE access, check back soon for details or email me at
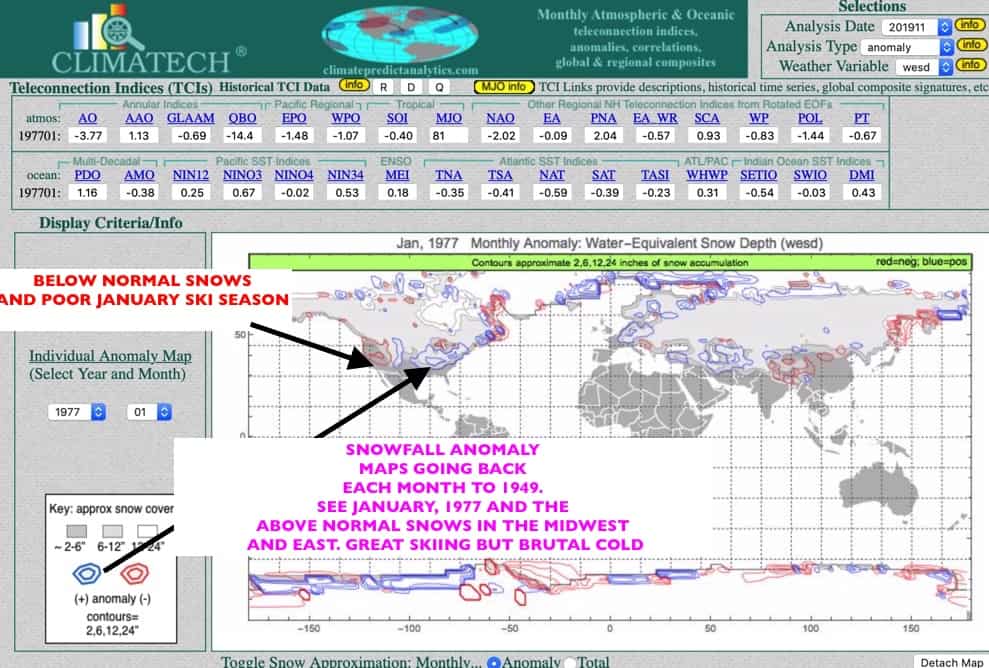
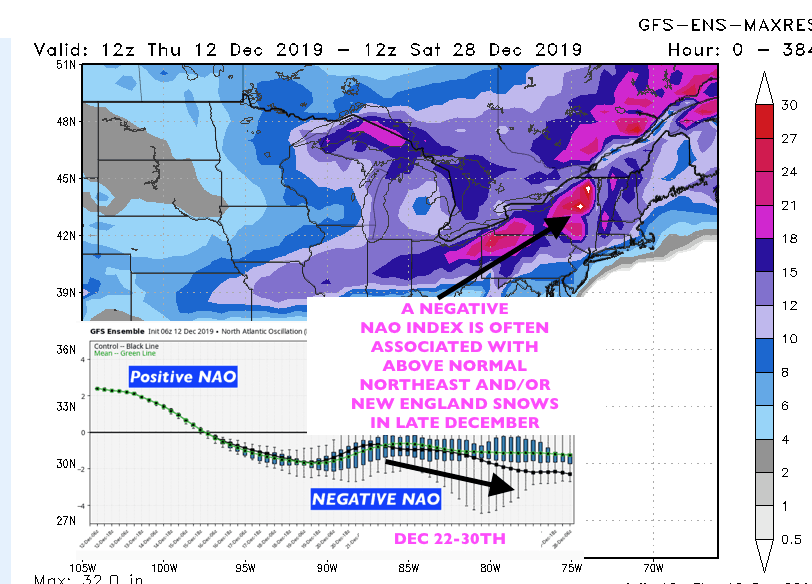
Want to look at different any winter of your choice and which teleconnections affected the snow season? Here, for example, is the frigid early 1977 winter.
The user can look at such teleconnections as the NAO index. We can see, for example the NAO index going negative later in December. This tends to increase snowfall for the Northeast or New England
I appreciate the hundreds of requests and comments around the world from twitter, linkened and other sources with regards to my offering a weather commodity newsletter. This would be simple to understand, timely, and offer the best long range weather forecasts in multiple industries from commodities, to global climate concerns, ski weather, weather and health and travel ideas.