by Jim Roemer | Feb 9, 2017 | Climate, Commodities, Forecast, Weather
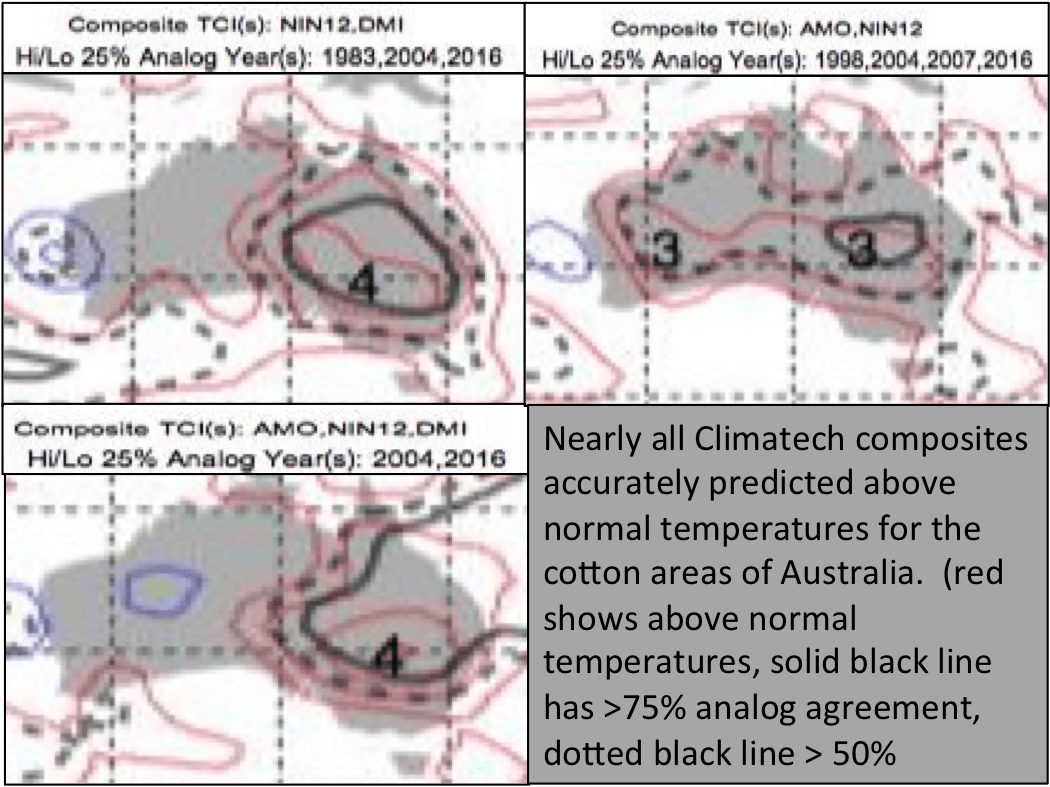
Prolonged heat over the past 5 weeks is forecast to continue into late February in East Australia. Climatech nailed the forecast of these warm temperatures. Climatech has several tools at its disposal that help accurately predict conditions months in advance. Using monthly teleconnection values, with mid-month updates, you can predict future conditions by finding analog years. Typically, we use sea surface temperature teleconnections with this tool, as atmospheric teleconnections are less inert. For example, the North Atlantic Oscillation (NAO) continually switches phase, where as the Atlantic Multidecadal Oscillation usually varies over years. The AMO and Nino 1+2 are currently positive, and the Dipole Mode Index (DMI) has been negative. Several different combinations of these teleconnection-based analogues led to a composite of above normal temperatures for East Australia, including cotton areas. See image below:

IMPACTS ON AUSTRALIA
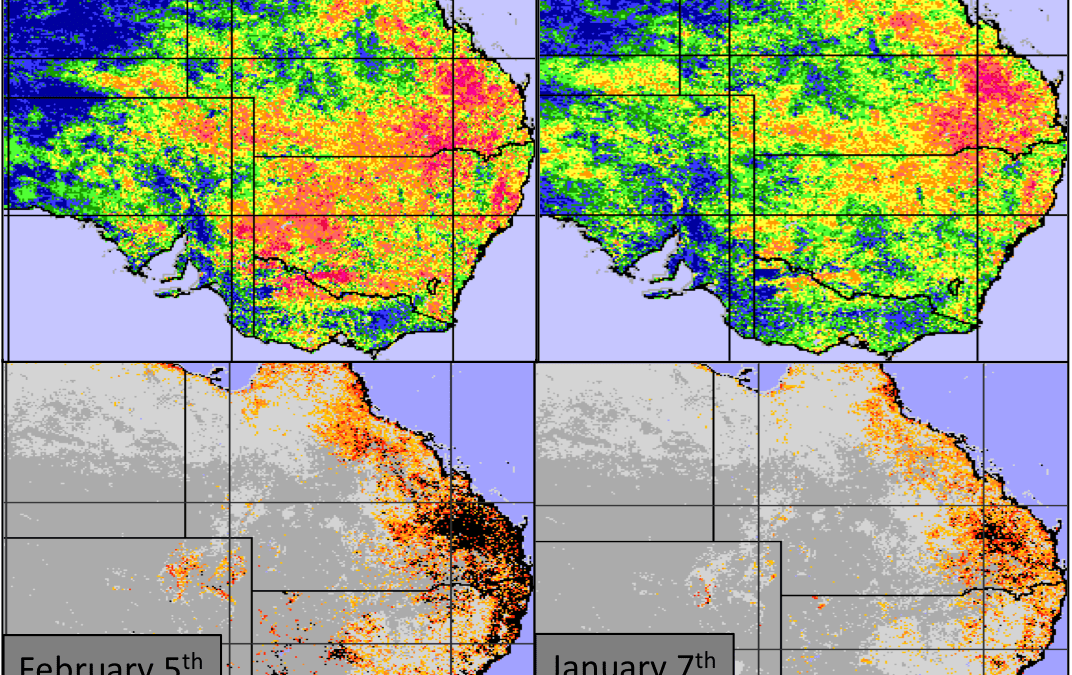
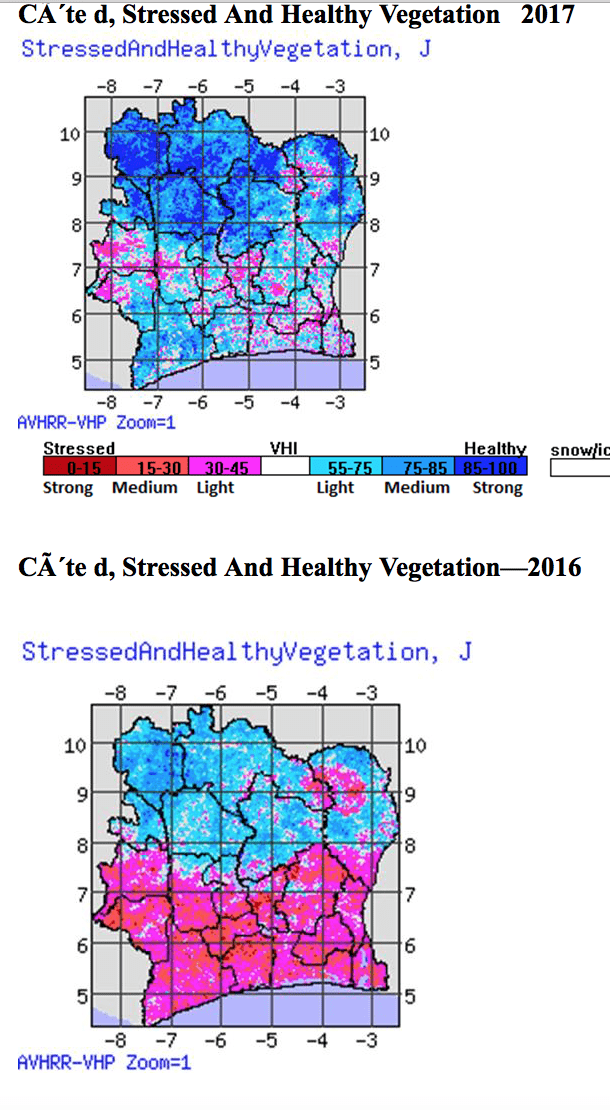
As a result of this heat, air conditioning bills are increasing. Beverage sales could rise. In addition, dry hot temperatures impacted the growing areas of cotton, wheat and soybeans. A change in conditions is observed in the Vegetative Health Index (VHI) values and the Thermal stress indicators from the first week of January to now. The Center for Satellite Applications and Research (STAR) division of NOAA provides these images. The measurements needed to calculate the indices are observed by satellites high above the atmosphere. Red pixels in the top two images indicate poor VHI values, with black pixels representing poor thermal conditions. Most notable are the increase in red pixels over SE Australia over the past month.
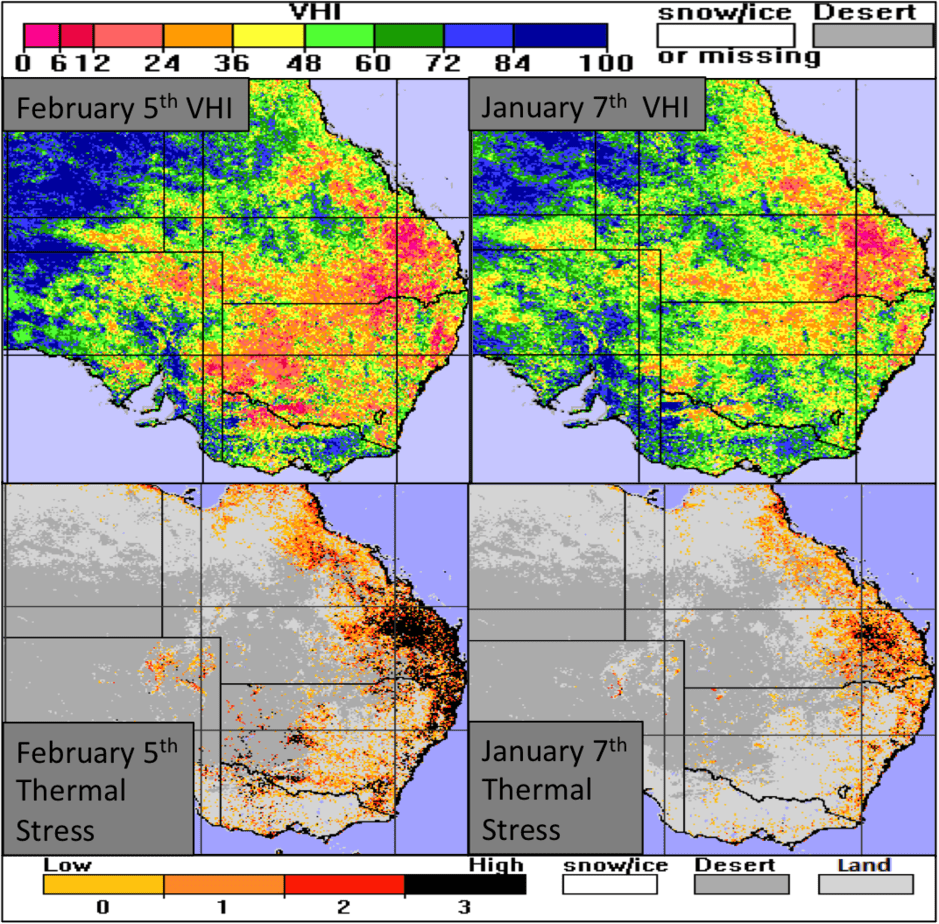
IMAGE CREDIT: NOAA/ NESDIS STAR
So what does this mean for the crop areas? We show years with similar VHI, indicating similar Australia crop conditions: 2016, 2014, and 2013. Cotton had yields near normal (-3%, -1% and +5%, respectively). Although a slight decrease in yields occured in a few of these years, no major crop issues occurred.
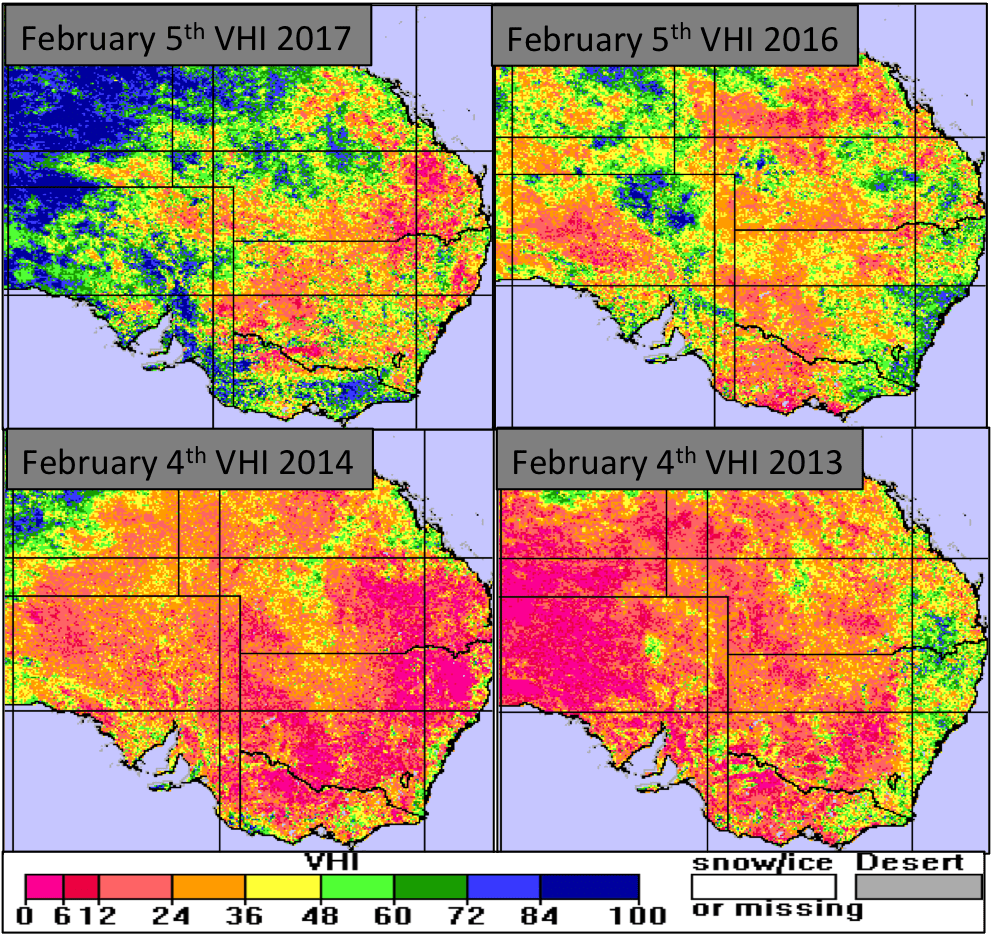
IMAGE CREDIT: NOAA/ NESDIS STAR
Conditions were much worse in 2011 (not shown). However, extreme flooding caused these poor values, not heat. Therefore, less impact is expected on crops in 2017. Moving forward, the next important forecast will be whether or not conditions for soybean, wheat and cotton will be ideal March through May (e.g. flooding during cotton harvest).
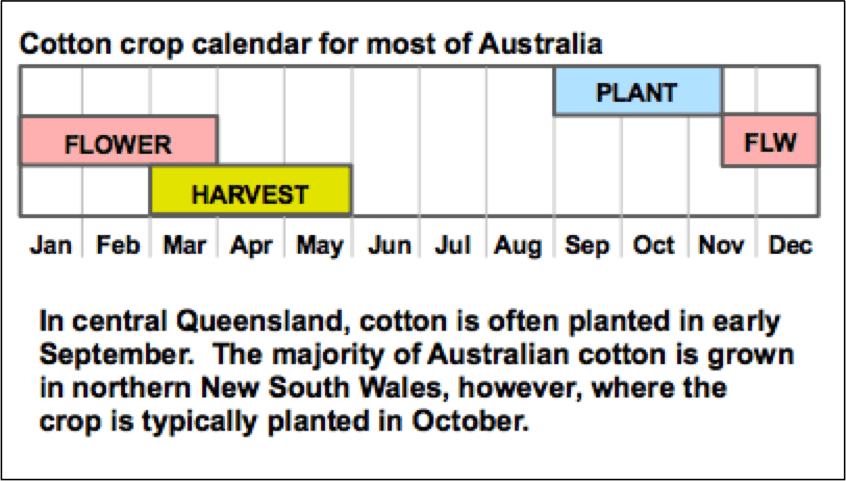
IMAGE CREDIT: USDA
by Jim Roemer | Feb 6, 2017 | Climate, Climatelligence, Environment, Forecast, Weather
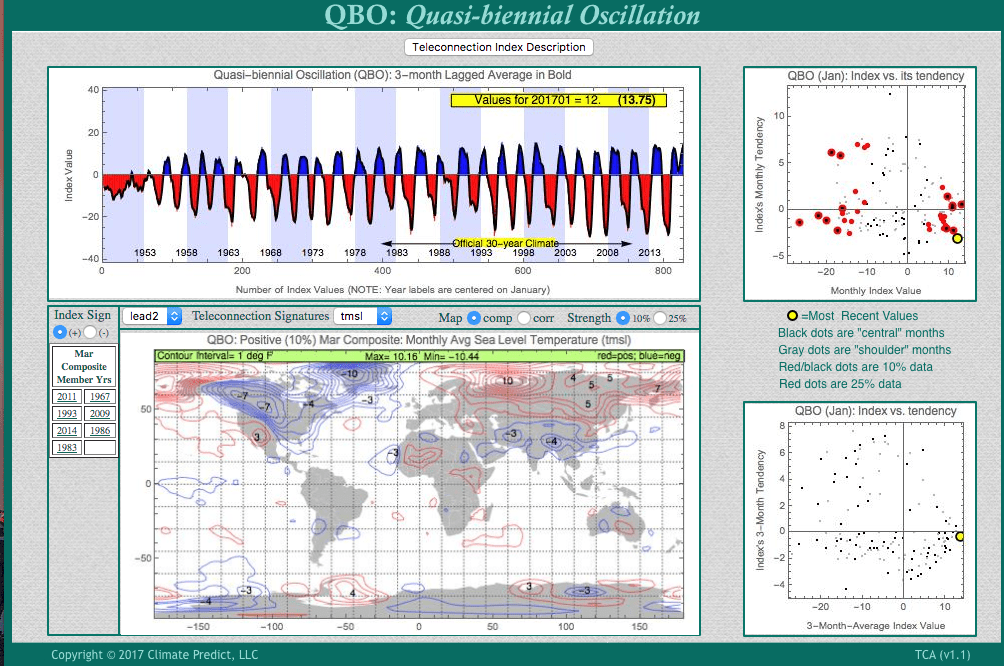
There has been a lot of talk by forecasters winter has been much warmer than anticipated. But few have discussed the lack of U.S. snow cover, a warming planet nor the record breaking positive QBO index as key reasons.
The lack of U.S. snow cover and what we call a very positive QBO index has been responsible for the collapse in natural gas. In addition, the planet continues to warm and environmental hazards are nothing new. Almost all forecast firms blew the winter forecast for a cold one. In addition, the atmosphere has NOT acted like a weak La Nina but at times a weak El Nino helping to prevent any lasting cold. There have been some winters when a late contra-seasonal rally in natural gas occurred when March was cold?
When the QBO is negative and winds some 20-30 miles up blow from east to west and not west to east as they have been now, this can allow blocks over the Arctic circle, Alaska, etc. to get well established for at least 3-5 weeks and create force a polar vortex south into the country. However, the record strong westerly phase of the QBO tends to weaken blocks and prevents any continuous trend of cold weather. This has been the primary reason that natural gas prices have collapsed 25% the last few weeks.
The present positive QBO phase tends to result in a cold March, and natural gas traders will be watching for that. However, for now a warming planet, the oceans and lack of snow cover, makes any major rally in natural gas prices from cold late winter weather, probably unlikely. One can see below the March historical temperature forecast for the U.S. when the QBO is positive. Often, a reversal from the warm winter by March. However, this is not written in stone due to a warming planet and lack of snow cover, but a cold snowy March could be the rule in some areas. Also, our feeling is that the MJO, discussed in earlier blogs will also allow colder risks and could possibly put a platform in the natural gas market. Neverthless, I do not think the present weather pattern is cold enough to allow for any significant rally in natural gas with the winter of 2016-17 again being warmer than normal.
In the meantime—some occasional weak cold blasts in the eastern U.S. and possible snow events will be the rule in the near future. The biggest cold we see presently is over eastern Europe into Russia with temperatures well below normal and a possible influence on the gasoil market in London.
(see link above of QBO definition)
QBO and March Temps from our exclusive software called Climatech
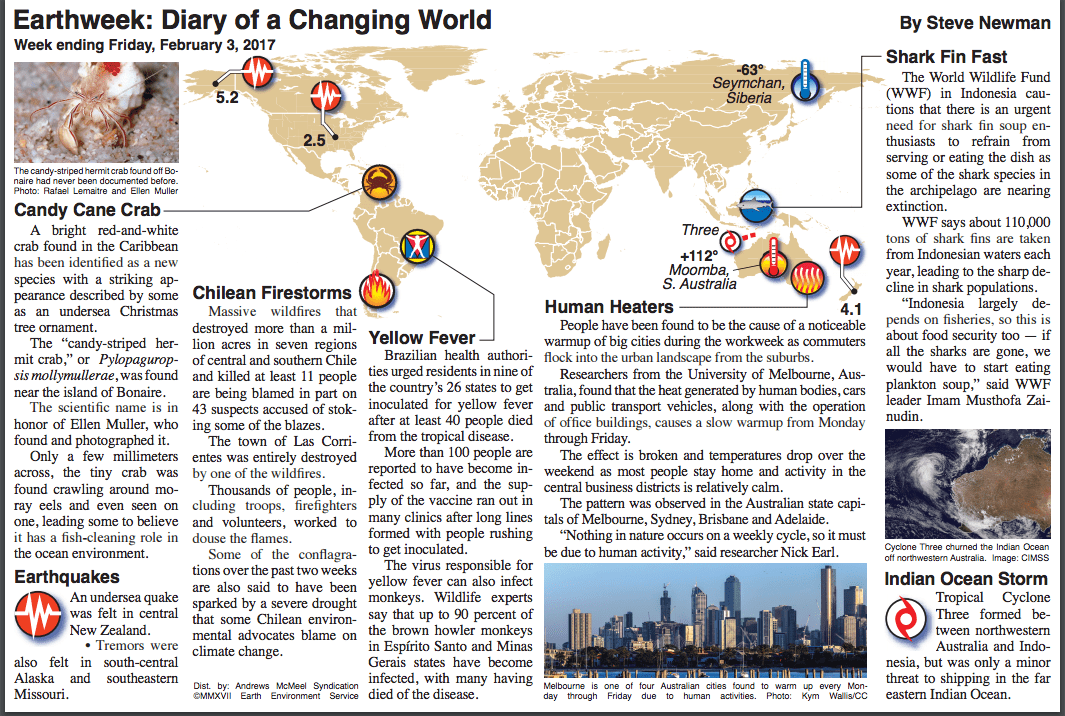
EARTHWEEK.COM chart below
by Jim Roemer | Jan 31, 2017 | Commodities, Forecast
KEY POINT–A January thaw has pressured natural gas prices. What did Climatech suggest using January teleconnections? Climatech exploits several little known teleconnection in its analysis. The Pacific Transition (PT) pattern is a rotated empirical orthogonal function that is typically only used in August and September. However, Climatech utilizes this teleconnection all year round. Below you will see how this index mostly predicted a warm January ( 500mb heights; winds at 18.000 feet). It is this teleconnection that has been responsible for a much warmer winter forecast than most models have suggested, for weeks, for key U.S. natural gas areas. This has helped to pressure natural gas prices, in a very volatile, winter market. However, other teleconnections such as the MJO portend a potential colder mid-late winter in the eastern U.S. Hence, it is possible the Pacific Transition Index could turn negative eventually and being influenced by the MJO. If so, colder, eastern U.S. weather will occur. The Pacific Transition forecast (shown below) does suggest warmer Midwest and Western risks heading through February, with the biggest risks for cold February weather in much of Europe. The occasional colder eastern U.S. weather, combined with cold in eastern Europe and especially Russia could increase demand for heating heading into late winter. -JIM ROEMER
The MJO
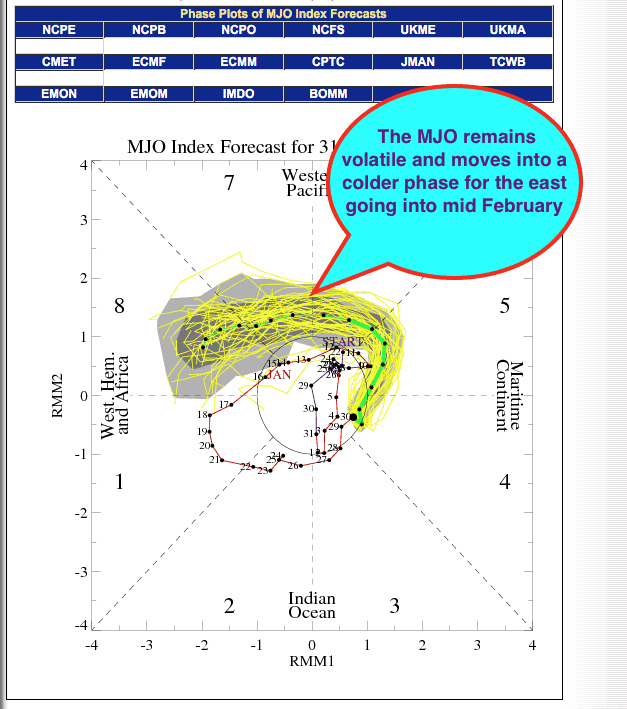
The MJO
THE PACIFIC TRANSITION INDEX PATTERN FOR JANUARY AND FEBRUARY USING CLIMATECH
The Pacific Transition in January below normally shows a big trough (blue) off the west coast of California, which was responsible or the huge snows and easing drought out west. Notice the red warm anomaly for much of U.S. natural gas areas most of this month of January.
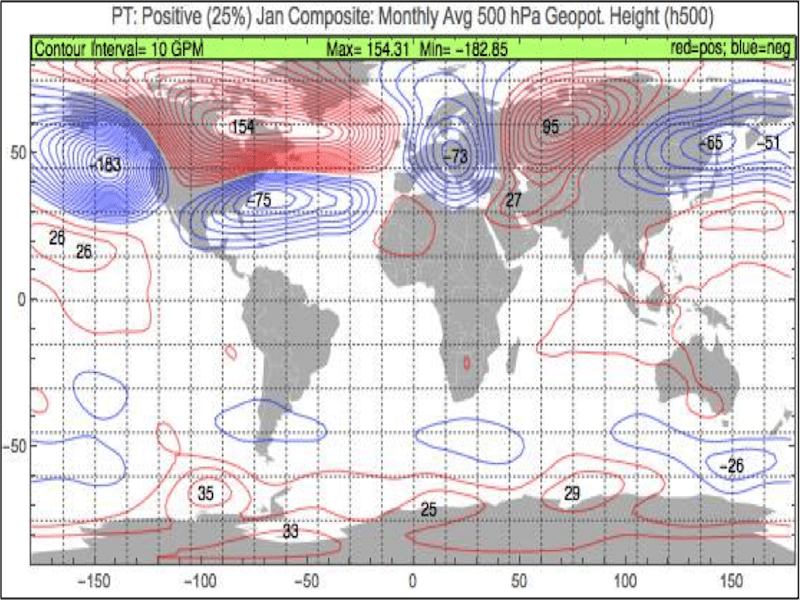
Below, the preliminary January PT value is +1.26. This is in the top 20% of all PT Januarys going back to 1949. Using this, we forecast February temperatures. The temperature composite below favors overall warmer than normal temperatures in the United States. However, the MJO could eventually influence this index to change. If so, colder late winters risks may affect U.S. natural gas areas. The greatest risk for February, for colder weather (see blue below) is over parts of the East and southeast.

This signal for warmer weather forecasts lower demand for natural gas, especially in New England and Midwest. However, a cold shot, first in early February will keep the volatility in the natural gas market. The MJO going into phase 7-8 by mid February and eventually phase 1 or 2 by March could cause the Pacific Index to change to negative. If so, colder late winter risks may occur, especially by March.

by Jim Roemer | Jan 23, 2017 | Climate, Commodities, Forecast, Strategy, Weather
This huge January thaw has helped to pressure the natural gas market again and has been one factor in the weakness of the heating oil complex. The volatile EPO index (Eastern Pacific Oscillation Index) has to do with blocks close to and north of Alaska that can sometimes bring down the polar vortex. This will be the key over the next 6 weeks to the mid and end of winter and whether the eastern U.S. sees some improved snow for ski resorts. This feature may also play a role in disturbing the polar vortex enough to send it south during parts of February and March. If so, natural gas prices will bottom. One can see below the volatile up and down motion of the EPO index all winter influence by a combination of a fluctuating weak La Nina (that is now pretty much gone); changes in Pacific Ocean temperatures and lack of consistent stratospheric warming event near the North Pole. The natural gas market has fluctuated as violently as this weather feature (EPO) index has. Cold periods are associated with a negative EPO and blocks over Alaska and the western Arctic that can force the Polar Vortex south. A positive EPO is the opposite (warm)
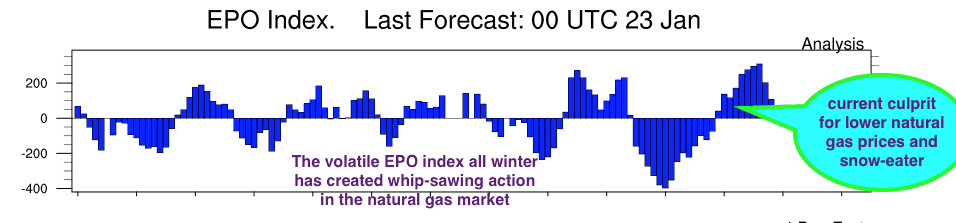
SOURCE ABOVE–Earth System Research Lab. NOAA
This Year’s January Thaw has been incredible. Some feel that thaw has to do to changes in the earth’s orbit around the Earth, but I have found little scientific research to support this this. If the EPO index goes more consistently negative, this would bring about more Midwestern and Eastern snows and cold weather by the middle part of February. Jim Roemer
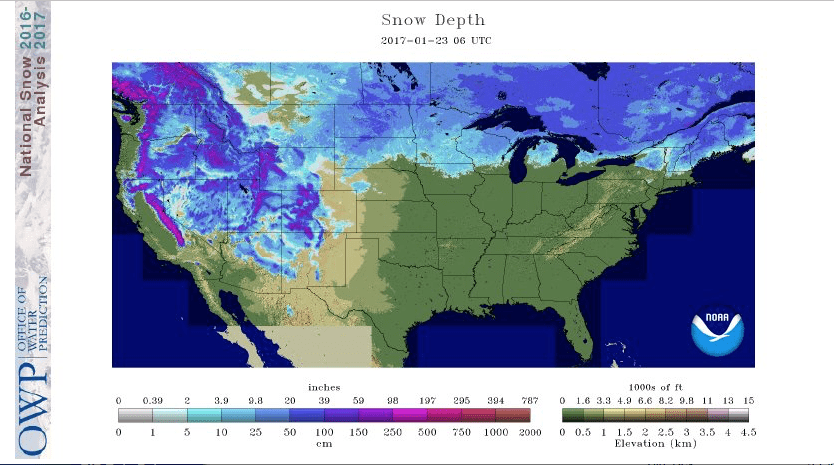
Snow Cover (above) has greatly shrunk since early December (over the Midwest and East), helping to reduce the effects of any cold out breaks out of Canada. That could change as we head deeper into winter with some colder outbreaks. One can see the incredible snows out west and the best skiing in many years.
Farmer’s Almanac- January Thaw
“The January Thaw, like Indian Summer, is more than just another piece of fanciful weather lore. Annual averages really do show a slight temperature increase, and subsequent dip, during the final week of January. On average, January 23 is the coldest day of the year in much of the Northern Hemisphere
Almost exactly six months later sits July 24, the warmest day of the year, on average. Between those two dates, average daily temperatures show a fairly predictable rate of increase. While there may be deviations from that pattern during any given year, the model holds true when looked at over a period of several years.
Though predictable, the climb from cold weather to warm and back again, is not completely smooth. Small “blips” in the overall pattern reveal noticeable fluctuations that can be observed from year to year. These blips are called singularities in weather lingo. Indian Summer, a period of unseasonably warm weather that usually appears in mid-October, is one such blip. The January Thaw is another.
During the January Thaw, which usually lasts for about a week, temperatures rise an average of 10° F higher than the previous week, then drop back down in time for February’s arrival. Though it’s called a “thaw,” the January Thaw doesn’t necessarily melt away snow and ice during its stay. In areas where winter weather is exceptionally cold, temperatures during the thaw may not even rise above freezing. More temperate regions, however, may even experience what could be described as a “false spring.”
Though they are a verified weather phenomenon, January Thaws don’t happen every year. In order for a singularity like the January Thaw to be recognized, it only has to appear slightly more than 50 percent of the time.”
According to Wikipedia- January Thaw
“The January thaw is believed to be a weather singularity. A possible physical mechanism for such phenomena was offered in the 1950s by E.G. Bowen: he suggested that some “calendaricities” (as he called them) might be explicable in terms of meteoric particles from cometary orbits acting as ice nuclei in terrestrial clouds; this theory then received some support from several sources.However, Bowen’s ideas later fell out of favor with the development of atmospheric dynamic modeling techniques, although one of his rainfall peaks does seem to correspond with the date of the January thaw. Data analysis has not found statistically significant support for the supposed January thaw.
by Jim Roemer | Jan 23, 2017 | Commodities, Forecast, Markets, Strategy, Weather
Rubber prices have increased more than 60% on the Tokyo Commodity Exchange since October. Rubber is not traded on an exchange in the U.S., but can impact U.S. companies that need it for their products, such as the tire and industries. China helped drive foreign futures prices higher, with greater demand of rubber for tires. Lately, car sales have increased in China due to a government tax break.
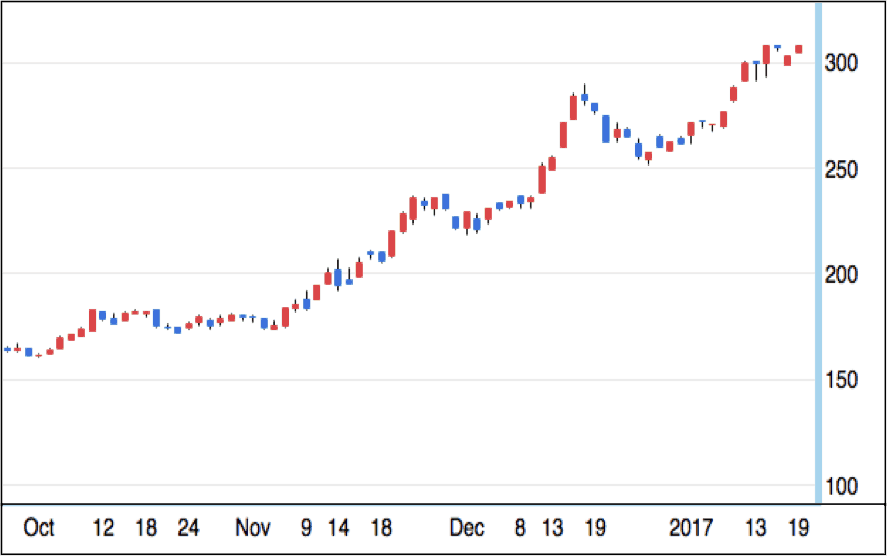
The image above shows the price of rubber (yen/kg). Credit: Tokyo Commodity Exchange
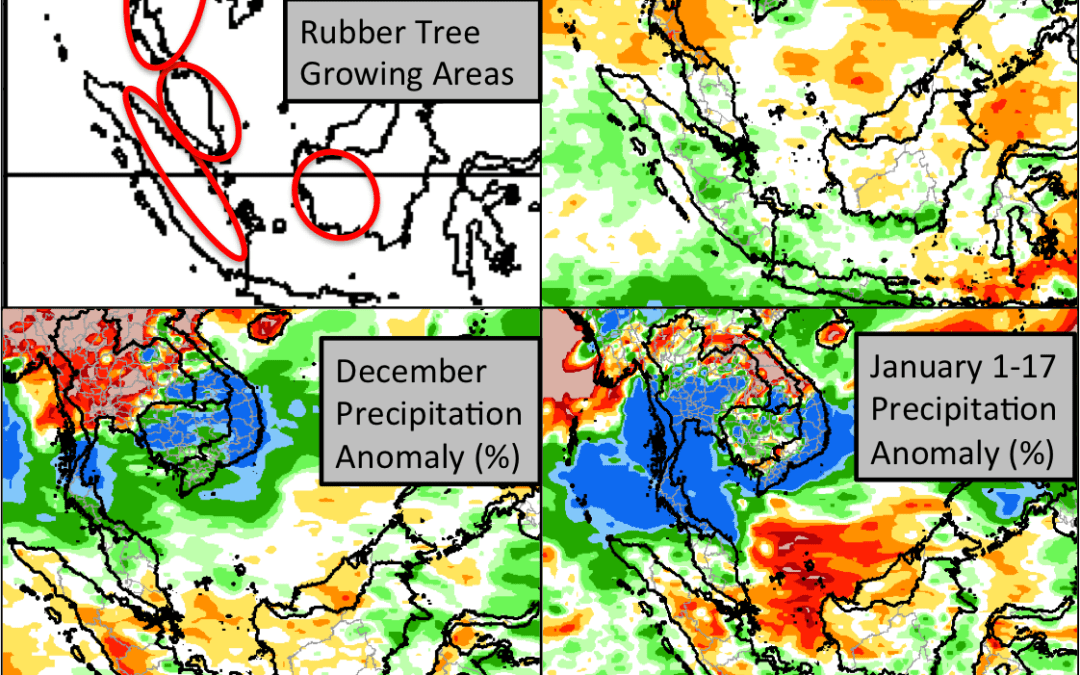
However, the main impetus for this futures rally appears to be tied to the above normal rainfall in most of the Indo-Pacific region since December. This has limited the harvest of latex from rubber trees. Southern parts of Thailand, the world’s largest rubber exporter, were most severely impacted.
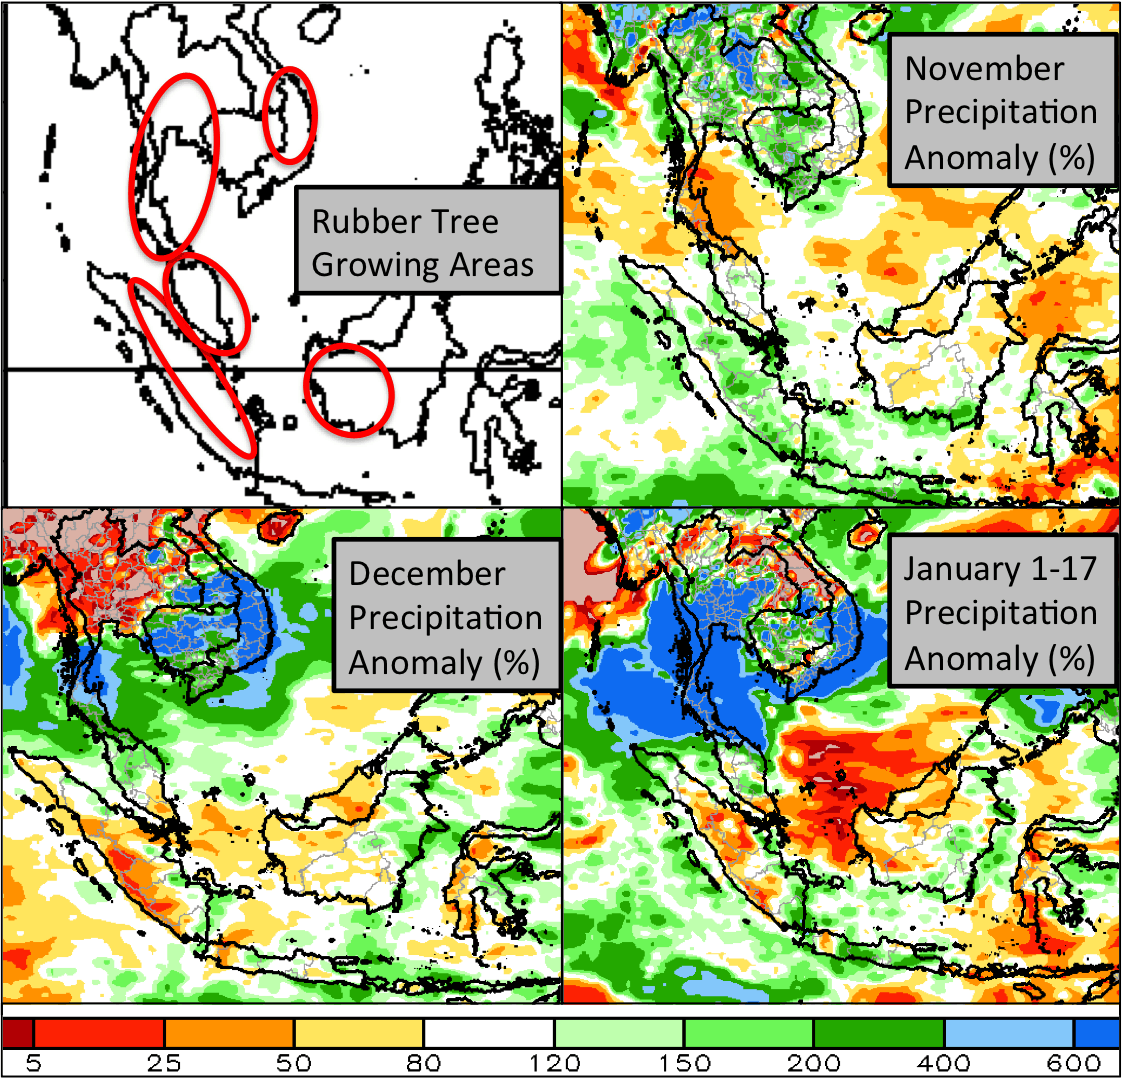
Image Credit: NOAA
Here is a graphic we sent to clients about a month ago, giving them a heads up on the flooding in Vietnam Robusta areas and Thailand sugar areas. The La Nina sea surface temperature pattern lead to anomalous low level convergence and divergence zones along the equator. Changes in the wind field create an anomalous low near Vietnam, causing onshore flow of warm moist air. Above normal rainfall can occur across SE Asia in the winter months, extending the rainy season past November in Vietnam. On top of impacting rubber, this flooding caused delays to the sugar harvest in Thailand and damaged Robusta trees in Vietnam.
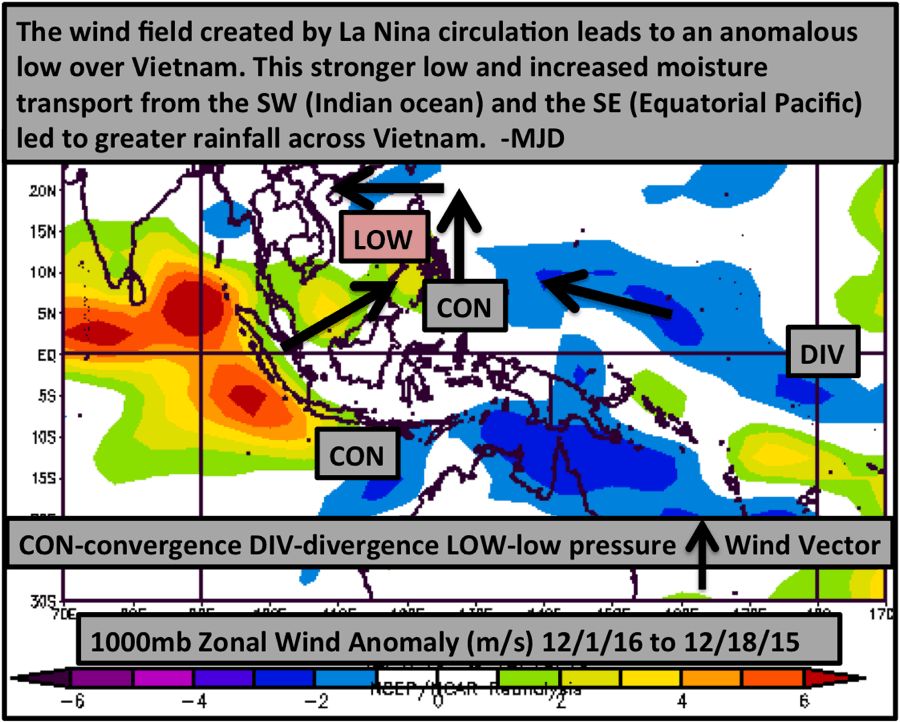
Image Credit: NOAA, NCEP/NCAR

by Jim Roemer | Jan 20, 2017 | Climatelligence, Commodities, Forecast, Weather
SOURCE OF PHOTO–Hindubusinessline.com

Political Unrest in Ivory Coast; a common theme
Political Unrest in West Africa and the Disparity Of Wealth
Political unrest in the Ivory Coast is nothing new and this can often affect the cocoa market. For many west Africa residents, playing soccer and harvesting cocoa has been a staple of their life style and history for close to a century. Wages for many cocoa farmers are less than the equivalent of $200 a month! Absolutely ridiculous when you consider Donald Trump’s political cronies (up for various cabinet seats) have a net worth of more than $100 billion. Talk about the disparity of wealth?
he world’s 10 biggest corporations together had revenue greater than that of the poorest 180 countries combined in 2015-16, says a new report by Oxfam, released to coincide with the World Economic Forum that opened in Davos on Monday.
Holding out a warning that, if left unchecked, growing inequalities threaten to pull our societies apart, the report called upon world leaders to focus on a ‘”human economy” that “works for the 99 per cent”.
The report, “An Economy for the 99%”, said inequalities were leading to increase in crime and insecurity, and giving rise to widespread disillusionment with mainstream politics, in the process helping forces that fan racism and divisiveness, citing Brexit and Donald Trump’s campaign as examples.
Eight men now own the same amount of wealth as the poorest half of the world. This includes the poor country of Ivory Coast, whose migrant cocoa workers, work their tails off to bring us one of the “sweetest, most euphoric” foods on earth–Chocolate
West African Weather and Crops—-Huge Impact to the Cocoa Market
Few people realize that all the wonderful chocolate you happen to eat, probably comes from the Ivory Coast, Ghana or Nigeria, which produces 70% of the world’s cocoa.
With respect to commodities, this has been one of our best calls over the last 2 years. We first predicted the volatile, but slow increase rise in cocoa prices back during the El Nino of 2015-16, in which crop conditions tanked a year or so ago in Ghana and Ivory Coast. More recently last spring in the midst of worries about the mid-crop coming onto the market, we had a “bearish attitude” on our expectations of improved global weather heading into 2017.
You can see, for example, how much better crop conditions have been recently compared to a year ago. This reality of a possible surplus in global cocoa production this year, exacerbated by weaker North American cocoa grinds and worries over the state of the European Economy (biggest consumer of cocoa), has resulted in close to a 30% collapse in cocoa prices since late summer.
Notice the much improved crop conditions in west Africa this winter. This is something we predicted 6 months ago would happen that has been a main force in the fall of the cocoa market. The question then becomes, how much lower must prices go to foster an increase in global demand to stabilize prices?
What will prices do in the months ahead? Subscribers to our Climatelligence newsletter (available for subscription sometime later this year), will receive some longer term trading advice in this and other weather sensitive commodity options and ETF’s
SOURCE:—- NOAA Start Center for Satellite Applications and Research

