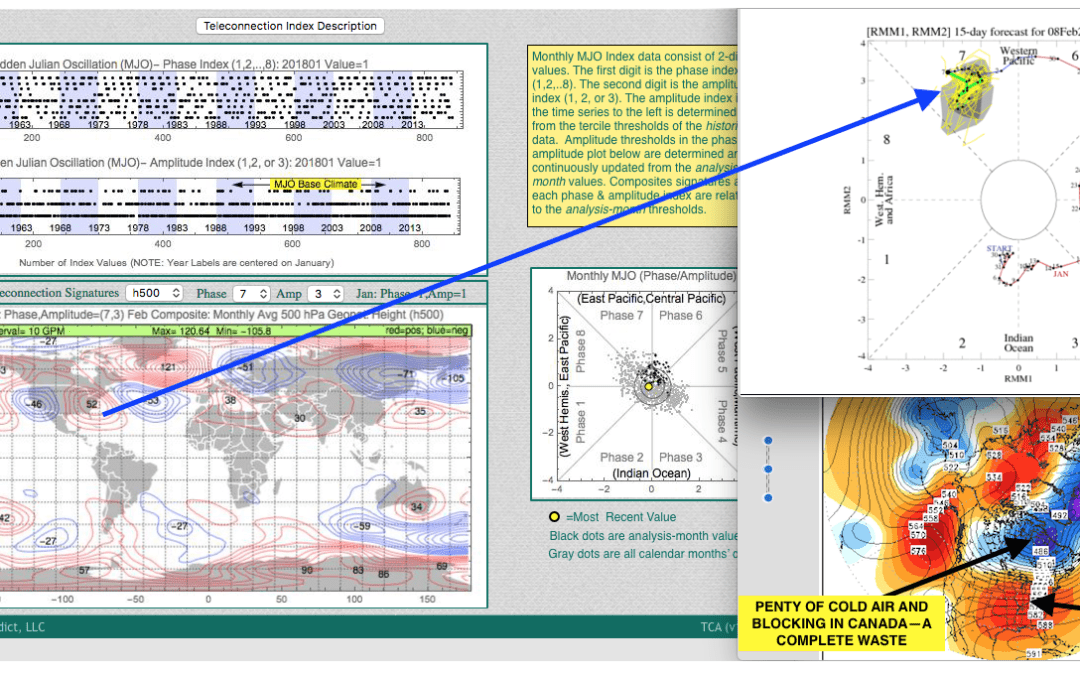
Feb 2, 2018 forecast—CLIMATECH AND MJO- –(Map above)
.
While La Nina is only weak in nature and earlier forecasts painted a mostly rosy picture for South American soybean production, weather maps, in the past two weeks, have been “too wet” in their prediction of rains for Argentina.
.
The situation is becoming more dire for Argentina production, which now has a chance to fall below the critical 50 MMT mark. While Brazil has enjoyed generally ideal weather this winter (their summer), in the four weeks to come, all eyes will be watching Rio Grande Do Sul, the third largest Brazilian soy producer.
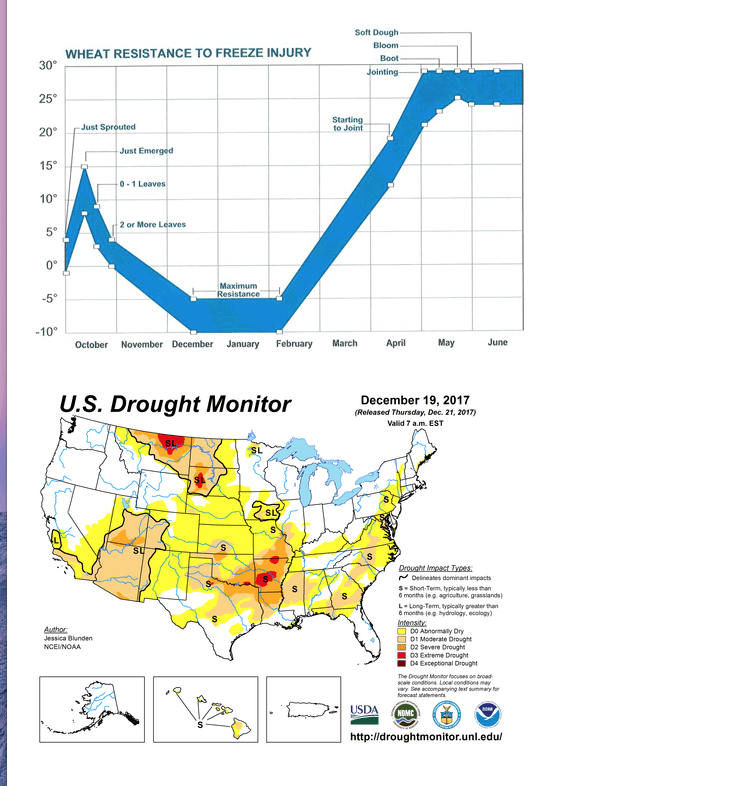
In the meantime, while soybean prices have rallied, the drought in the Plains wheat areas is one of the worst since 1996. This is something we began forecasting, early on, last November.
As grain prices spiral up, natural gas prices have fallen some 18% off their late January highs. The reason has to do with the MJO in one of the strongest instances of “phase 7” in the month of February. I had alerted our subscribers that this might happen as early as February 2nd.
This condition has offset cold signals in both Canada and the arctic. However, the MJO may begin to move, and die, later in February and March. If this happens, it would set the stage for a much colder March weather pattern.
Best Weather is pleased to welcome our guest blogger, Scott Mathews, who tells us about weather’s role in economic events.
Credits for narrative and graphic content appear at the end of this blog, below.
1857 – How a hurricane contributed to an economic panic
1982 – How a blizzard caused a “flash crash” in short term interest rates
2018 – What could happen next?
Sunken Treasure
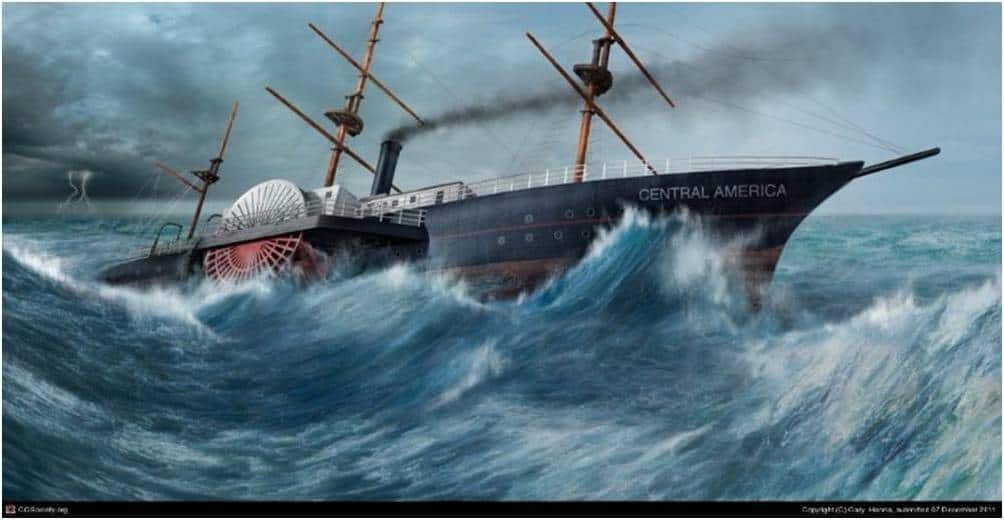
The recent announcement about an upcoming auction of gold salvaged from a 19th century shipwreck bears an interesting tale of how an economic crisis was spawned by a hurricane.
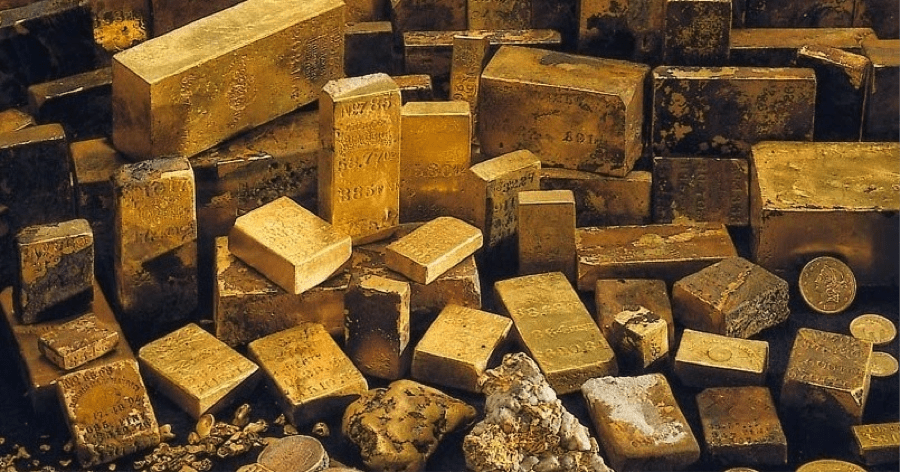
Wreckage from the SS Central America, the so-called “Ship of Gold”, was discovered in 1988 at a depth of 7,000 feet off the Carolina coast. As the recovery operation progressed, half of the payload was sold in order to pay back creditors involved with the project. That accounted for about $50Million worth, but the rest of the treasure has been tangled up in years of bickering among law firms and insurance companies. What’s left will be displayed in California at the Long Beach Convention Center (Feb. 22-24), and will be sold in early 2018 for an estimated additional $50Million,depending on market prices.
On the auction block will be 45 gold bullion bars, 3100 gold coins, 1000 silver coins and over 80 pounds of gold dust, as well as an assortment of nuggets.
What does this have to do with the weather causing a crisis?
Tales of both success and ruin from the great 1849 California gold rush are the topics of songs, novels and movies. There were fortunes made, for sure, but there were also hard luck outcomes for many who gave up all, in hopes of getting rich. Some have said that the real winners were the operators of saloons, bordellos and flophouses, as well as the sellers of hardware, dry goods and mules. The gold mined there in the early 1850s injected a powerful stimulus into the US economy.
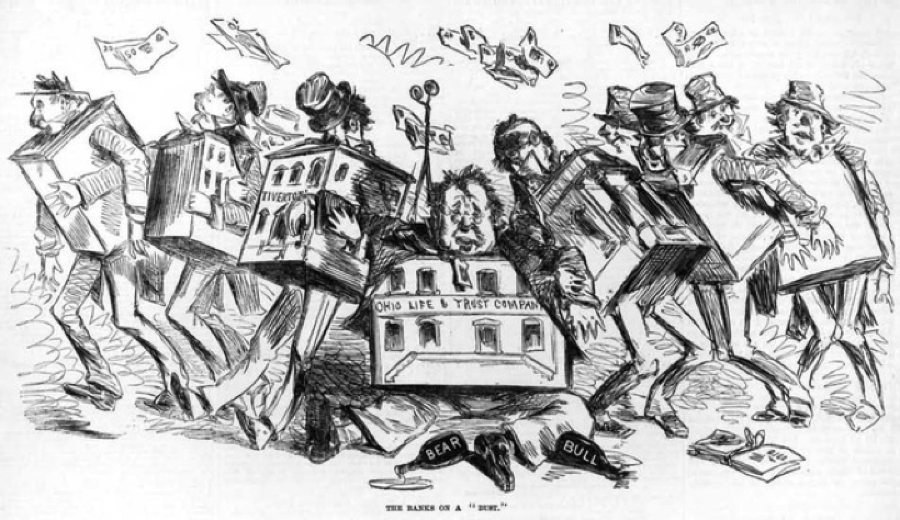
The Panic of 1857
California gold was consistently shipped back east. The cargo hold of the SS Central America contained a sizeable stash, roughly 10 tons. At that time, the prosperity enjoyed in the US was partially hinged on that stream of wealth flowing from the gold rush.
The flow began to slow down in the mid 1850s, and on September 12, 1857, when that New York bound steamship sank in a violent hurricane, the first economic domino fell. The loss of that long awaited gold shipment was such big news, that the telegraph operators sent “instant messages” that halted thousands of deposits, payments, acquisitions and other dealings across the country.
The banks had invested in businesses that were failing, and this was causing the American people to panic. Investors were losing heavily in the stock market and railroads were unable to pay their debts…
…Land speculators who had counted on the construction of new railroad routes were losing money. People feared financial ruin, and ran to the banks to withdraw their money. However the banks did not deal in paper money, the banks dealt in silver and gold.
Then the panic became global from the perception that the supply of precious metal money was drying up. There was no real recovery until after the Civil War, a decade later.
Fast Forward to Supply Side Economics in 1982:
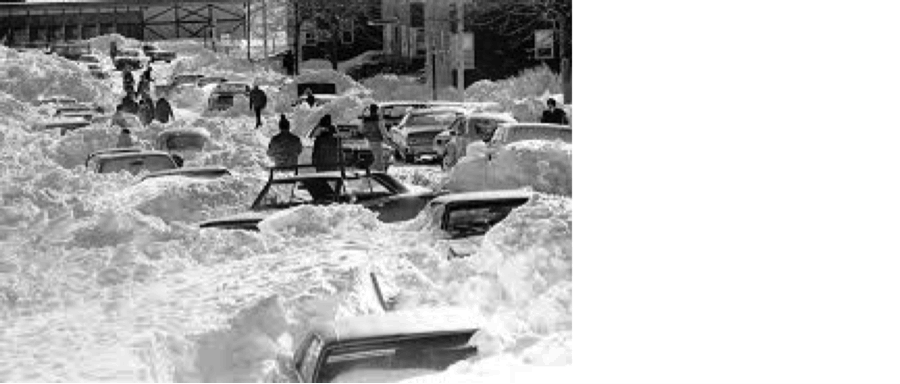
How Bond Traders “Got Snowed”
The supply of money has been, and still is a main driver in recessions and in growth periods.
A huge plunge in short term interest rates baffled bond traders one afternoon in April 1982. This was during the Reagan administration when “supply side economics” was the buzz phrase du jour, and guessing the money supply number was one of Wall Street’s favorite extra-curricular guessing games.
The aggregate known as M1 measures all “circulating” cash, mostly held in checking accounts. For a while, the money supply was considered to be the pulse of the economy. The expansion and contraction of M1 told traders how the Fed would, or might, react in response to short term credit needs.
That puzzling M1 deficiency which spooked the bond traders that afternoon wasn’t explained until the following day:
It appeared that a rare spring snowstorm was the culprit.
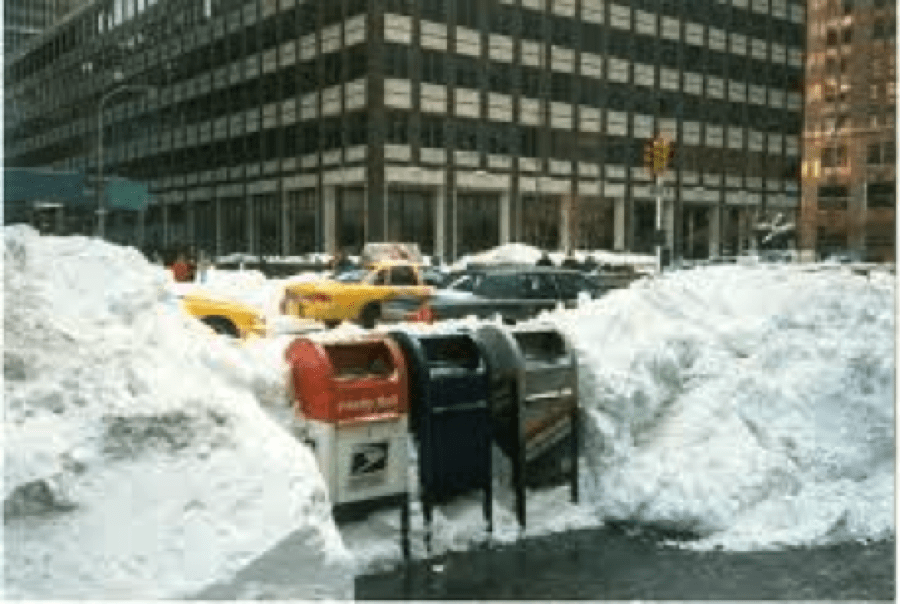
The Associated Press reported that the April blizzard “swept from Ohio through New England, and brought travel to a virtual standstill in cities such as Boston and New York.” A snowstorm of such ferocity was unprecedented at that time of year.
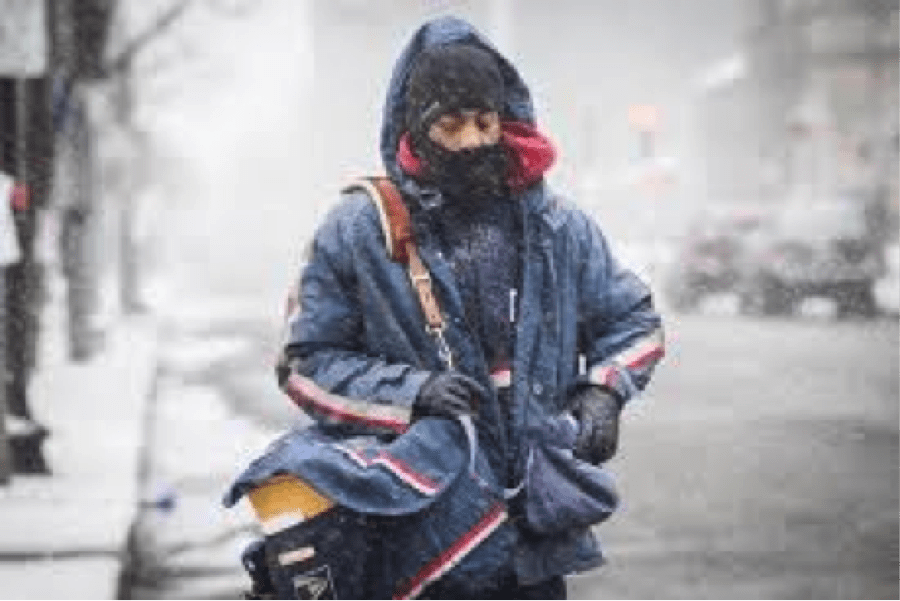
The 4/6/82 storm had been so unexpectedly severe in the Northeast, that the U.S. Postal Service experienced massive delays in mail delivery, and transportation disruptions impacted commerce.
So, how did this affect interest rates? Billions of dollars in Social Security checks didn’t move through the postal system as normally anticipated.
Millions of recipients got their checks late.
Hundreds of thousands weren’t able to get to the bank.
This might seem odd today because direct deposit and electronic banking now insulate the movement of money from the elements. When that M1 number was released it was several billion dollars short of expectations, signaling an immense lack of available cash; this in turn, implied the Fed would have to add reserves, and ease credit by lowering interest rates.
The following week, after all those checks had been received and deposited, the numbers went back in line with predictions again.
Economic analysts must have been aware of the blizzard as the major headline story the previous week, but none of them had “connected the dots” when making their M1 forecasts. The moral of this tale is that weather not only impacts the economy, but it can be “last week’s weather” that takes investors and traders by surprise.
Did I mention that money supply figures were, and still are, released every Thursday afternoon for the calculations based on the previous week?
In some bond departments during the Reaganomics era, the trader with the farthest-off “guestimate” had to buy refreshments, and transportation home, for everybody in the weekly M1 pool:
What glitch could weather have in store for markets in 2018?
This is not going to be a prediction… just some “food for thought” about how the 21st century version of our theme might play out. In the case of our historical anecdotes, technology was the key.
In 1857, using of a side-wheel steamer to transport precious metal assets was probably an accident waiting to happen. What was the alternative? Certainly not railroad or stagecoach, because they would be too conspicuous and too tempting for bandits. So, shipping had to be… by ship.
As for the 1982 Social Security checks being delayed in the US mail, it was also a transportation issue, since the checks traveled their greatest distances by truck.
In 2018, the transportation of data is our Achilles heel. How could weather impact that process?
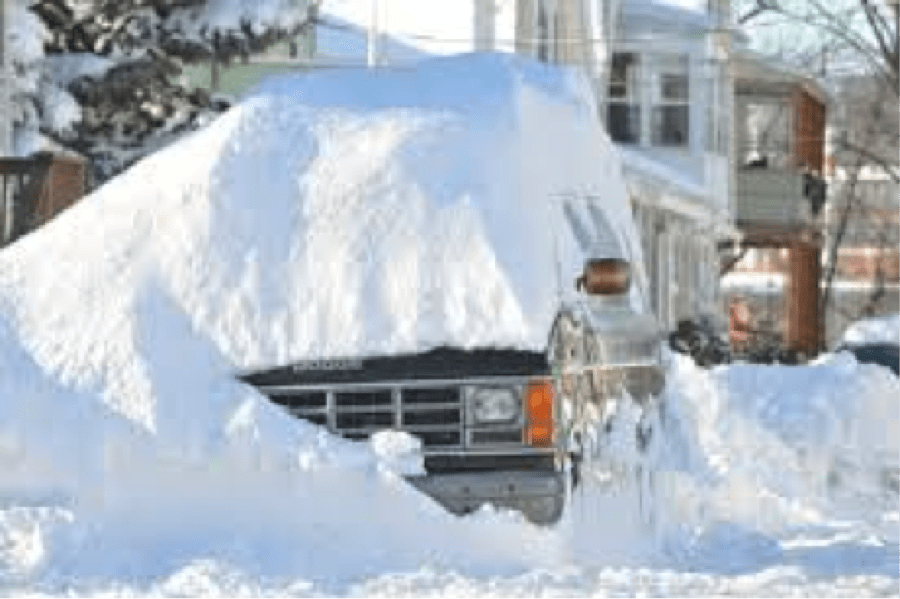
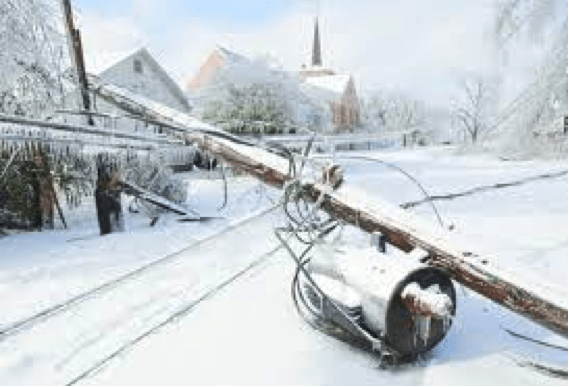
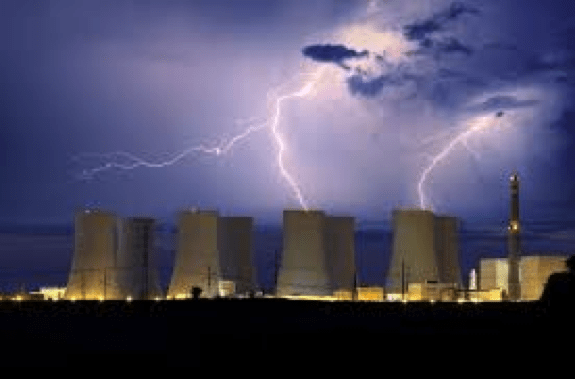
It’s all about power outages. Widespread outages of long duration would put electronic commerce and banking at great risk. After back-up batteries have died, and after fuel for back up generators has been depleted, then the money flows would slow, and even stop in many venues. We know that power outages can be triggered by weather. Extreme heat waves can stress the system from excessive cooling demand…
…wind and ice storms can bring down power lines,
…and lightning strikes can compromise generation stations.
You might think we’ve always been aware of such possibilities. Your assumption is that the engineers have “hardened” the facilities with preventive and reactive measures. All of that is true. However, in this era we have a new actor who could take a cue from a severe weather event. He might seize an opportunity to bring down the grid as well as the economy.
Enter the Cyber Criminal
On the written page, on stage and on screen, the burglar strikes at night. He takes advantage of darkness and diurnal habits of his victims in order to increase his chances. He gets “coverage” from them.
In the 21st century, the cyber terrorist looking to cause havoc might strike at any time. Yet, if the grid is already suffering from a weather-based outage, his mission might prove even more insidious. The weather event will give him “coverage” as well.
If that doesn’t scare you out of your wits, read this book:
Just so you know, in an interview on his tour for this book, Ted Koppel said, “We are frightened enough that my wife and I decided to buy enough dried food for ourselves, our kids and their kids.”
Are you interested in stocking up for survival? Don’t forget that you might want to keep some hard assets for bartering purposes. It doesn’t hurt to have some gold and silver coins, but you need to get them before the internet crashes. Oh, and remember, “no internet” means “no crypto currency”.
If you want to stock up on precious metals, in either coins or bars, be careful. The field is crawling with counterfeiters. The criminals are getting better at fooling the experts. The most clever ones seem to be in China.
“We do not inherit the earth from our ancestors, we borrow it from our children”. – Native American Proverb
“You may delay, but time will not.” – Benjamin Franklin
There’s a bit of “Prospector” in all of us:
Music credits: Days of ’49 performed by Toein’ in the Dark. – YouTube video published October 21, 2012
Images:
Painting “Death of the SS Central America” by Gary Hanna
Photo display of gold bars and coins: Monaco Rare Coins, Newport Beach, CA 92660
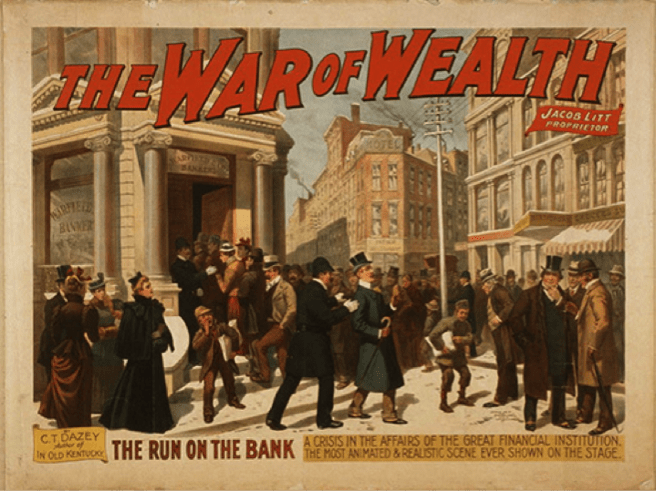
“The War of Wealth” – 1896 Broadway play by C.T. Dazey – poster copyright by The Strobridge Lithograph Co., Cincinnati & New York, 1895
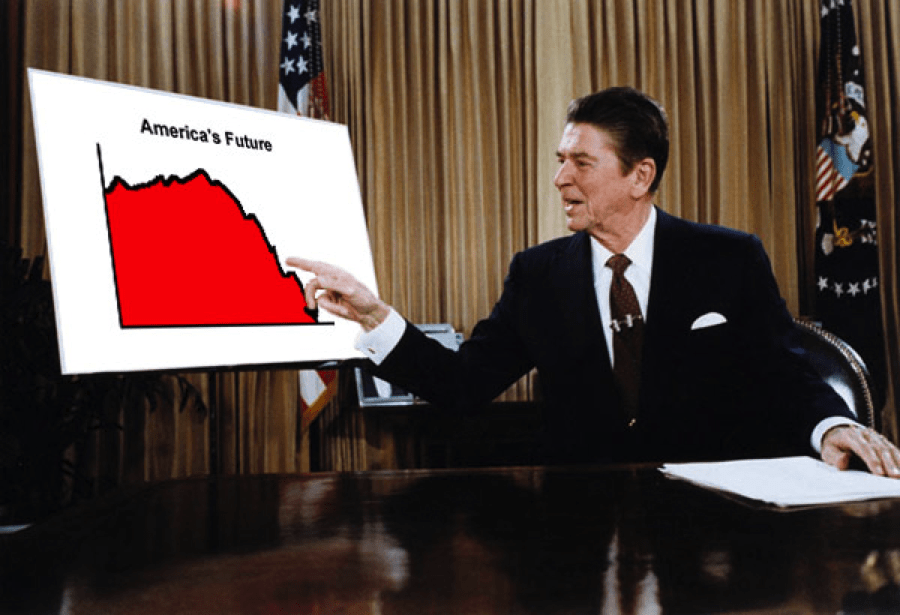
Photo of Ronald Reagan: “How Reagan Sowed the Seeds of America’s Demise” – by R. G. Price – RationalRevolution.net
Information sources:
Ship of Gold in the Deep Blue Sea, by Gary Kinder, Grove Press, New York, 1998.
“Hurricanes and Equities: Cross-Market Opportunities” (2009) by J.S. Mathews – published on CME Group website
Koppel, Ted – “Lights Out: A Cyberattack, a Nation Unprepared, Surviving the Aftermath” – Crown Publishers (2015)
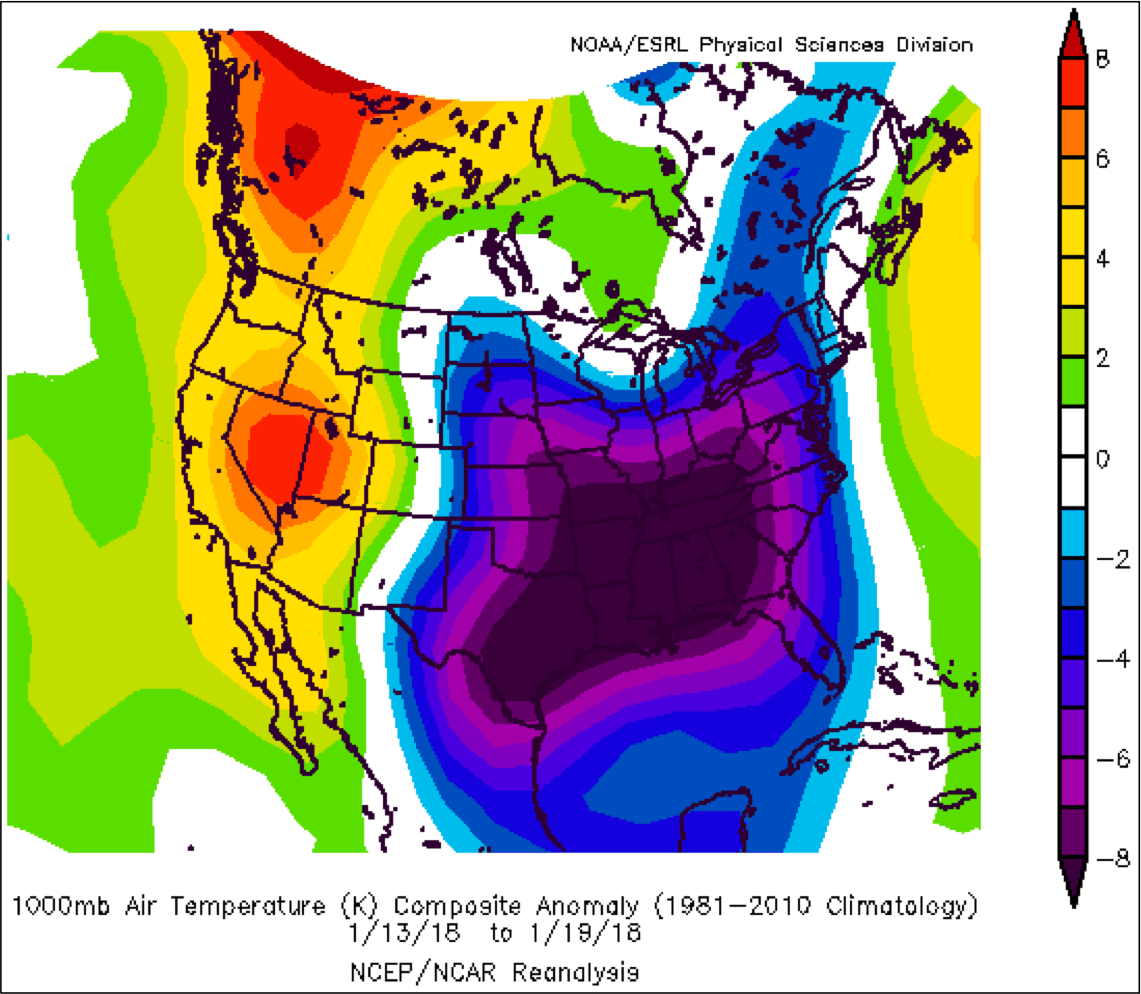
Swings in the weather forecasts have caused equally volatile natural gas futures. It was so cold in Alberta earlier in January that natural gas wells froze up! Last week, frigid air and winter storm blasted the southern United States. See the cold week in the temperature anomalies below:
CREDIT NOAA / ESRL
Despite this, (and the fact that natural gas storage is 362 Bcf below the five-year average of 2,946 Bcf) natural gas prices are falling on the warmer outlook currently presented by the models. Our longer range outlook has verified, so far. We will be watching the maps closely as we head into February. For more information on our forecasts and subscriptions, email subscriptionsbestweather@gmail.com
Corn and Soybeans
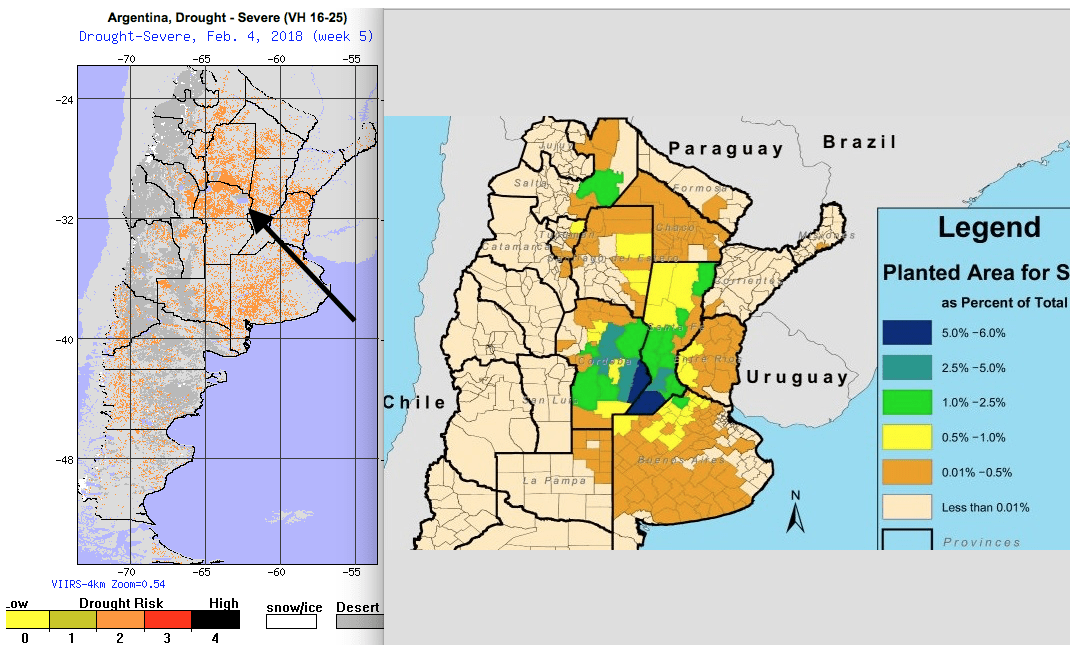
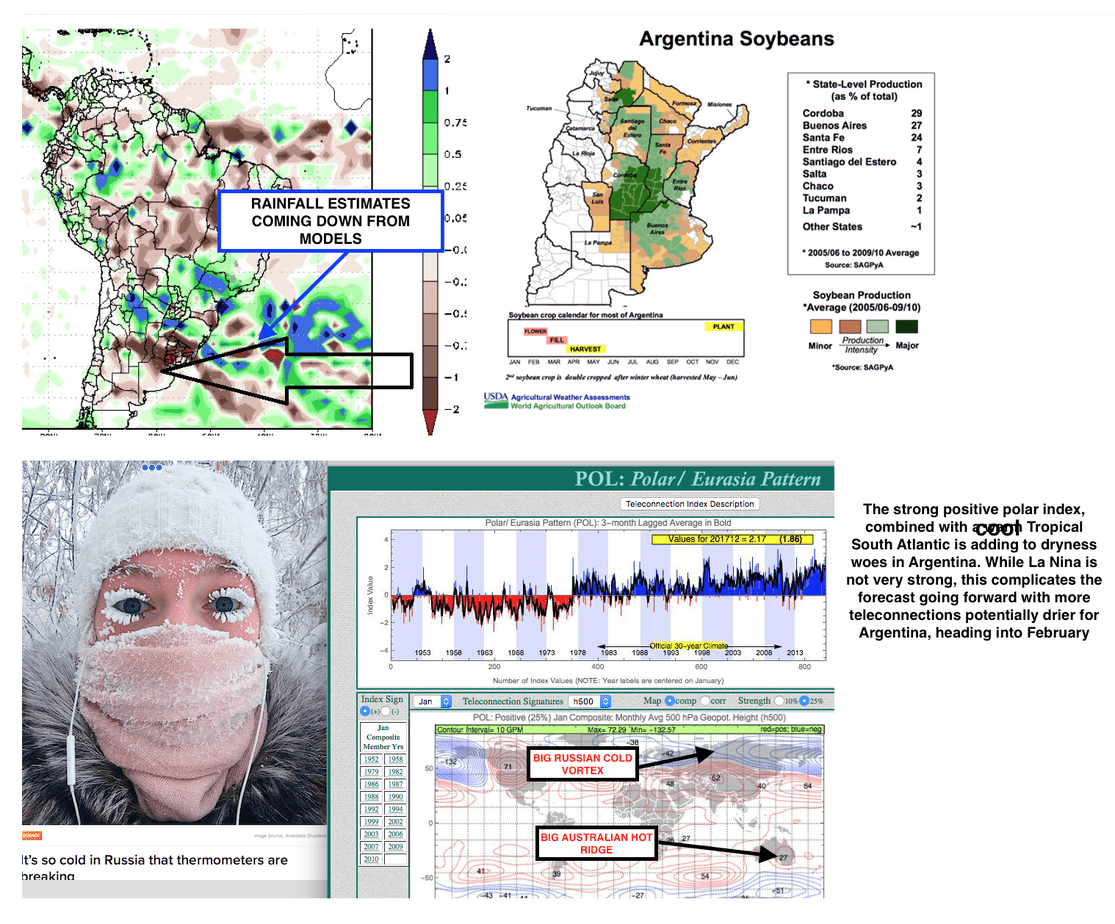
There have also been some global weather for grains in both the northern and southern hemispheres. Dry and hot conditions struck Argentina beginning in December. The lack of relief has begun to worry traders, who were initially expecting a decent crop. South Africa has been suffering from dry weather as well, impacting corn crop conditions. See the POL index we’ve talked about before. A strong signal of dryness in these areas is present. There are indications that the corn crop in Argentina will be hit the worst, with a significant decrease in yields possible.
Wheat
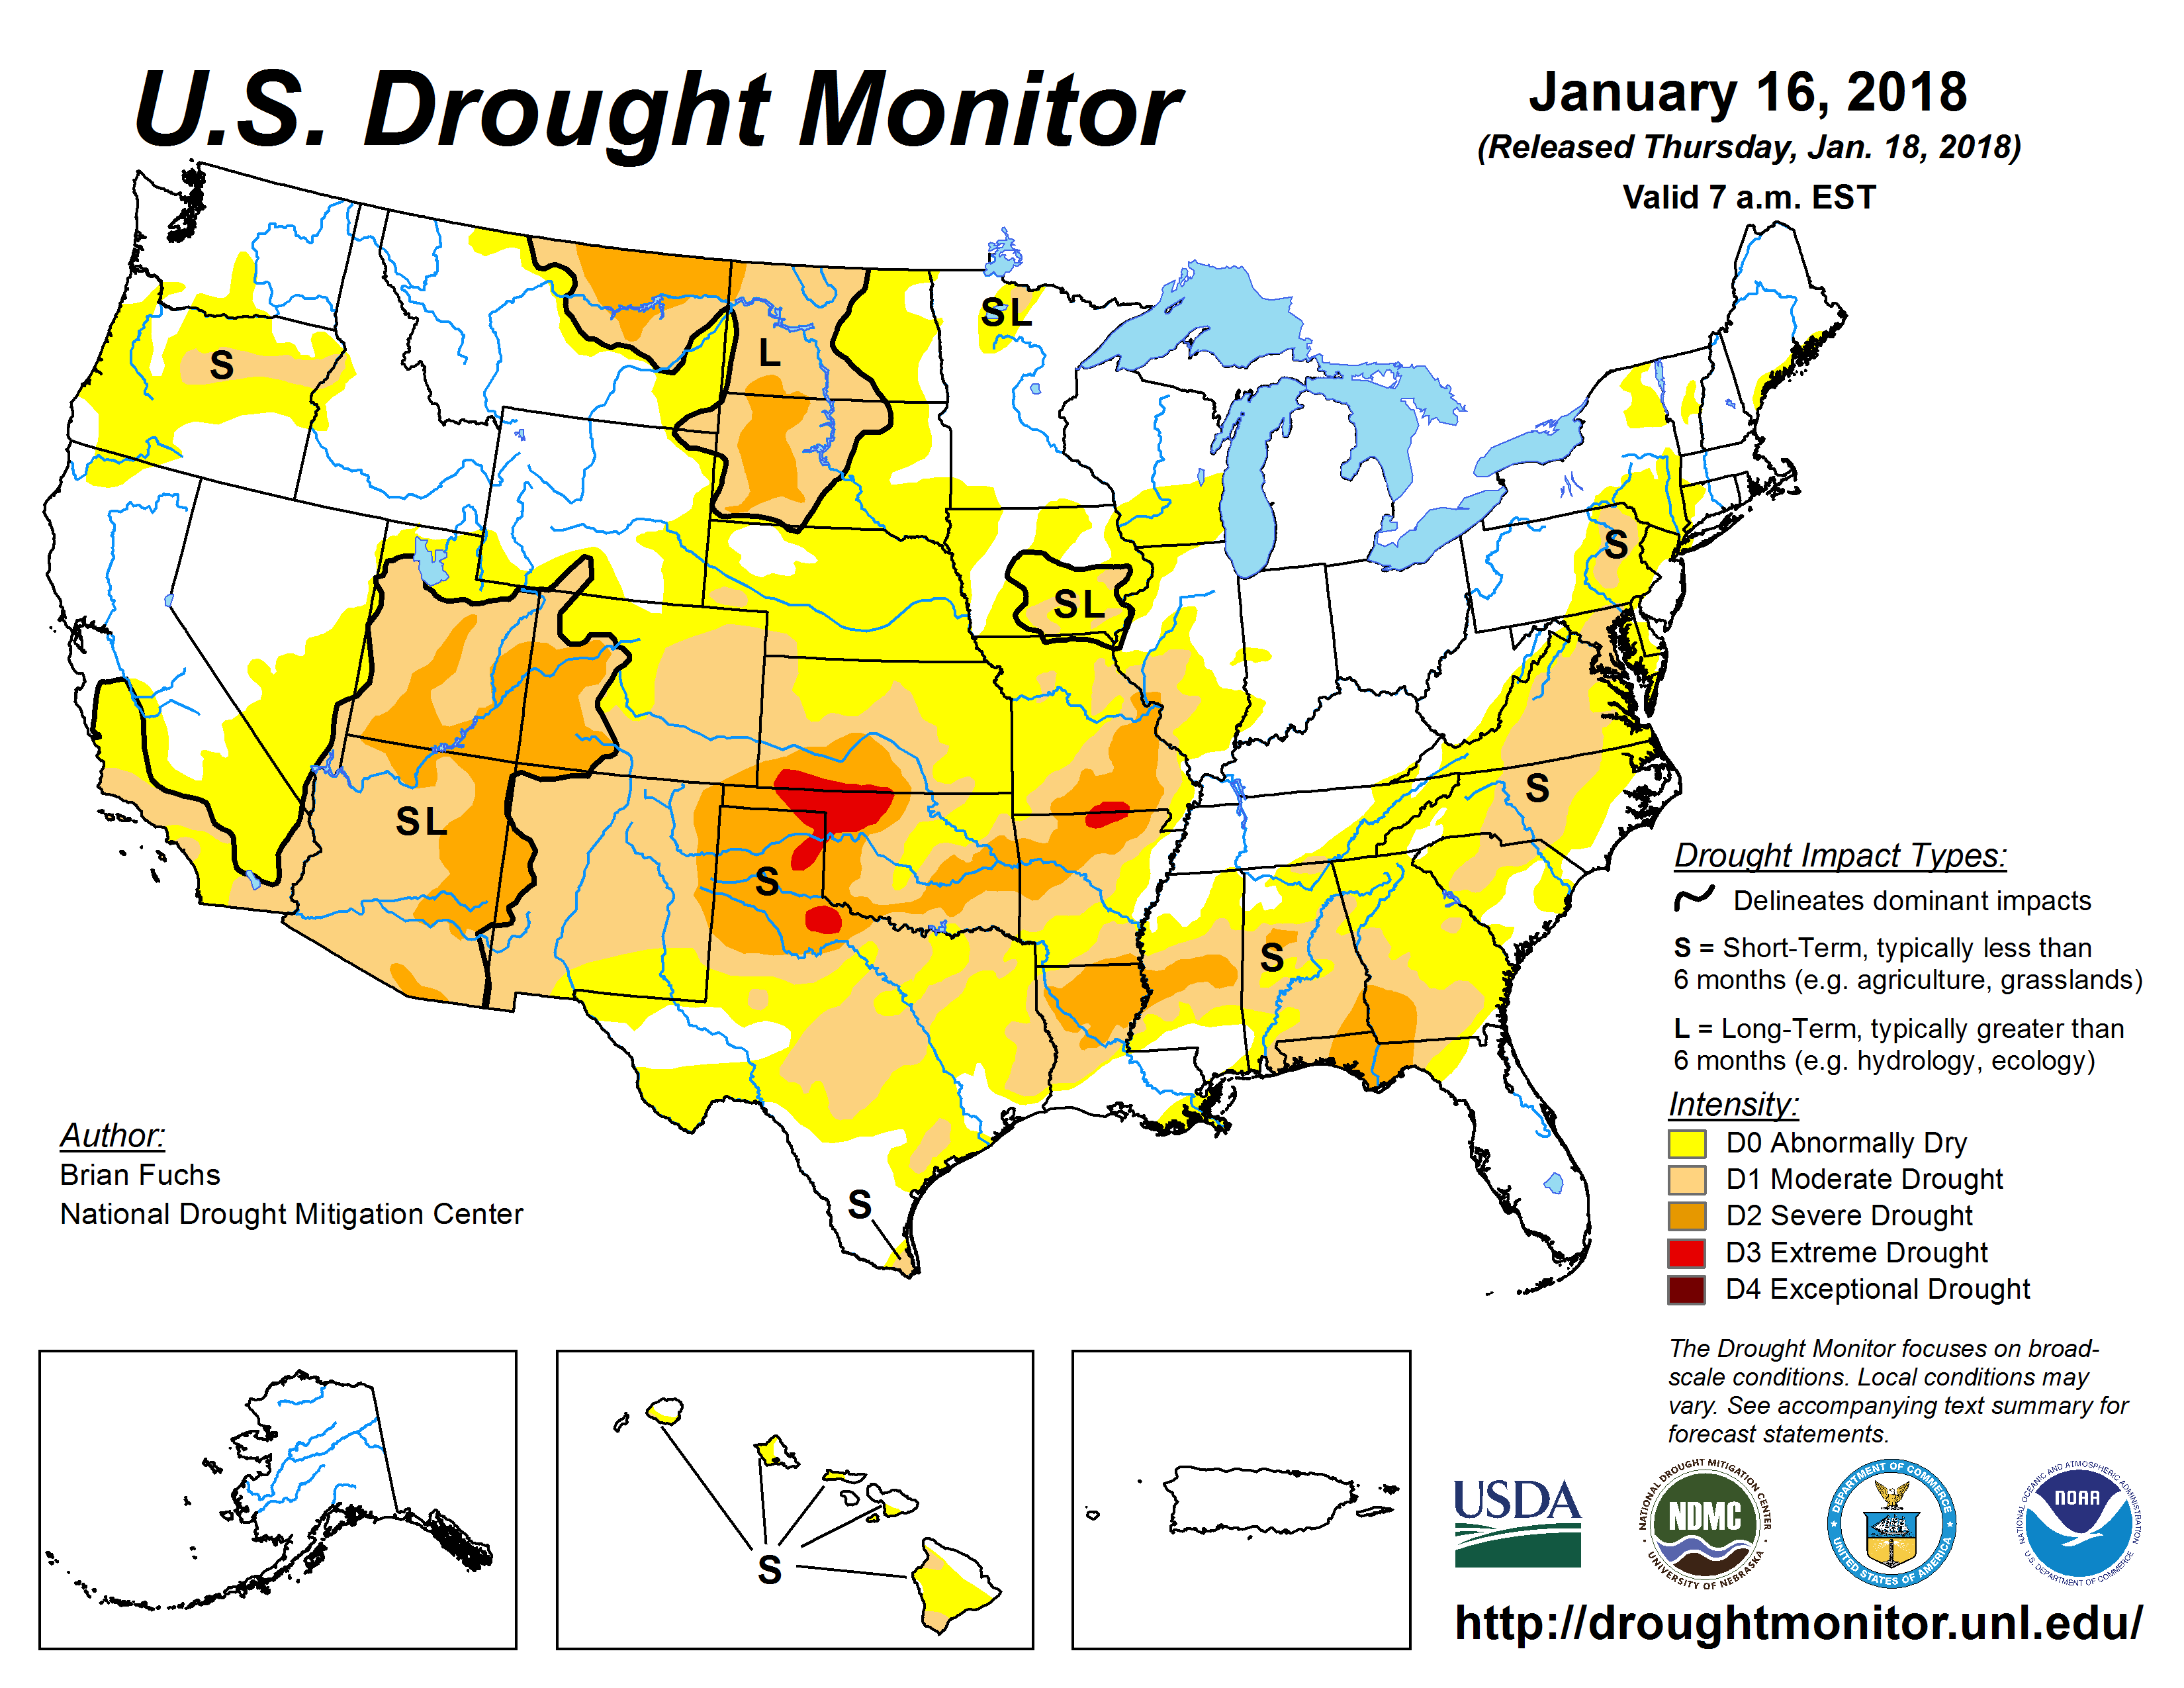
A little closer to home, a drought is developing in the plains. This is the typical pattern during a La Niña. Even though wheat is dormant during the winter, some moisture is needed by the spring.
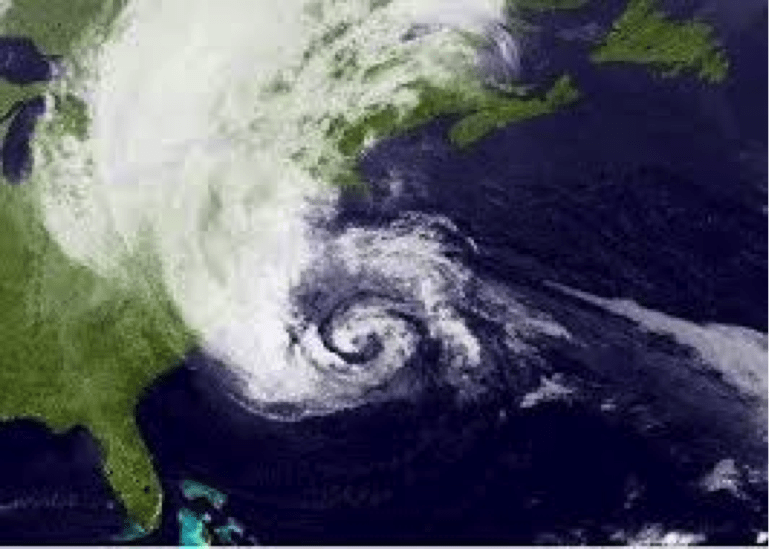
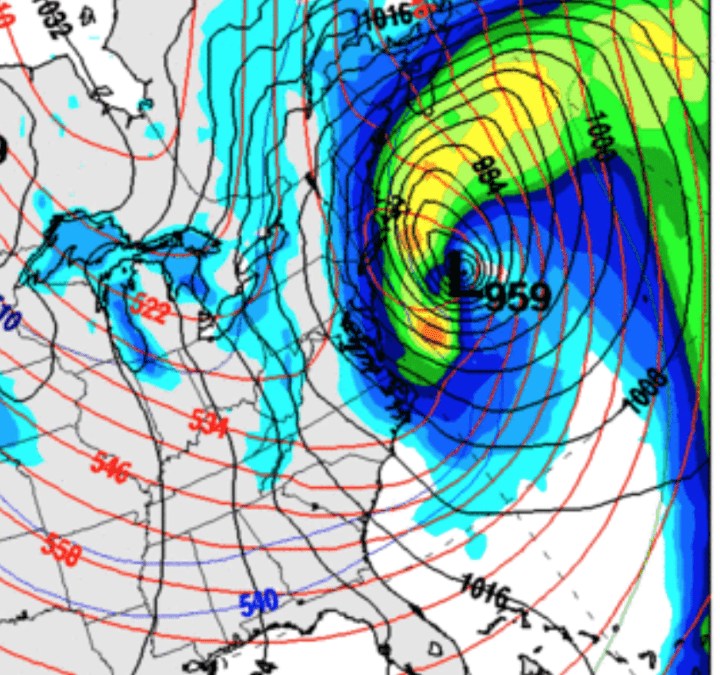
Record cold and very warm Atlantic SSTs may lead to a major snowstorm this week. “Explosive cyclogenesis” refers to a rapidly deepening extratropical cyclonic low-pressure area. The less scientific names for this rare phenomenon are:
Weather bomb
Meteorological bomb
Explosive development
Bombogenesis
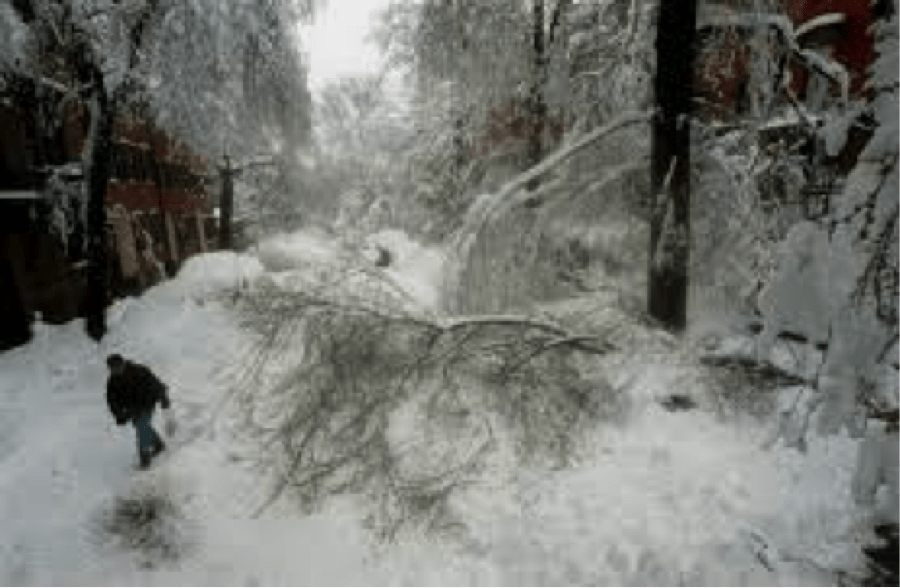
The next snowstorm to brush the eastern U.S. will hit on Thursday and bring record cold. Most noteworthy, this could be an historic event in terms of establishing the lowest barometric pressure ever observed and recorded. Some areas around Boston, including Cape Cod and even eastern Maine, could see 1 to 2 feet of snow. However, the ultimate problem will be the extreme cold with sub-zero wind chills all along the east coast. Therefore, on Thursday, near hurricane force winds could hammer the entire region from Long Island to Cape Cod.
For more information about “Bombogenesis” please go here.
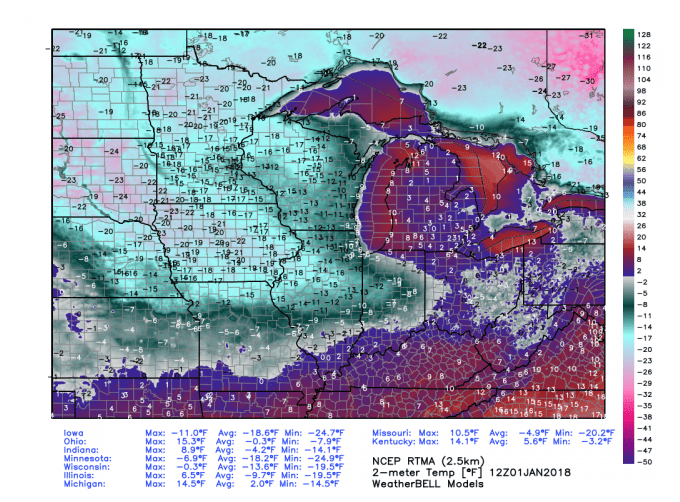
U.S. wheat crop suffering from drought and cold:
In addition to the drought expanding, record cold temperatures probably damaged some U.S. wheat. Therefore, extremely cold weather in the Plains, combined with worsening drought, will likely begin to adversely affect the wheat crop.
Yet, we expect moisture in the Plains by mid January. When spring arrives, if widespread moisture has not occurred across the U.S. grain belt, wheat prices could stage a major rally.
Cold weather is affecting energy markets. After a normal to warm early December, our original winter forecast for cold weather is coming to fruition with temps in the Midwest expected to be as much as 10-15 degrees below zero the next few mornings. But will it last and what is the future for energy prices? That is only for subscribers to find out.
Natural gas and heating oil prices have taken notice. In addition drought expanding in the Plains will have to be watched in the coming months for an explosive move in wheat prices after 5 years of a bear market. Climatech, our long range in house software program, looks at global teleconnections. These include ones such as La Nina, arctic temperatures and weather trends thousands of miles away. It has accurately predicted, months in advance the cold end to December across the U.S. Notice the average 3 month forecast for eastern Australia (wet), South American corn and soybean crops (not a drought) and west African cocoa.
Cocoa crops globally will continue to benefit. This was a main reason why, over the last year, cocoa prices have fallen more than 50%.
Jim Roemer’s Climatech–Above we show how the warm Atlantic and La Nina signal result in average rainfall projections for the next 3 months. Notice the wet signal in eastern Australia through March. Also, generally good conditions in South American for soybeans and good weather in west Africa for cocoa. The blue represents (In inches) above normal rainfall the next 3 months. For more information about how you can DEMO this amazing long range weather forecast program. Please email us at
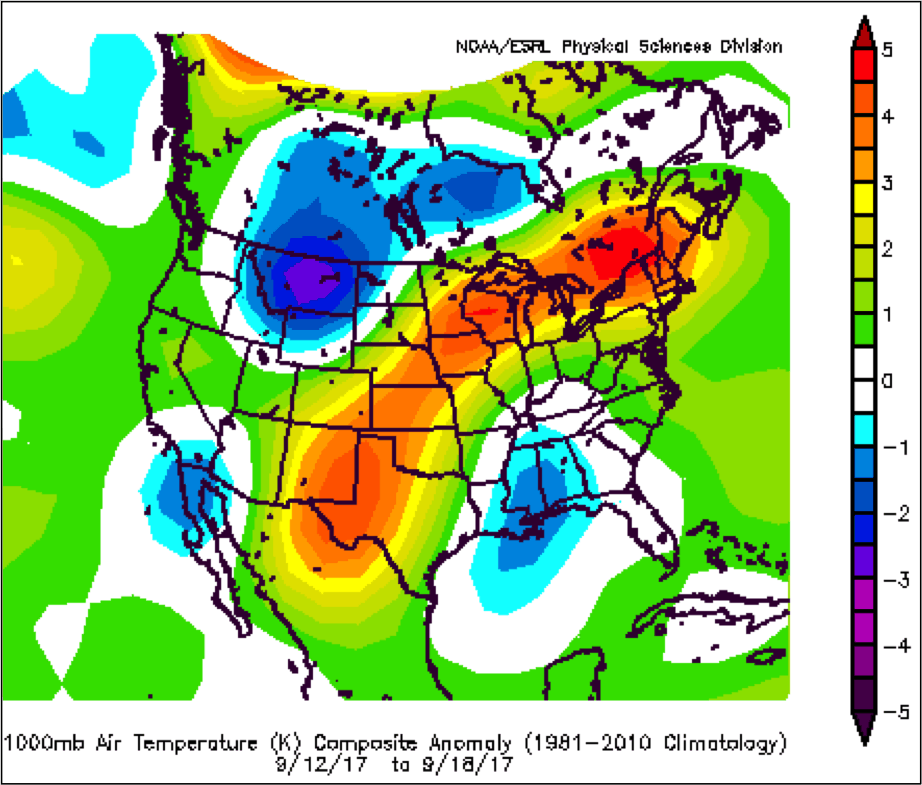
The east coast is experiencing a nice, warm start to autumn. Temperatures will be in the lower 80s for most of New England this weekend. This will be the last chance to catch some rays on the beach! Warm weather has occured over the past week for most of the country. See the temperature anomalies below:
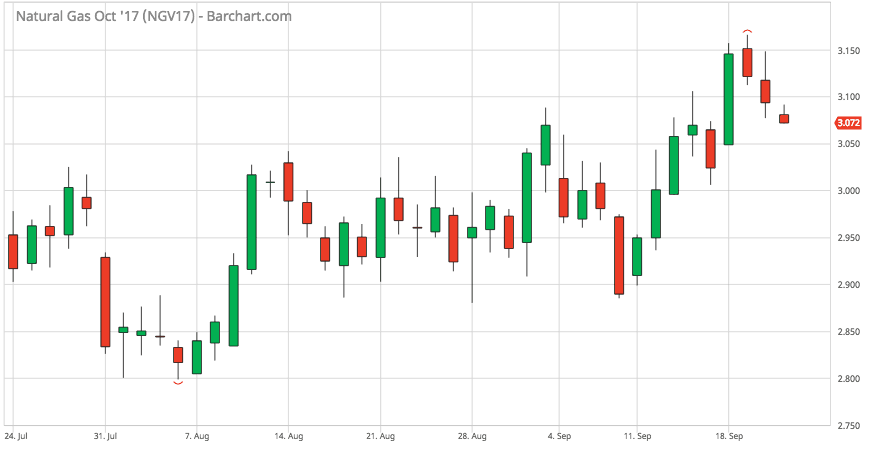
Natural gas traders have been following the warm forecasts closely. Prices began to rise from nearby lows on September 11th. Forecasts accurately showed a strong ridge over most of the country. Warm temperatures cause above normal cooling demand, leading to greater natural gas consumption. Prices have since ‘cooled off’ from the highs, given the latest forecast of more seasonable weather in the 11-15 day range.
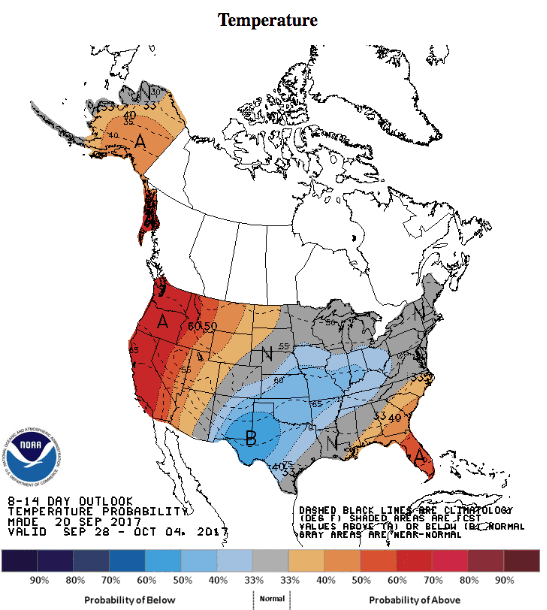
Over the next week, above normal temperatures are expected for the eastern half of the country. After that, below normal temperatures are forecasted.
Will the abnormal warm weather really give way to cooler temps as models suggest? How will natural gas react? For information about how to trade weather in the natural gas market and the ‘best’ long range forecasts available, email subscriptionsbestweather@gmail.com.
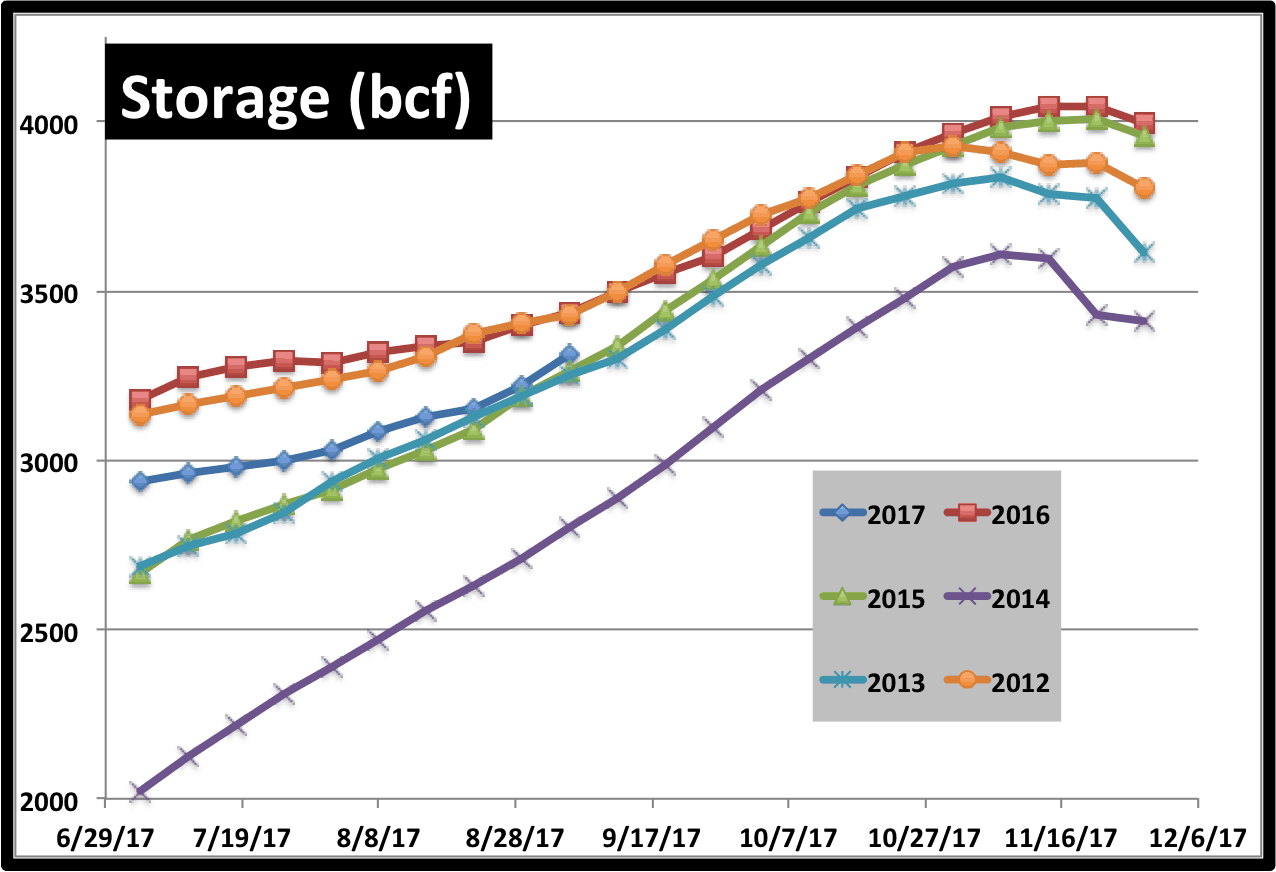
Another fundamental factor affecting the market is the current storage compared to previous years. Current levels are much lower than at this time last year. We are more similar to 2015 and 2013. The October and November weather will determine where we end the injection season.
HELPING YOU MAKE THE BEST INVESTMENT DECISIONS BASED ON THE WEATHER
We use cookies to ensure that we give you the best experience on our website. If you continue to use this site we will assume that you are happy with it.OkPrivacy policy