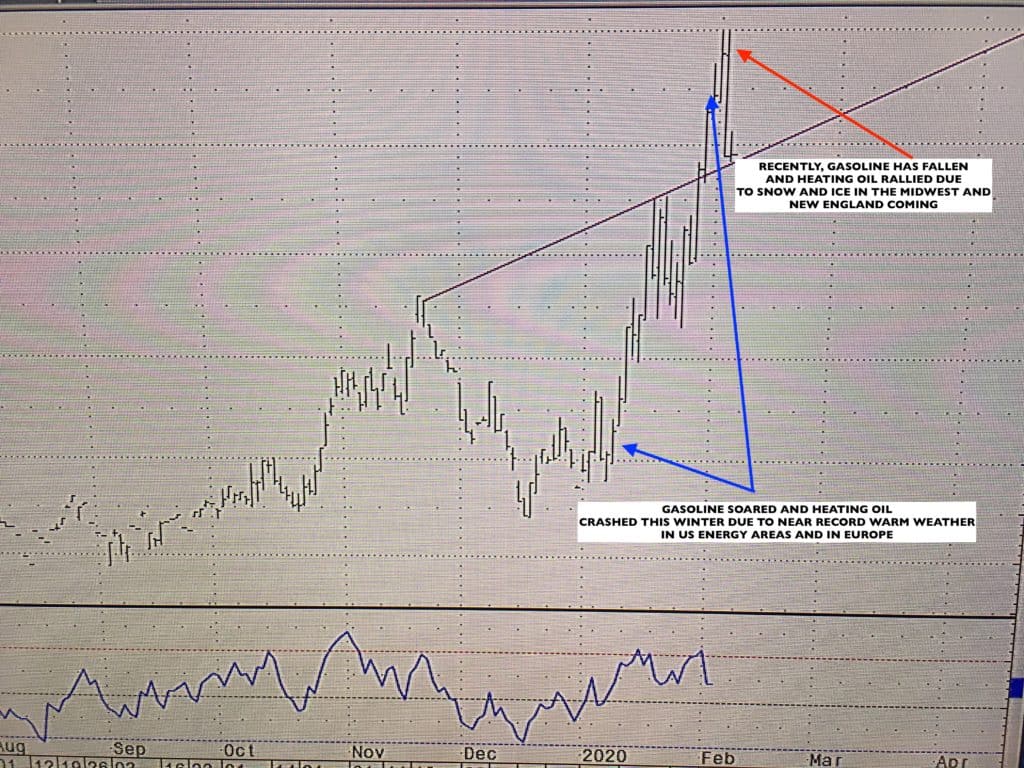
One of the biggest weather related trades in commodities this winter has been short the natural gas market (UNG). However, selling heating oil against long gasoline (for protection) had resulted in a move of over $8,000 a contract the last weeks; until the last few days.
There is sometimes a correlation with snows for Northeast ski resorts and the heating oil market rallying. When big snowstorms and cold weather limit travelers from driving, gasoline prices can sometimes fall and heating oil prices rally. This has happened the last few days. Prior to this week, record warm weather and less global demand helped heating oil prices collapse while gasoline prices soared (as the chart shows above).
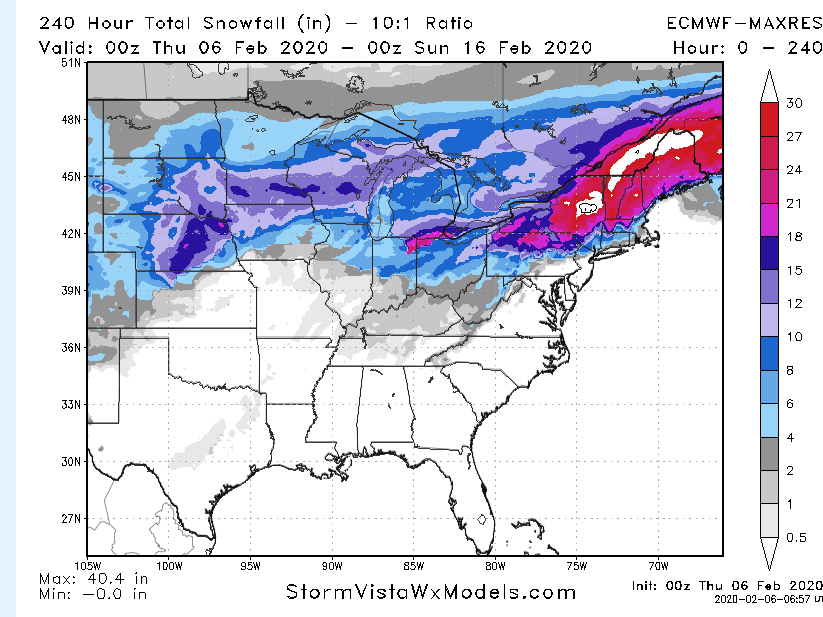
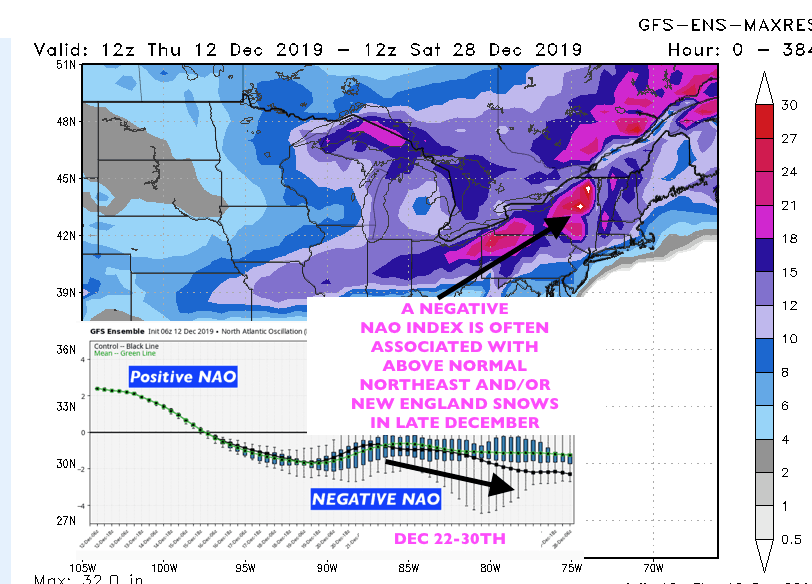
We will see up to 3-4 feet of snow from at least 2 and possibly 3 New England snowstorms over the next 2 weeks. The first big one will hit areas like Jay Peak, Stowe and Killington, Vermont with 1-2 feet as well as parts of northern New Hampshire and Quebec.
Areas in white show the potential for up to 3 feet of snow in New England the next 10 days. Even central New England will see at least a foot or two improving ski conditions.
Trading Snowfall and Other Weather Variables
There is a relatively new web site that lets a meteorologist or weather enthusiast trade their predictions of snowfall, rainfall or temperatures. It is called TradeWx.com You can find out more information at this link
This is a great way for traders to get their feet wet, first hand, trading weather. Tradewx.com will give participants $25 to fund their account for FREE.
tradewx.com
Ski Season Sub-Par in New England will get a Big Boost
The ski season so far has been sub-par in New England due to the warm winter. This is something I forecasted more than 2 months ago. But a big improvement is on the way for central and Northern New England for a week or two.
To see a full report of the New England ski season conditions so far, please see the excerpt below from www.bestsnow.org
AS OF LATE JANUARY
Northeast: The first openings were Killington Nov. 3, Mt. St. Sauveur Nov. 8 and Sunday River Nov. 9. Early November weather was favorably cold but there was mixed precipitation late in the month. Terrain expanded some in early December with 1.5 feet of new snow. Rain on Dec. 14 depressed trail counts. There was some recovery before Christmas, but a tough holiday week with some freezing rain. Conditions in early January improved with 1-2 feet of new snow, but it rained the second weekend. Conditions improved with up to 2+ feet of snow over MLK weekend. Percents open: Hunter 66%, Okemo 71%, Sunday River 91% and Sugarloaf 59%, Tremblant 86%, St. Anne 100%.
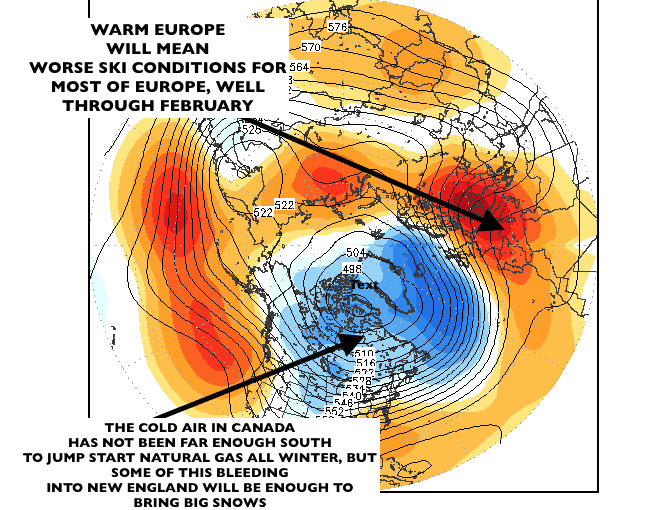
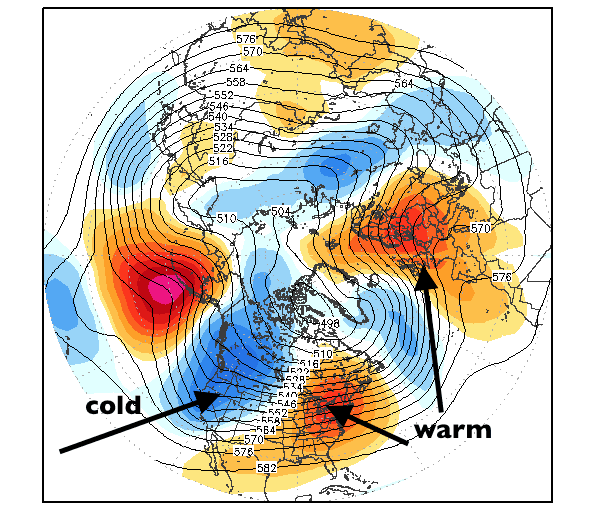
I have been discussing weeks for some energy and ski clients, why certain climatological parameters would likely bring warm weather, not only to the main US natural gas and heating oil areas, but also for much of western Europe.
Indeed, we have seen natural gas prices break some 20% over the last few weeks, while heating oil is under pressure versus the rest of the crude complex that has been pumped up by Iran-Iraq-US military tensions.
JET-STREAM FORECAST PREDICTED IN EARLY DECEMBER THROUGH MID-LATE JANUARY,2020
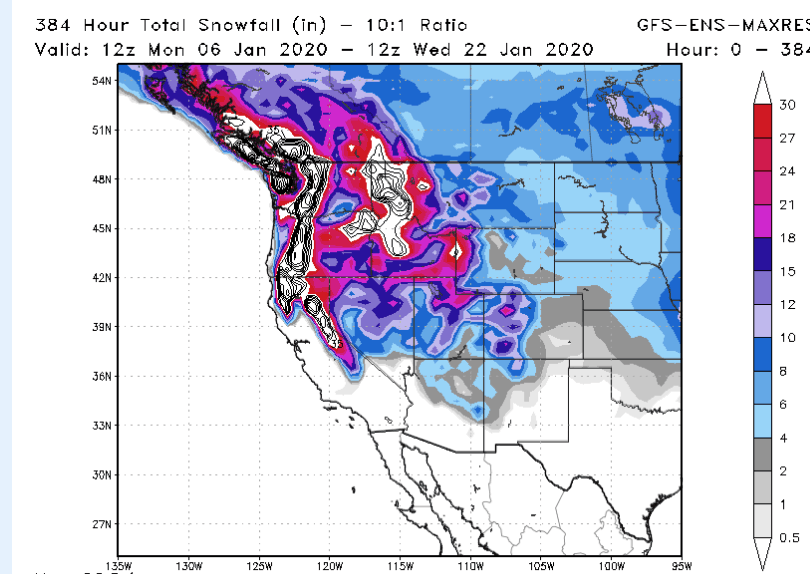
I still look for feet of snow for many western ski resorts the next 2 weeks or so with places like Whistler, Mt. Hood, Big Sky Montana and Jackson Hole getting into the action. The Lake Tahoe region to Utah will also get at least a couple feet of snow. Very cold temperatures will finally lower freezing levels in British Columbia, which was short changed on snowfall through most of December. The colder temperatures mean much higher snow:water equivalent ratios. Hence, some areas out west could see 3-5 feet of snow the next 2 weeks.
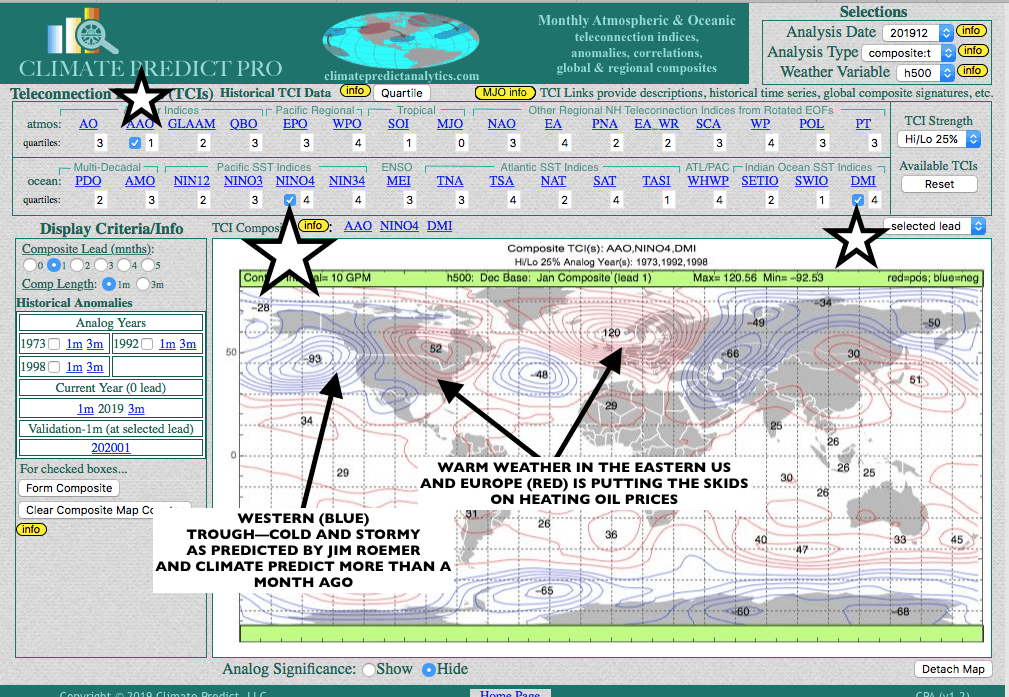
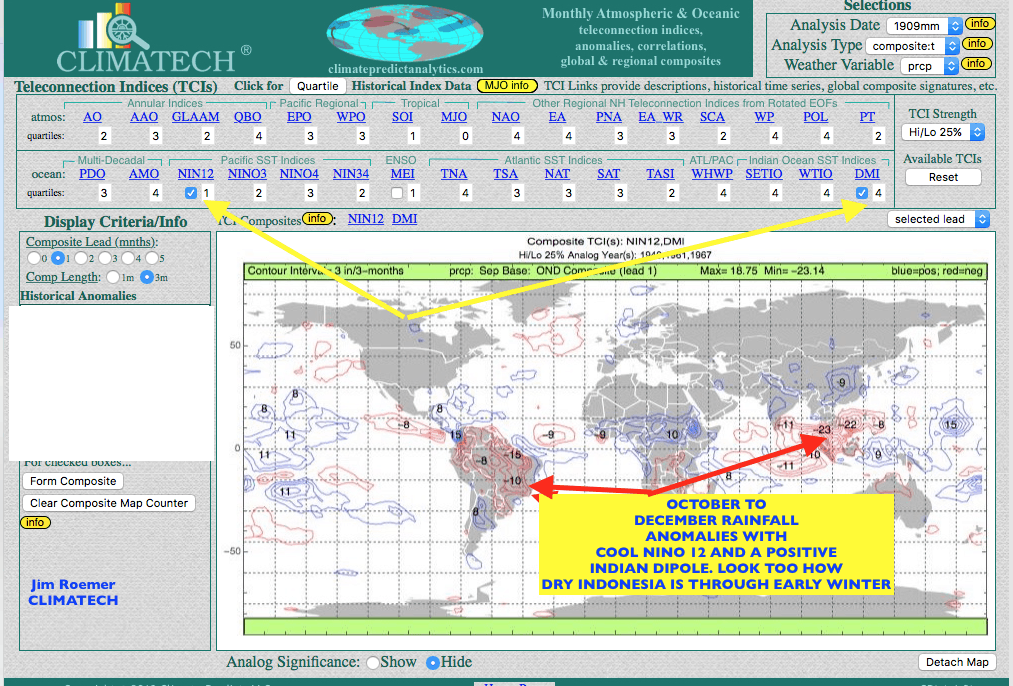
The stars and arrows on CLIMATEPREDICT (above) are the climatological variables that we used to predict the mild, early, eastern winter and cold and story out west. They are a negative AAO index, the positive Indian Dipole, responsible for the fires and extreme heat in Indonesia and particularly Australia, and also a warm NINO34, in which El Nino conditions persist in the western Pacific. While El Nino is weak, this is not something NOAA or many other firms are talking about.
Estimates snowfall through January 22nd. The areas in red represent at least 2-3 feet of snow. However, I believe that some of these areas may see 3-5 feet or more
You can see the jet stream pattern from short term weather forecast models. Again, this is something that CLIMATEPREDICT predicted more than a month ago.
The blue region represents cold temperatures. In fact, parts of the Pacific NW and western Canada will be as much as 15-20 degrees below normal, well into Mid January. The NW flow is ideal for snow in Oregon, British Columbia, Idaho, Washington State and places like Jackson Hole; not just for Tahoe to Utah and Colorado, which saw decent December snowfall.
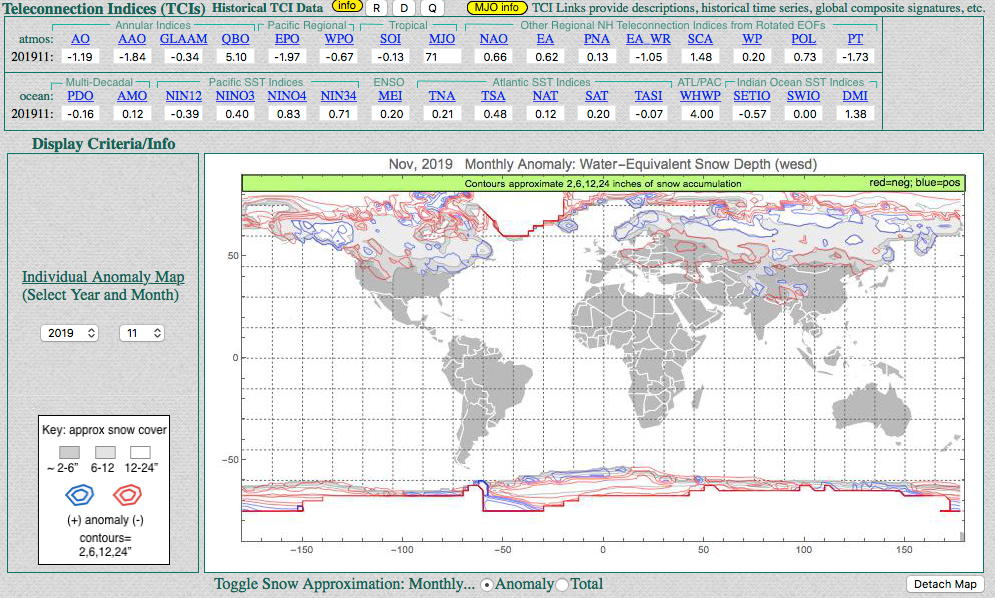
I have a new weather feature that can be accessed for FREE by amateur and professional meteorologists, ski resorts, university science professors and anyone that is a snow lover, or hater. It is called CLIMATE PREDICT (lite version) HISTORICAL SNOW MAPS.
This snow feature will allow anyone to search a 70 year data base for any month of their choice and to see how global teleconnections (such as El Nino, La Nina and ocean temperatures thousands of miles away) influence global winter snow cover. If you are interested in receiving FREE access, check back soon for details or email me at
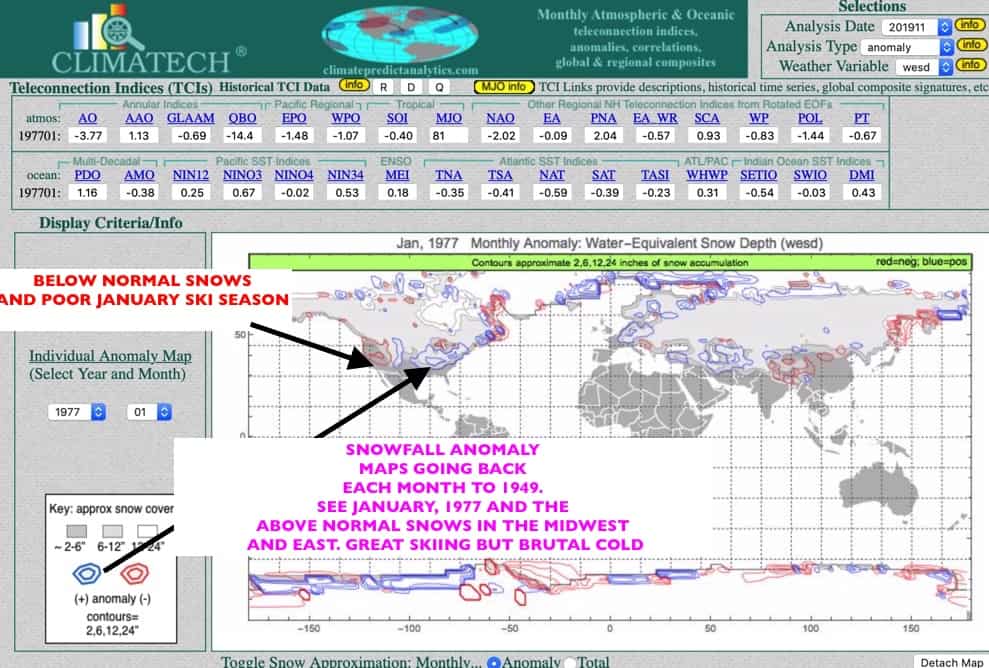
Want to look at different any winter of your choice and which teleconnections affected the snow season? Here, for example, is the frigid early 1977 winter.
The user can look at such teleconnections as the NAO index. We can see, for example the NAO index going negative later in December. This tends to increase snowfall for the Northeast or New England
I have received hundreds of requests from around the world for me to start a weekly or monthly long range weather subscription forecast service. This would be “SECOND TO NONE”‘ , given my 35 years experience forecasting for dozens of ski resorts, farmers and some hedge funds and investors. Of course, weather forecasting can be difficult and due to “chaos theory”, “global warming” and “solar activity”, things can change on a dime.
This is why I will be offering such a newsletter in the weeks or months ahead. It will focus on forecasting for many industries from skiing to commodities with some generic trading and investing ideas.
Coming sometime this winter, a new weather newsletter with occasional updates, (WEATHER-WEALTH) So check back frequently for details.
In the meantime, if you email me at subscriptionbestweather@gmail.com I would be happy enough to send you my preliminary winter outlook for 2019-2020.
While many weather forecasters try their hand at these long range predictions, I am lucky enough to also incorporate a special program called CLIMATECH, which I developed with an alum from MIT. It uses teleconnections such as El Nino, ocean temperatures thousands of miles away, what is happening over the North and South Poles, etc. to help make predictions.
IN THIS FREE REPORT I WILL SEND YOU:
*Why late November will feature more cold and snow for the Midwest and East and is putting a floor in natural gas prices and heating oil spreads. What may December be like?
*Low solar activity; El Nino Modoki; Stratospheric Warming; Weather Weirdos, CLIMATECH ™ what this means for winter and the energy markets.
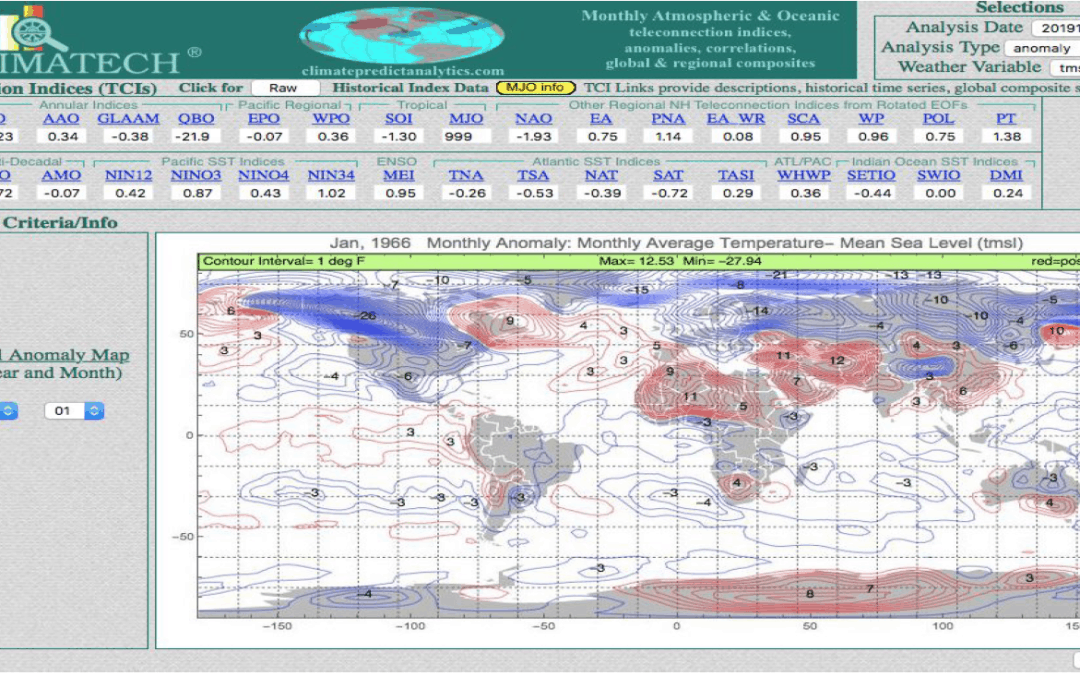
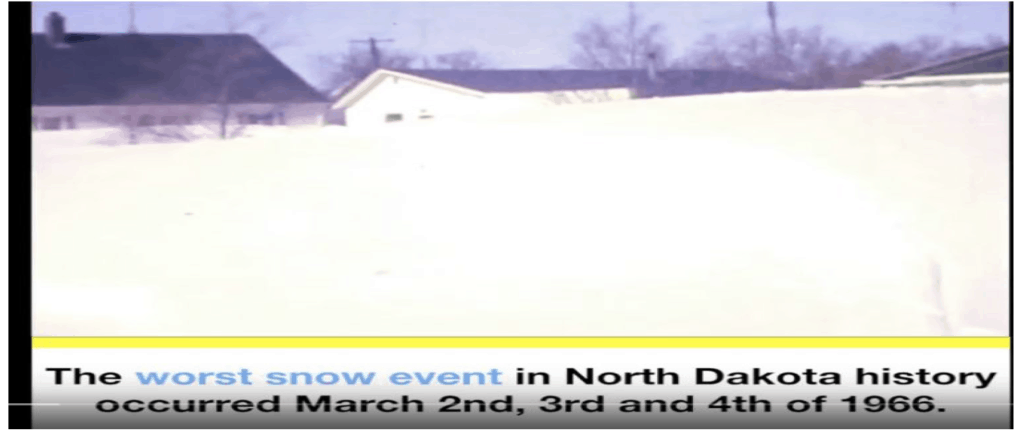
Why does the current global climate support a weather situation similar to 1966 sometime in early to mid 2020? A severe 2nd half of winter in the US.
I appreciate the hundreds of requests and comments around the world from twitter, linkened and other sources with regards to my offering a weather commodity newsletter. This would be simple to understand, timely, and offer the best long range weather forecasts in multiple industries from commodities, to global climate concerns, ski weather, weather and health and travel ideas.
There has been much discussion about the incredibly snowy ski season out west, the end of the California drought and potential for severely cold United States winters ahead the next few years due to an extended, upcoming “solar minimum.” However, giving the possibility of global warming and climate change, the warming oceans and history of the unpredictability forecasting volcanic eruptions that can alter the climate, the topic remains highly controversial. Making blanket one-sided statements is irresponsible and sensationalistic, in my opinion.
In this report, I discuss the implications that a low solar cycle, combined with an El Nino has probably been a key factor in the record western snows this winter and end of the California drought. However, in my view, the warming oceans, brought on by global warming has likely also been a factor.
Record Western Ski Season will continue through April. Why?
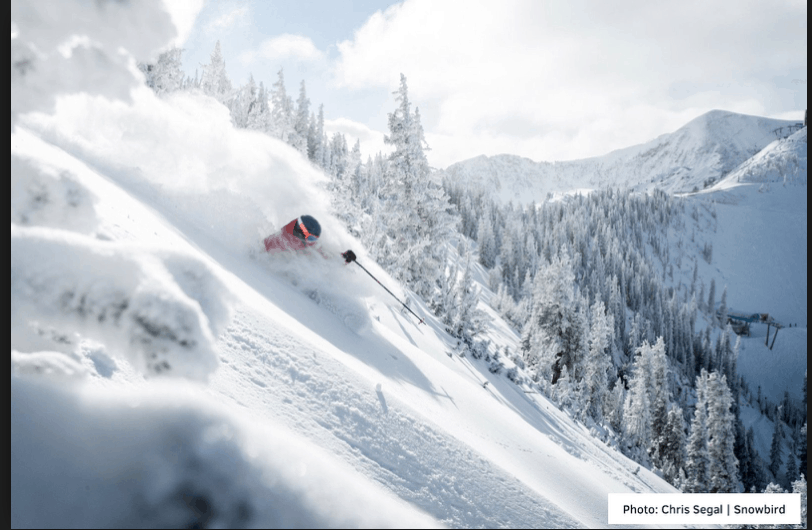
Squaw Valley, California had their greatest February snowfall ever with 315″ and places like Snowbird, Utah (“The Greatest Snow On Earth”) is on pace to have more than 630″ of total snow this winter. This would be the 3rd highest ever snowfall recorded at Snowbird. Previous records were the winter of 1951-52 (641″) and 1983-84 (688″) and the weather the weather pattern looks, I expect another 30-50″ of snow across many areas from Tahoe to Snowbird, Utah, Colorado and even ski resorts in Arizona over the next 10-15 days.
Snowbird, Utah is on pace to have the 2nd or 3rd most snowfall since 1950.
Low Sunspot Activity or El Nino? What has caused the incredible western snows and end of the droughts?
But what is causing this? After all, the last El Nino phenomena (2014-16), was a dud as far as western moisture goes (California’s multi-year drought only worsened), when historically big snows and rains hit the west during “some” El Nino events. While commodities such as sugar, coffee and rice were affected by the most recent strong (2014-16) El Nino in Southeast Asia, much of the western United States baked in droughts. This winter, the combination of low solar activity, coupled with a weak El Nino could, together, be the reasons for the incessant western moisture. But again, there are other factors at play in predicting global climate.
Could solar cycles be to blame for the most recent western droughts, brush and forest fires which wiped out millions of acres of land including some California wineries? I doubt it. Weather is cyclical. The previous western droughts could be a combination of global warming and the fact that we needed to see both an El Nino and low solar activity at the same time to break the drought! ( See my remarks at the bottom of this report) .
Now that we are entering an extended solar minimum (few sunspots/storms on the sun), is the near record western winter snows due to the inactive sun?
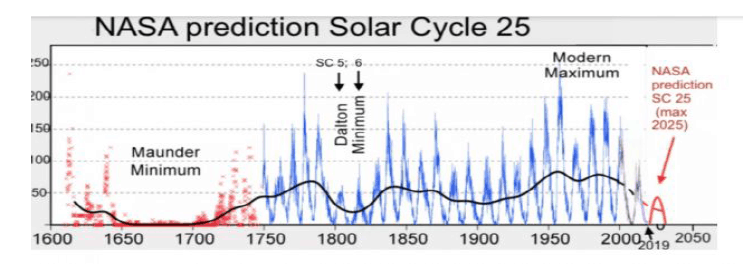
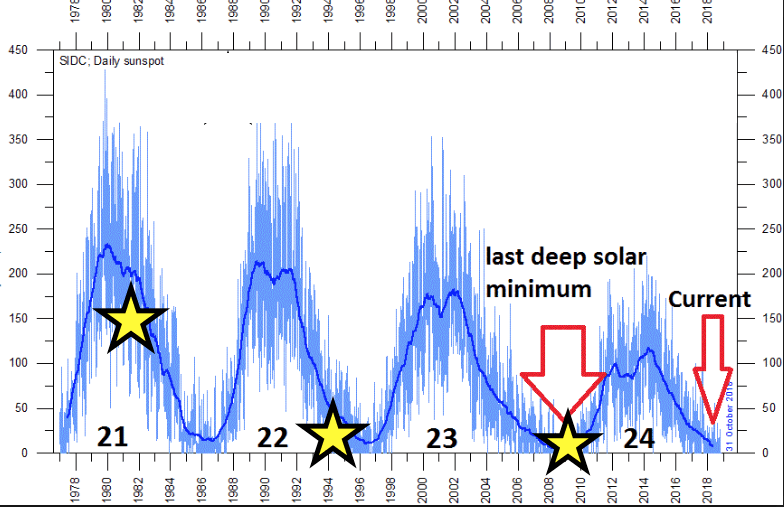
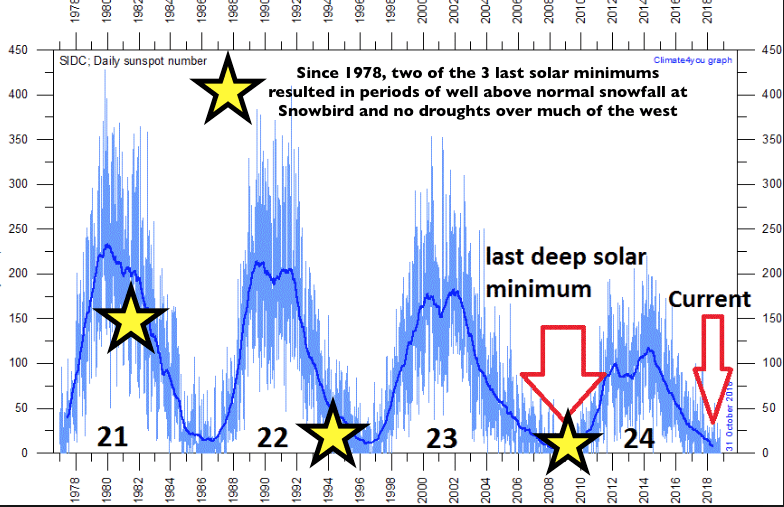
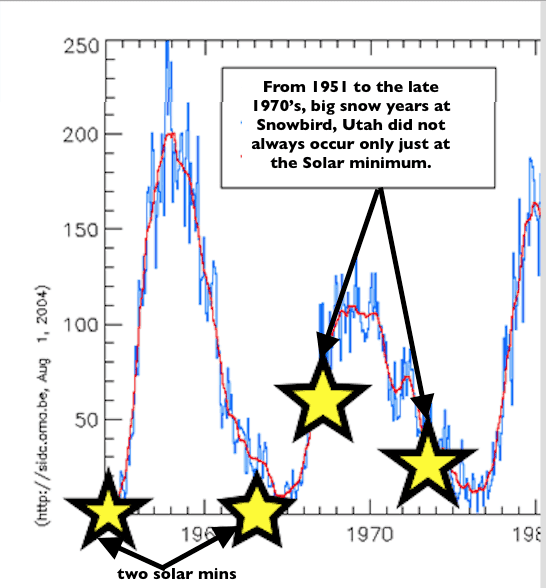
Let’s look at Snowbird, Utah as one example. The greatest winter snowfall totals since 1950 were the winters of 1951-52; 1957-58; 1963-64; 1964-65; 1966-67; 1968-69; 1974-75; 1981-84 (3 year cycle of >550″ of snow); 1994-95; 2008-2009; 2010-2011. The yellow stars on the graphs above show periods of the greatest winter snows aligned with the different solar cycles. Closer scrutiny reveals that there is a tendency for a great ski season out west (again, in this example, we are looking at Snowbird, Utah), during periods of low sunspot activity. However, there were exceptions. For example, the great ski seasons from December, 1981 all the way through April of 1984 occurred when there was an active sun (see cycle 21). In addition, the winters of 1965-69 occurred after, not during, a solar minimum.
El Nino and Cosmic Rays
Many meteorologists feel that the incessant western snows and easing of the California drought ( will be a huge blessing for thousands of farmers), has been due to El Nino. However, in nearly half of the listed snowiest winters at Snowbird, Utah, described above, there was either a La Nina or La Nada (neutral year).
Volcanic activity, El Nino, as well as the warming of the oceans due to Climate Change, are in my opinion, at least as important, if not more so than solar cycles. However, when correlated together, El Nino with low solar activity seems to be a better “weather pattern” predicator.
So what about El Nino? There is a correlation with low solar activity increasing what we call Cosmic Rays that can contribute to more cloudiness along the equator and affect the Trade Winds and contribute to El Nino. However, there are also many El Nino’s, which occurred, not because of a solar minimum but due to other climatic variable. Nevertheless, the present weak El Nino probably never would have happened if it was not for the low solar activity.
Cosmic rays are energetic particles that originate in space and our sun and collide with particles as they zip through our atmosphere. “Solar Cosmic Rays”(SCR’s – cosmic rays from the sun) originate in the sun’s chromosphere. Most solar cosmic ray events correlate relatively well with solar flares. Cosmic rays can affect the earth by causing changes in weather and possibly long term climate. Moving at close to the speed of light, these nuclear fragments smash into air molecules hard enough to knock electrons loose. This well-documented process creates negatively and positively charged ions. During low sunspot activity (like we have now).
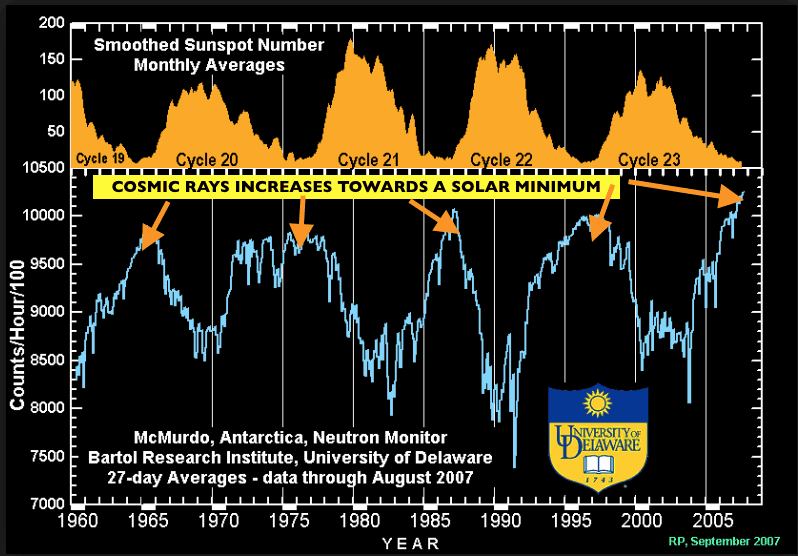
The most well-documented connection between the sun and Earth effects, other than the total sunlight, is in the cosmic rays received. It is believed that this is caused by the solar magnetic field being weaker at solar minimums, which lets more cosmic rays penetrate into Earth’s atmosphere. Hence cosmic rays are at a maximum when solar activity is at a minimum.
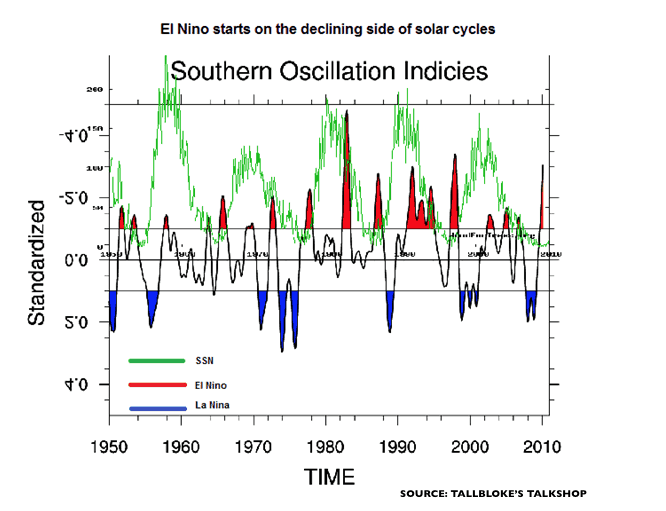
The chart above shows solar cycles (green lines) from 1950 to 2010. The red arrows represent El Nino events and the blue arrows La Nina events. At first glance there appears to be “some correlation” with El Nino events typically occurring at lower solar cycles and high Cosmic Rays. However, this theory remains controversial, just as the “Global Warming-Climate Change-Solar Cycle topic” has remained immensely controversial.
According to two solar physicists, Robert Leamon from NASA Goddard Space Flight Center, and Scott McIntosh from the High Altitude Observatory at Boulder, CO, they have made an interesting observation that links changes in solar activity with changes in the El Niño Southern Oscillation (ENSO), (see the chart above) but state that it is “clear that solar activity” is not the only factoring affecting El Nino.
In a separate study several years ago, according to Eddie Haam, School of Engineering and Applied Sciences, Harvard University, ” Both the 11-yr solar cycle and the El Niño–Southern Oscillation (ENSO) phenomena are quasi periodic. There have been claims that the two are correlated (Solar Cycles and El Nino/La Nina). However, both phenomena are also highly autocorrelated. Caution should be exercised when testing for the statistical significance of the correlation of two autocorrelated time series. There is so far no solar ENSO (El Nino/La Nina) connection found that is statistically significant.”
KEY POINT
My point is that there are many factors affecting global climate. Putting too much faith just into solar cycles and El Nino alone in forecasting severe winters ahead and extreme weather events around the world have to be taken with a grain of salt. The fact El Nino conditions have been prevalent for much of the United States this winter (not necessarily in other parts of the globe, yet) is probably is due to some interaction with the Solar-Cosmic Rays cycle.
I believe the warming oceans, brought on by Co2 emissions, volcanic eruptions, etc. has just as much of an effect on global weather patterns as solar cycles and El Nino/La Nina does. It is a very complicated, interwoven subject!!
However, it should be noted that there have only been 4 events since 1951-52 when both low solar activity and El Nino occurred, together with record snowy western winters (winters of 1951-52; 1994-95; 1963-64; 2009-2010). Snowbird, Utah, for example had between 520-688″ of snowfall during those winters. This winter (2018-19) will be the 5th year this scenario has happened. Hence, I believe there is some important conclusions that can indeed be made when both low solar activity and El Nino occur, simultaneously.
HELPING YOU MAKE THE BEST INVESTMENT DECISIONS BASED ON THE WEATHER
We use cookies to ensure that we give you the best experience on our website. If you continue to use this site we will assume that you are happy with it.