by Jim Roemer | Oct 31, 2017 | Forecast, Skiing
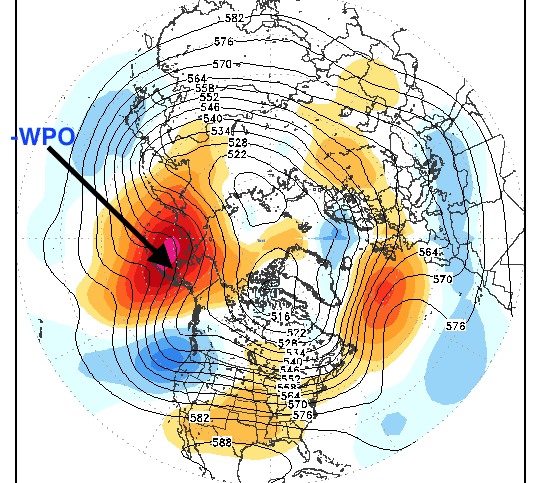
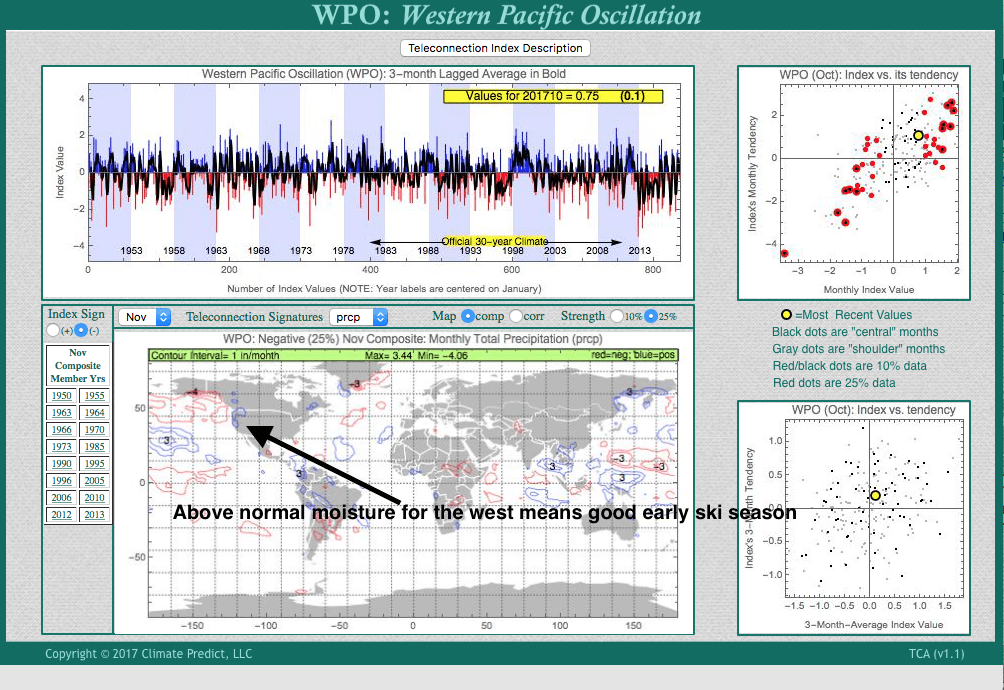
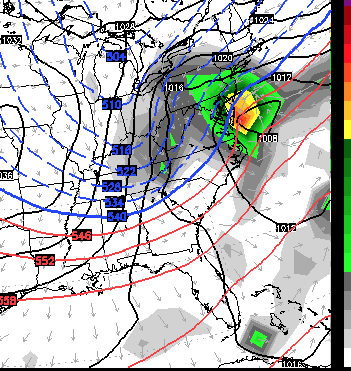
The negative Western Pacific Oscillation index (WPO) is depicted by a warm, strong block to the NW of Alaska well into November. The strong negative phase of the QBO (stratospheric winds, some 25-50 miles in the stratosphere) could result in this block remaining well into November. Its implications will be important for energy and natural gas traders, but only paid clients will get a heads up with respect to these markets. A week ago we began discussing a possible warm start to winter and natural gas prices have taken it on the chin as U.S. production is increasing, but will this continue? Subscriptonsbestweather@gmail.com
CREDIT: stormvista.com
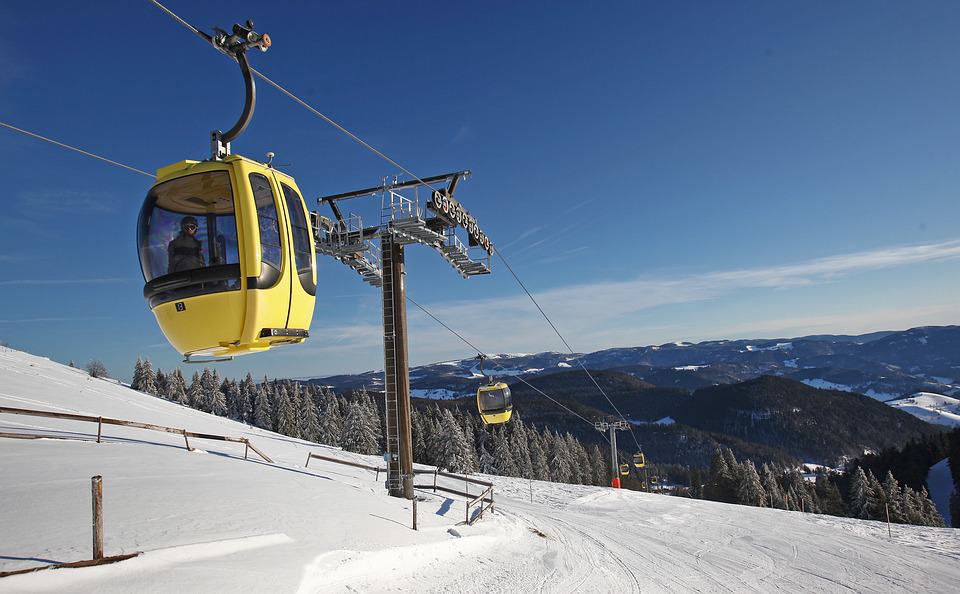
Early Snow for Ski Areas
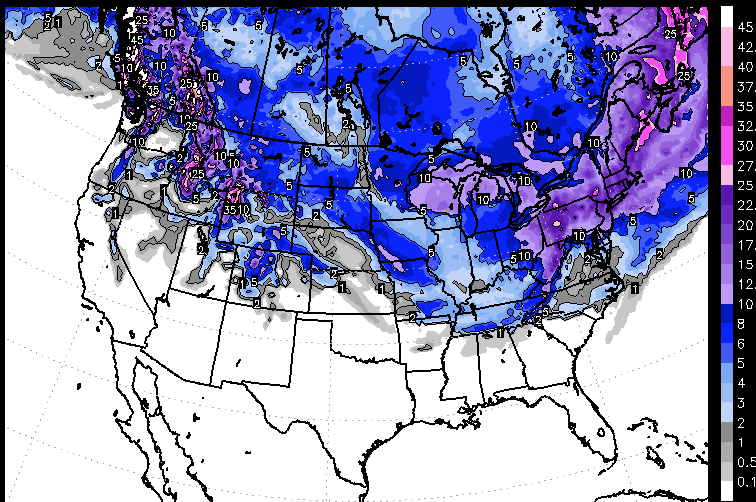
I have been doing ski forecasting for Snowbird, Utah for over 15 years and used to forecast for more than 25 ski areas nationwide, particularly in Vermont and New Hampshire. The combination of a -WPO coupled with a developing La Nina suggest a very snowy November with feet of snow from the Cascades to the Sierras and Utah. The map below shows the relationship of moisture in November in years when we have this strong block (-WPO) as shown above—very snowy with feet of snow. Usually it is El Nino not La Nina that results in the best ski seasons out west, but there are exceptions. For more information please visit www.bestsnow.net
by Jim Roemer | Mar 6, 2017 | Energy, Forecast, Skiing
(Map Above) CLIMATECH AND MARCH TEMPS WITH A NEGATIVE WPO INDEX NORTHWEST OF ALASKA AND OVER NORTHEAST EURASIA. Normally this should suggest a colder March, but due to a developing El Nino, melting global sea ice and a warming planet, any sustained cold has not been the rule this winter. Natural gas prices have rallied at times even when March and April have been warm.
The -AO and -WPO on the front page, from our program, Climatech, suggests a possible big Nor’easter around the 14th, as well as snows this Friday.
For the first time in weeks, we see the Arctic Oscillation go negative. This offers some colder risks and snow for the upper Midwest and the Northeast into mid- March and offers a potential bottom in the natural gas market and some treacherous driving conditions for parts of the Northeast, especially after the 14th As the map below shows, some places in the Northeast could see more than 10-15″ of snow. Some ski resorts will benefit from late season snows in Vermont, New Hampshire, Maine and upstate New York, which have seen a warm winter and freeze-thawing lately.
Total snowfall next 2 weeks
SNOWFALL PROJECTIONS (above). Ensemble maps from WSI
Arctic Oscillation index has been positive most winter, but you can see it heading slightly negative for the first time in weeks. The main impetus for the colder weather has to do with a weather feature, thousands of miles away over Northeast Asia. (negative WPO index–map below). Notice the colder mid-late March forecast (blue). Nevertheless, the warm Atlantic and a developing east-based El Nino have resulted in a warm winter pressuring natural gas prices and various natural gas equities. However, given colder weather and snows into mid-March, the natural gas market has built into much of the winter bearishness.
by Jim Roemer | Feb 20, 2017 | Climate, Skiing, Weather
A look at Ski Conditions in the U.S.and Canada So Far This Winter. Big Snows out West, Tell-Tale Signs of El Nino again.
Please go to our favorite ski site for more detailed reports of snow conditions. WWW.BESTSNOW.NET.
After a late start, snowfall has been abundant across the western U.S. skiing areas the past few months. Snowbird Mountain Resort’s YTD total so far is a whopping 358″. Over the past 30 years, their average total snowfall by the end of February has been 284″. Hence, a 70″ surplus is guaranteed by the end of February 2017. However, this is likely underestimated, as several more feet of powder are the forecast for this week. On the other side of the country, recent storms have helped turned the tide in the battle for a recovery season after the snow drought of 2015/16. New powder arrived just in time for skiing glades, snowshoeing and snowmobiling around Valentine’s Day. Consequently, many couples staying at bed & breakfasts and mountain lodges in Vermont enjoyed the fresh snow.
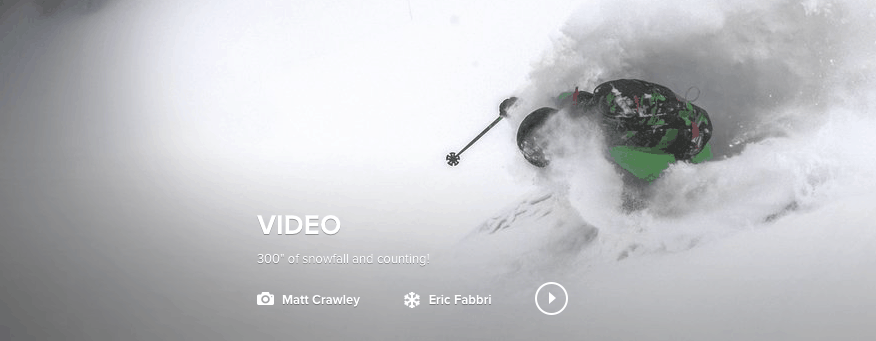
To see video go to www.snowbird.com
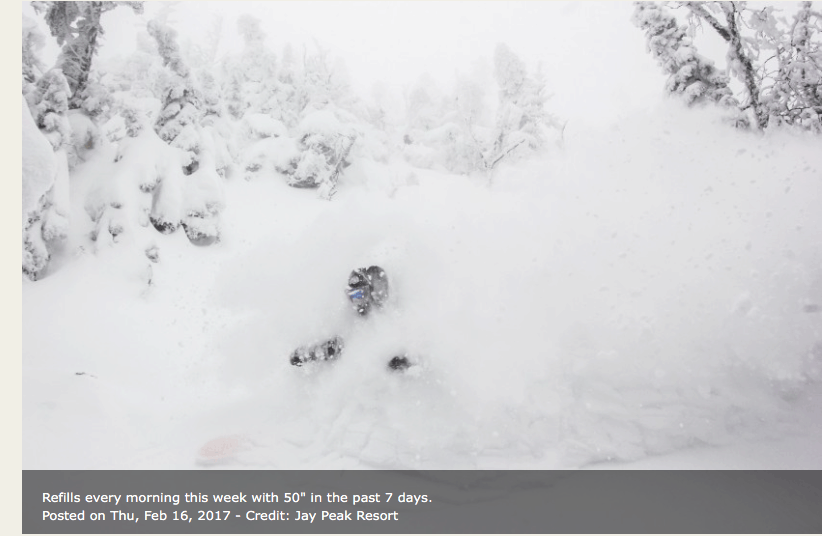
The drought is over in California with some historical rains and snows both beneficial and a detriment out west. Feet more snow is coming to the West through the beginning of March. The big time snows in northern New England will turn a bit icy with freeze-thawing the next 10-14 days as ski resorts in Vermont to New York and New Hampshire see day time highs climb well into the 40’s and 50’s at times. This will mean freeze-thawing and a lot of the power gone shortly. However, most studies and the chart we show below suggest a potential improving weather pattern for Northeast ski resorts and colder weather after about March 7th. The odds seem to favor a colder than normal March after that time which could mean good news for New England ski resorts.
As a result, you might be thinking “Ok Matt I get it, conditions are perfect. I’ve heard it all about it from my co-workers and family members. Enough is enough! Therefore, I’m booking my trip for the spring. Should I venture to the Northeast or risk the ‘Oregon Trail’ and head to the powder of the West? Where will I get more snow for my buck?”
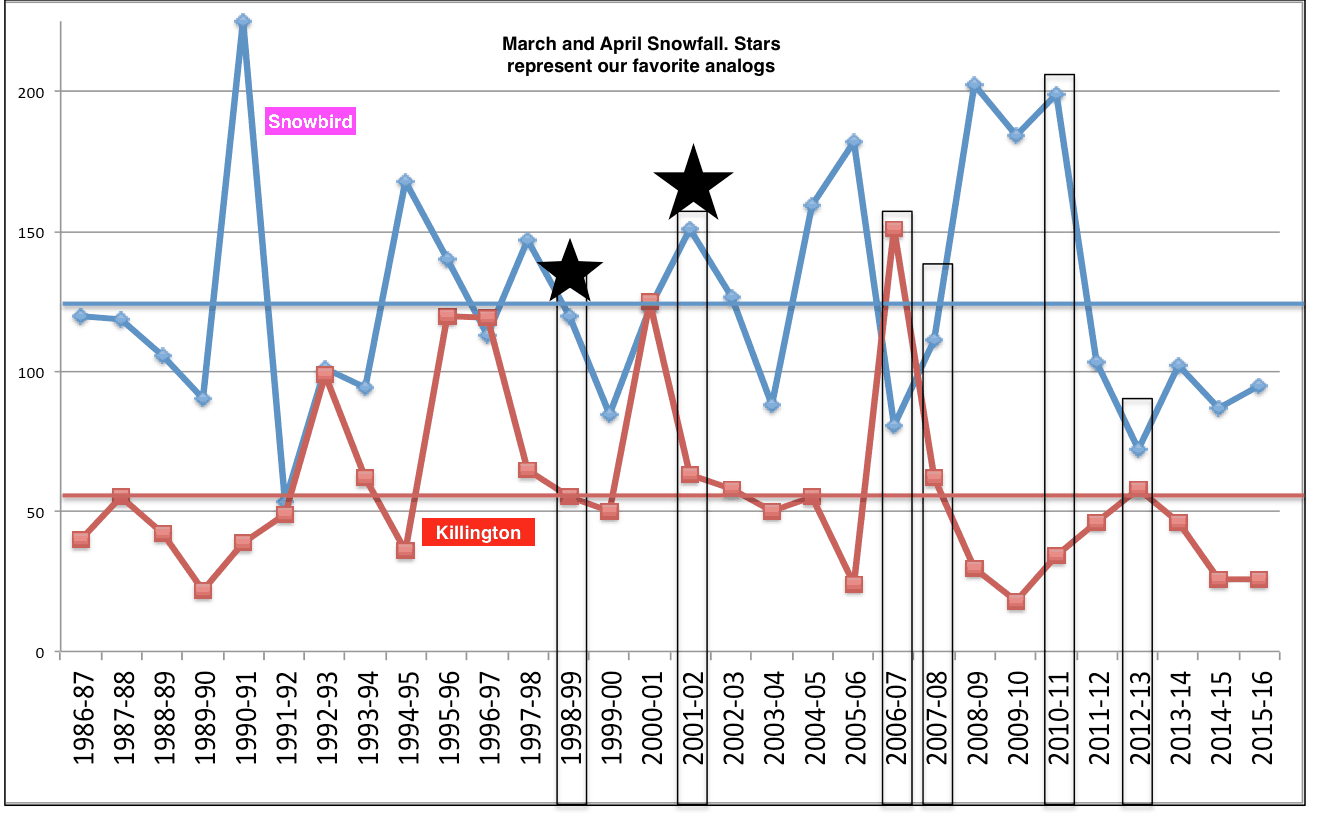
Analog Snowfall Forecast
To answer this, we took a gander at the historical late season snows for two mountains: Snowbird, Utah and Killington, VT. The late-season snowfall totals for the past 30 years (March-April) are shown in the image below. In addition, the average for Killington (Snowbird) is the flat red (blue) line. The years with black boxes highlight some of the analogs we’ve used to forecast the 16-17′ U.S. winter. These years are a mix of our sea ice analogs, +AMO, +NINO12, and +QBO. These are teleconnections. which help us forecast long range weather.
The chart above shows our favorite analog years and projected March-April snowfall. 1999, 2002, 2007, 2008, 2011, 2013 appear like the best analogs. However, when looking, for example at which of these years had incredible California snows and places like Snowbird already having more than 330″ of snow by early February, the spring of 2002 appears the best. You can see from the chart above that Snowbird had close to 150 inches of snow in March and Killington about 55 inches. While not written in stone (timing could always be a week or two off), this does suggest incredible snows still in Utah the next month or so. After freeze-thawing in New England the next 12-15 days, conditions could improve the last half to two-thirds of March for many New England ski resorts
March Temp forecast (below). After a record warm February for much of the U.S., somewhat colder weather can be expected later.

Comparing two of our favorite analogs—-notice the colder than normal outlook in March (top map) and above normal moisture over New England. This is at the surface, not 5,000-10,000 feet up. Hence, for example, the higher elevations such as Snowbird should get great snows into March, even though this map shows below normal snowfall in green. The blue represents above normal precipitin and possibly in the form of good snows in New England, following freeze thawing the next 2 weeks.
by Jim Roemer | Feb 14, 2017 | Climate, Commodities, Skiing, Weather
Climatech above showing positive Global Angular Momentum above has been partly responsible for the warm winter and the incredible moisture out west and huge snows predicted as early as last November. This feature along with a positive QBO index have offset all forecasts by meteorologist this winter, calling for a cold winter. When GAAM is positive, the signals are more like an El Nino rather than a cold U.S. La Nina type winter.
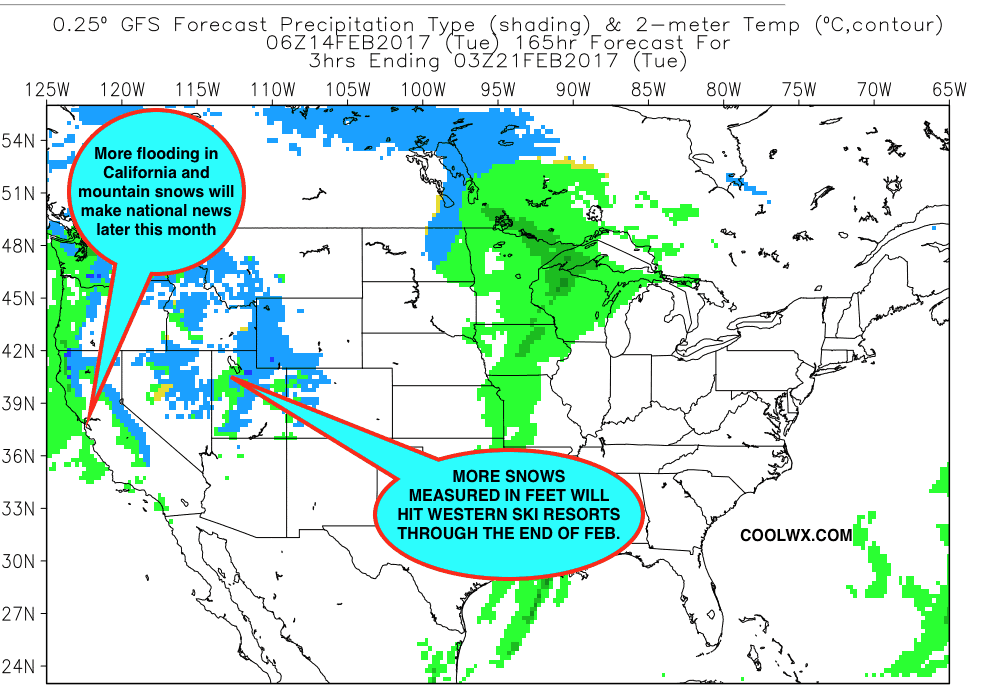 The continued “pounding” of the western U.S. has prevented major cold from affecting much of the Midwest and East this winter, and greatly responsible for the recent collapse in natural gas prices The Atmosphere has acted more like an El Nino, than a La Nina due to positive Global Angular Momentum. This may suggest that a weak El Nino could be on the way by summer. Cocoa traders will pay close attention to whether a weak El Nino will form, after our predictions last Fall of growing global cocoa production and a potential collapse in prices
Watch the storms Pound the West the next 2 weeks click here

by Jim Roemer | Jan 13, 2017 | Forecast, Skiing, Weather
In one of the most Jekyll and Hyde weather patterns in recent memory, much of the country will go from near record warmth next week to potentially very stormy and colder weather towards the end of January and first week of February. The pattern may continue to oscillate back and forth, with higher confidence that March will be quite cold. This is because of low sea ice helping to cause the polar vortex aloft to strengthen and once we head towards spring, this system will be displaced to the South. This could improve snowfall for many eastern ski areas before or by spring.
For now, after melting snow and more mediocre ski conditions in the East, I look for the NAO index to go negative later in January and for the potential for an important east coast snowstorm possible sometime around or after January 27th.
Each pattern change the last 6 weeks has been brought on by some feature entirely different than the previous. In the case coming up for later January, the MJO, stratospheric warming (see blog on January 10th below), plus what we call a retrogressive wave pattern, will open the door for yet another, colder pattern change. However, the way this pattern has been all winter long, I would expect that warmer risks will occur again later, making any major rally in natural gas prices the next few weeks unlikely. Computer models cannot be trusted this year.
Here We Go Again! Volatile U.S. Weather Pattern Affects Natural Gas Trading
MAP FROM WSI CORPORATION OF JET STREAM; COMMENTS BY JIM ROEMER. January 13th
WHAT IS RETROGRESSION?? Colder risks at time, but not consistent will result in more natural gas volatility.
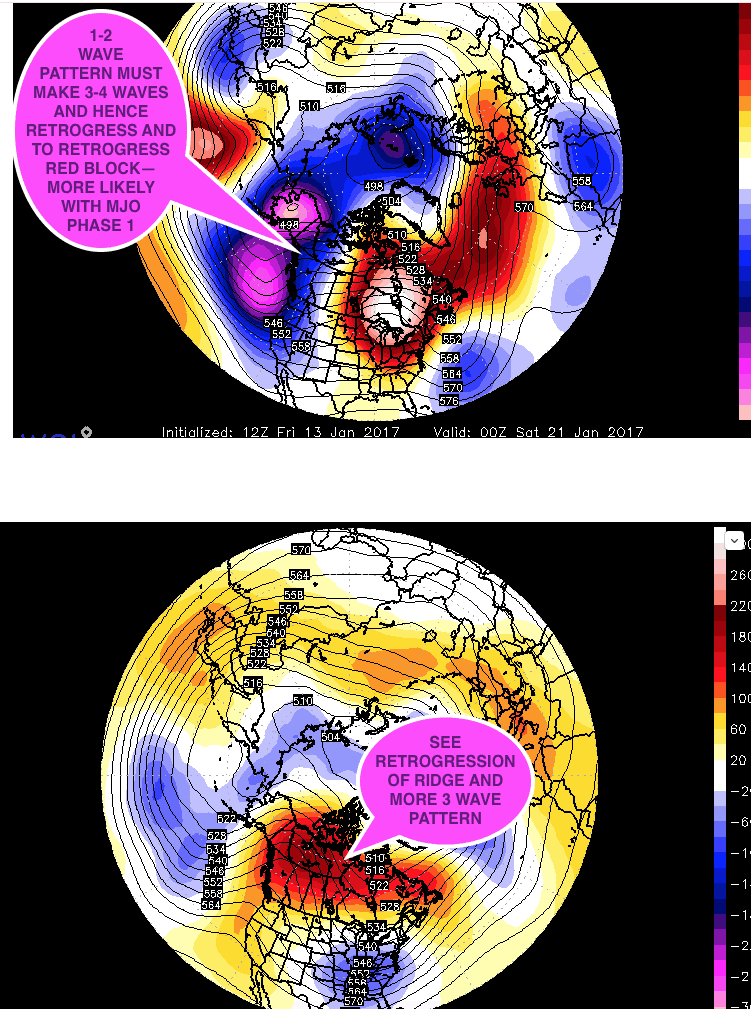
LATE JANUARY PATTERN FOLLOWING UPCOMING WARMTH
by Jim Roemer | Jan 10, 2017 | Commodities, Forecast, Skiing
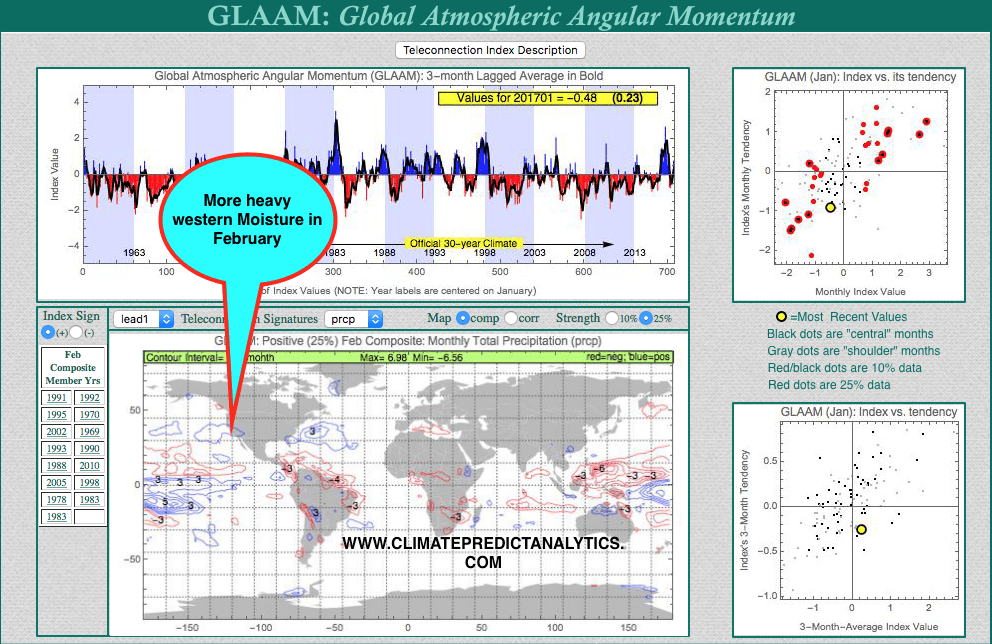
The global atmospheric angular momentum (GLAAM) index is simply the total rotation of the atmosphere compared to the Earth’s surface. Typically, El Nino years lead to positive GLAAM values and La Nina years lead to negative GLAAM values. When you have both in phase, El Nino and La Nina weather patterns are amplified. However, we currently have + GLAAM and a weak La Nina Modoki (west-based La Nina).
http://www.jamstec.go.jp/frcgc/research/d1/iod/e/elnmodoki/about_elnm.html
This is an odd occurrence, with the atmosphere “acting like” an El Nino, and sea surface temperatures indicating a La Nina. We believe this is one of the reasons contributing to the tough winter forecast this year, as well as the constant pattern shifts. However, more than a week ago, we began telling clients that this January could end up being a warm one nationally and natural gas withdrawals would decrease.
A +GLAAM also favors the record, damaging rains we’ve seen in California and Nevada over the past week. With +GLAAM in January, Climatech composites and correlations accurately predicted this wet weather pattern. Emergency managers are ‘all hands on deck’ in the valleys with flooding roadways and dangerous mudslides: https://www.youtube.com/watch?v=i26_tWxSCLA All the while, snow lovers are chomping at the bit to ski/snowboard near record mountain snows. Mammoth mountain received 82” over just the past 10 days!
Shown below are the composites (blue indicates above normal precipitation) and correlations (red indicates a positive relationship) from Climatech. Notice most years with a +GLAAM were El Nino years, unlike this year.
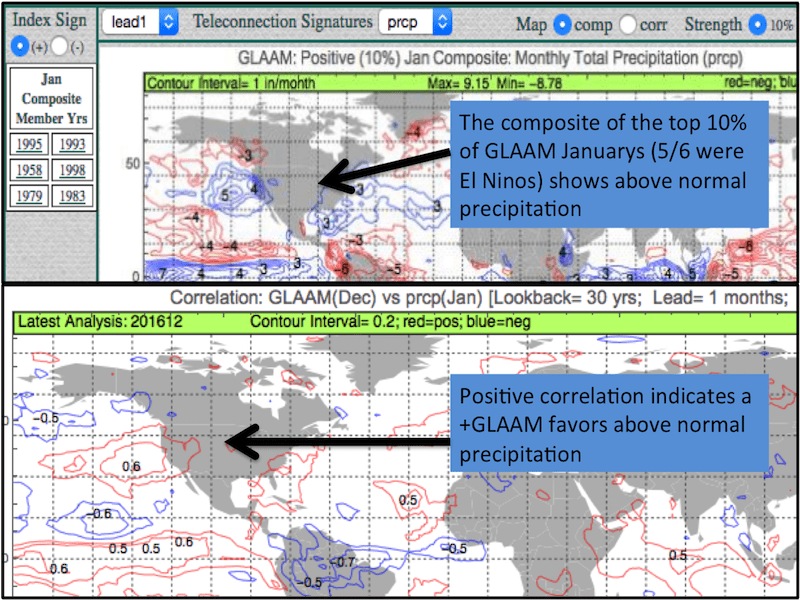
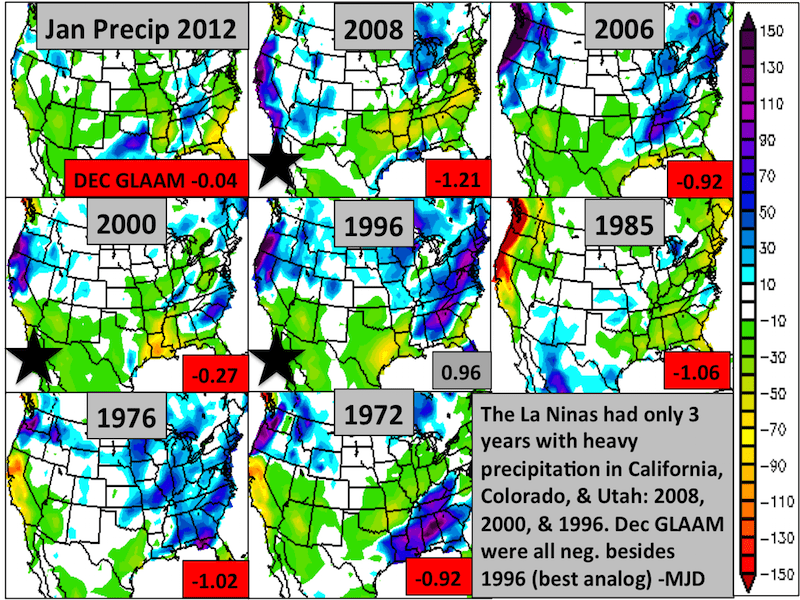
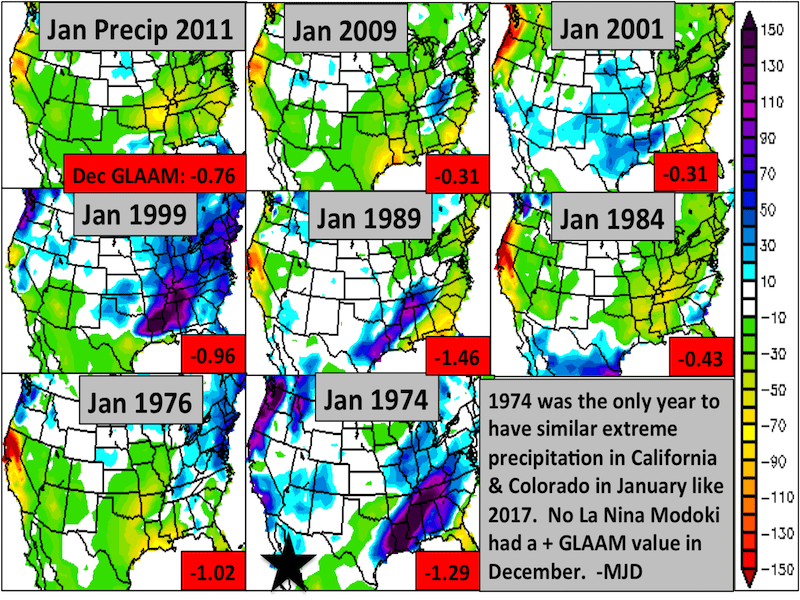
The question is, can we use these conditions to find good analog years? Meteorologists use analogs to forecast future weather. The theory is that similar initial conditions (e.g. strong pacific jet) or boundary conditions (e.g. sea ice extent, snow cover) will lead to similar conditions down the road. Only 4 La Nina years had similar rain/snow in January: 2008, 2000, 1996, & 1974, with 1974 being the only La Nina Modoki. 1996 was the only La Nina year which had a +GLAAM in December.
The images below show January precipitation patterns during La Nina and La Nina Modoki years. December GLAAM values are also shown.
The analogs below are based on +GLAAM, a weak La Nina and huge snows out west have some colder risks, later this winter in the North and East. However, a warmer Atlantic and a lack of snow cover may mean warmer risks at first.
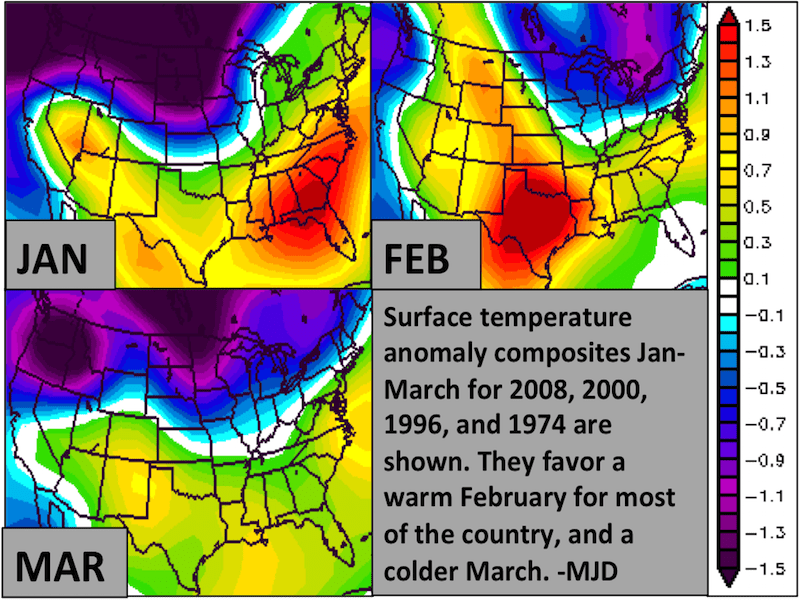
Although not perfect (January will end up warmer), these analogs somewhat agree with the forecast we have given our clients. This is a decent example of how analogs can be used in energy and agriculture weather forecasting, making Climatech an invaluable tool. In 3 of these 4 years, U.S. natural gas areas turned quite cold later in February and March, but odds remain high for warm weather until at least early February.


