by Jim Roemer | Jun 20, 2017 | Climate, Climatech, Commodities, Forecast, Weather
Australia Agriculture to the Rescue!
The month of May was a tough one for portfolio managers in Australia. The S&P 200/ASX fell >2.5% from April highs. The banking industry was mentioned as a potential reason for the sell off. Moody recently downgraded the major Australian banks’ credit ratings from Aa2 to Aa3 due to the mortgage risk they have (over 60% of loans are in residential property). Check out this Bloomberg article for more info:
http://www.smh.com.au/business/the-economy/moodys-move-shines-light-on-australias-home-loan-risks-20170619-gwufh4.html
Another reason for the sell off could have been the lower exports of iron ore over the past year. Cyclone Debbie disrupted production and it had a ripple affect on the economy over the past few months. The storm damaged rails when it hit the northeast shore in early April.
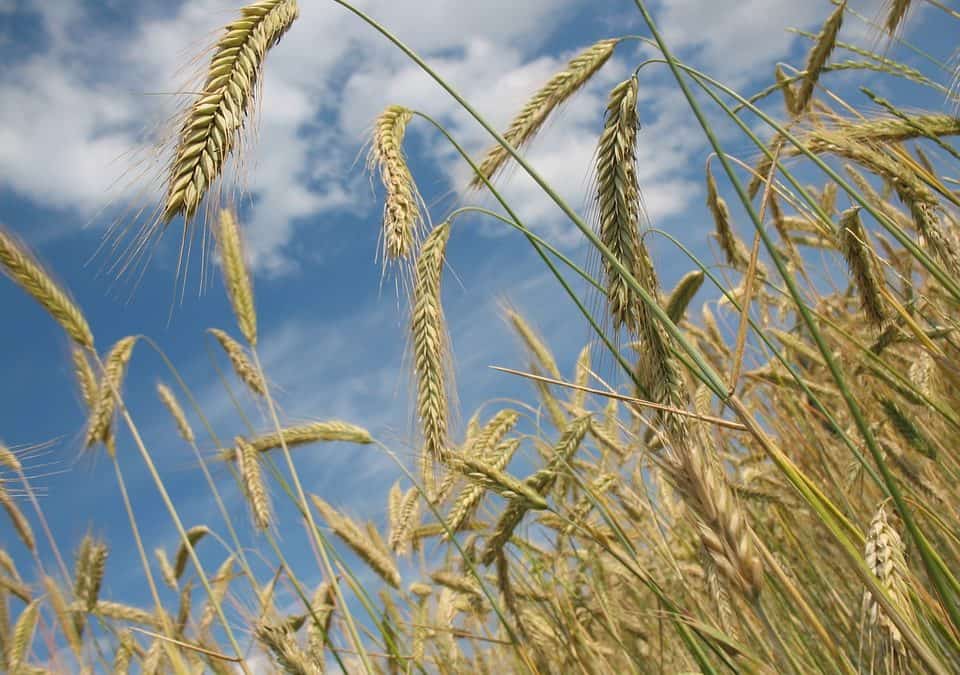
The bright side of the past year has been the agriculture sector. The Australian Bureau of Statistics stated that the sector grew 27% in 2016. This is expected to continue, with wheat, canola, sugar and especially cotton leading the way. Now, however, below normal rainfall may threaten crop production, and thus the Australian economy.
Drought Potential
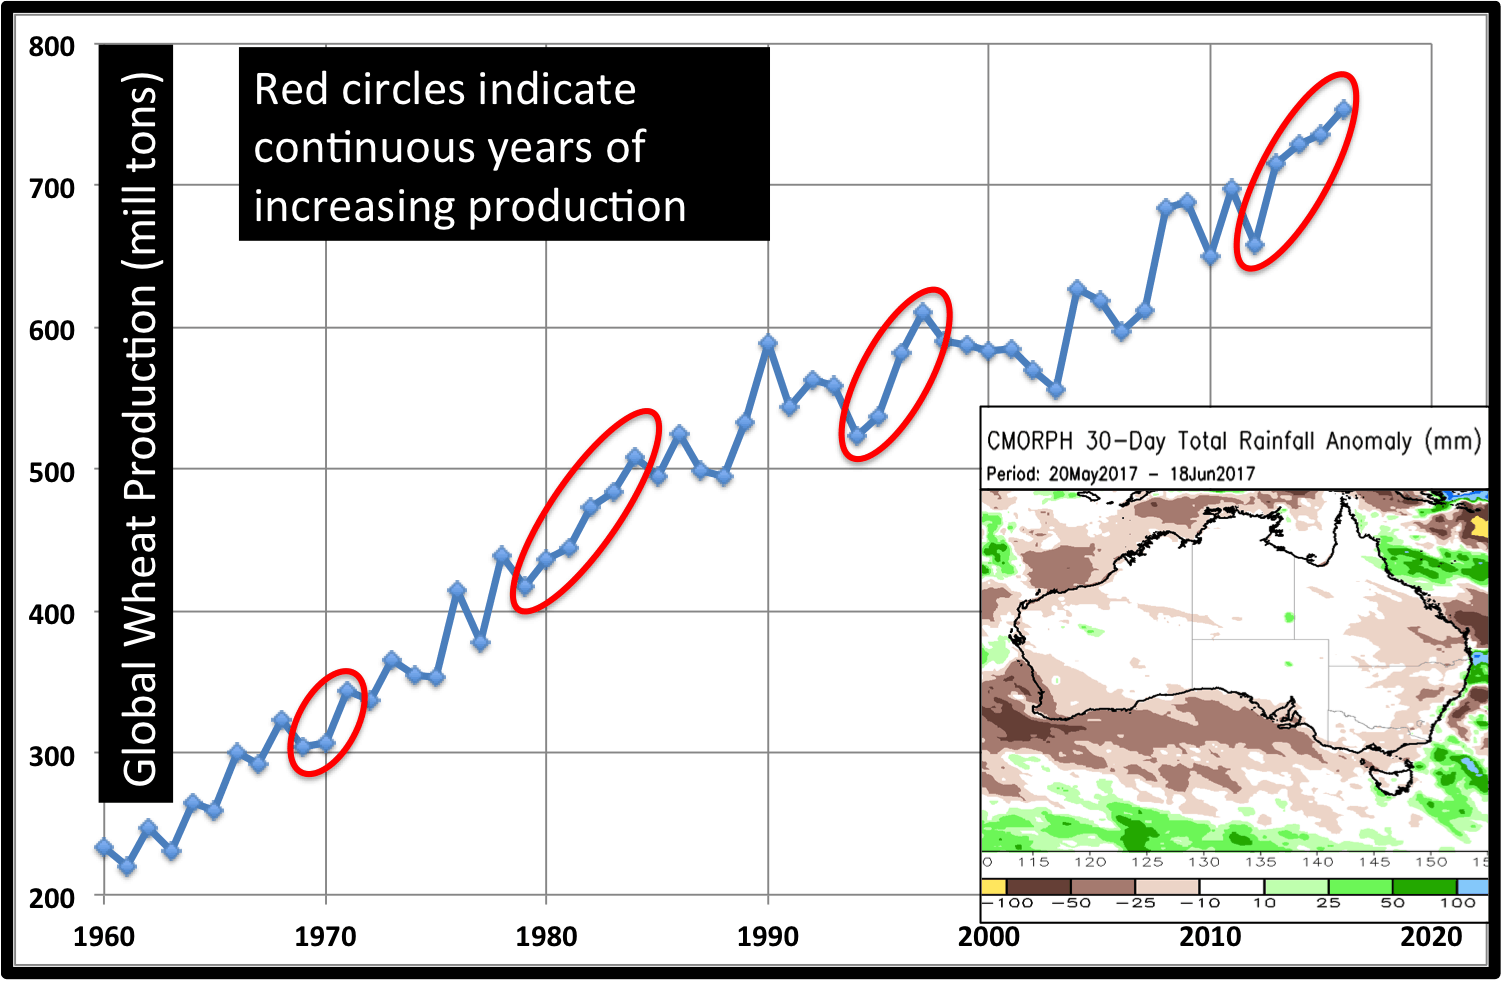
There is talk of drought moving forward for Australia, most notably in the cotton regions in the east. The past 30 days have been slightly dry, (10-50mm below normal). Wheat needs to be planted soon, and requires adequate moisture to do so. Cotton farmers need not worry for a few months. Global wheat production has risen 5 straight years. Australia will need more rainfall to help this trend continue.
Rainfall will become even more important later, from August through December. The major concern is the potential for El Niño conditions during this period. Warmer waters in the equatorial Pacific create greater descent over the Australian continent.
In addition to the El Niño impacts, the Indian Ocean can also affect Australian rainfall patterns. When the Indian Ocean Dipole is in a positive phase (current state), the western Indian sea surface temperature anomalies are warmer than those in the east. This set up usually leads to below normal rainfall over Australia. The questions moving forward are: Will a moderate El Niño form and will +IOD conditions persist?
by Jim Roemer | Jun 14, 2017 | Commodities, Forecast, Weather
Wheat has continued to explode over the past week. Our blog last week talked about the Spring wheat drought occurring in North Dakota. The drought has worsened and crop conditions continue to fall. Prices have risen another 50 cents per bushel since then.
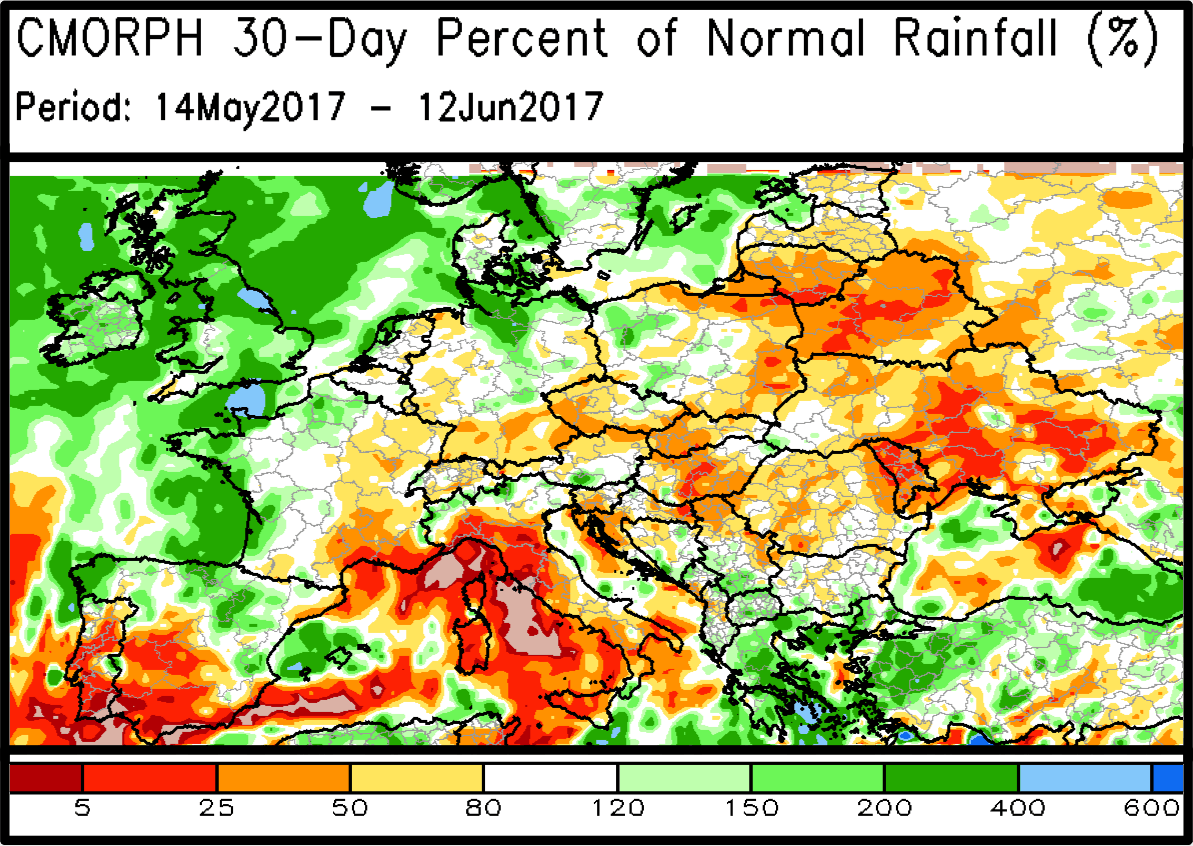
Europe drought
A lack of rainfall in Europe is also getting some attention, bringing prices of the other wheat varieties besides spring wheat into the rally. The below normal rainfall in May has persisted into June. Europe’s major wheat producers are France, Ukraine and Germany. All three have areas of dryness developing.
What TCs can help forecast wheat drought?
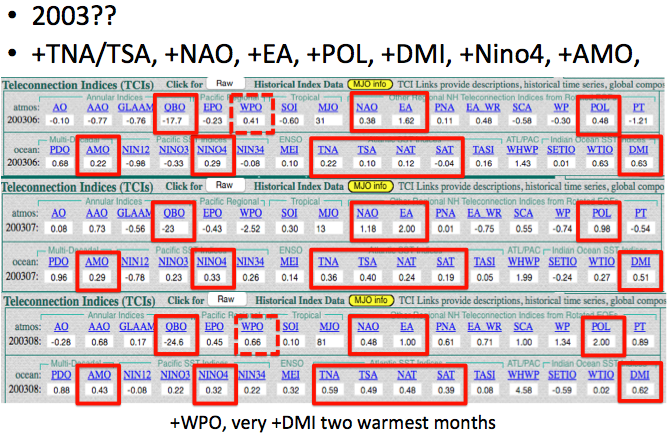
We looked at one of the worst droughts Europe has faced. In 2003, it was the devastating, deadly heatwave that dominated the headlines. But the wheat production across Europe dropped due to the hot, dry conditions. The teleconnection (TC) values during this period can give us a good indication what favors above normal temperatures and below normal rainfall. Using Climatech, we examined the values of 2003 for June, July and August:
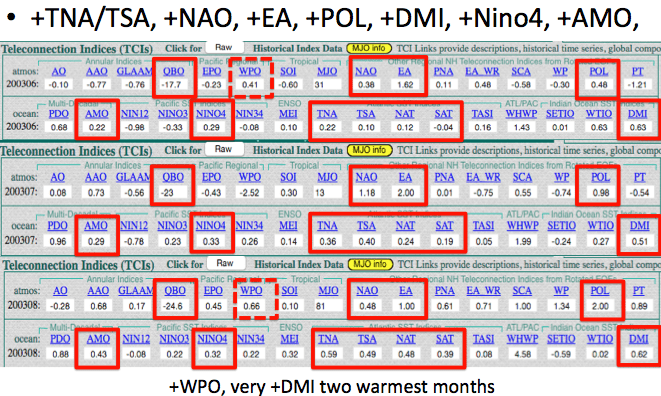
So what do we see in all 3 months? A +TNA, +TSA, +AMO and others indicate a warm Atlantic was present. This can lead to an overall warmer Northern Hemisphere, as well as favor a +NAO (above normal geopotential heights over Europe). Another observation from 2003 is a very warm DMI (warm Indian ocean temperatures off the east coast of Africa). A +DMI can increase the strength of the West African Monsoon. Greater ascent over North Africa can lead to increased descent over Europe–>higher temperatures and below normal rainfall. This ‘analog’ technique is just another way to use Climatech in long-term forecasting.
Corn, soybean update
Corn and soybean prices have taken a “breather” recently. Planting delays due to flooding are no longer an issue. Now, the focus has flipped, with rainfall being viewed as beneficial. There are currently some dry spots, especially in the northern grain belt. Despite poor initial crop conditions, more moisture for the crops would prevent major crop issues. For now, weather forecasts are positive, with the west coast ridge retrogressing in the next 5- 8 days. The question is whether or not ample rainfall will continue.
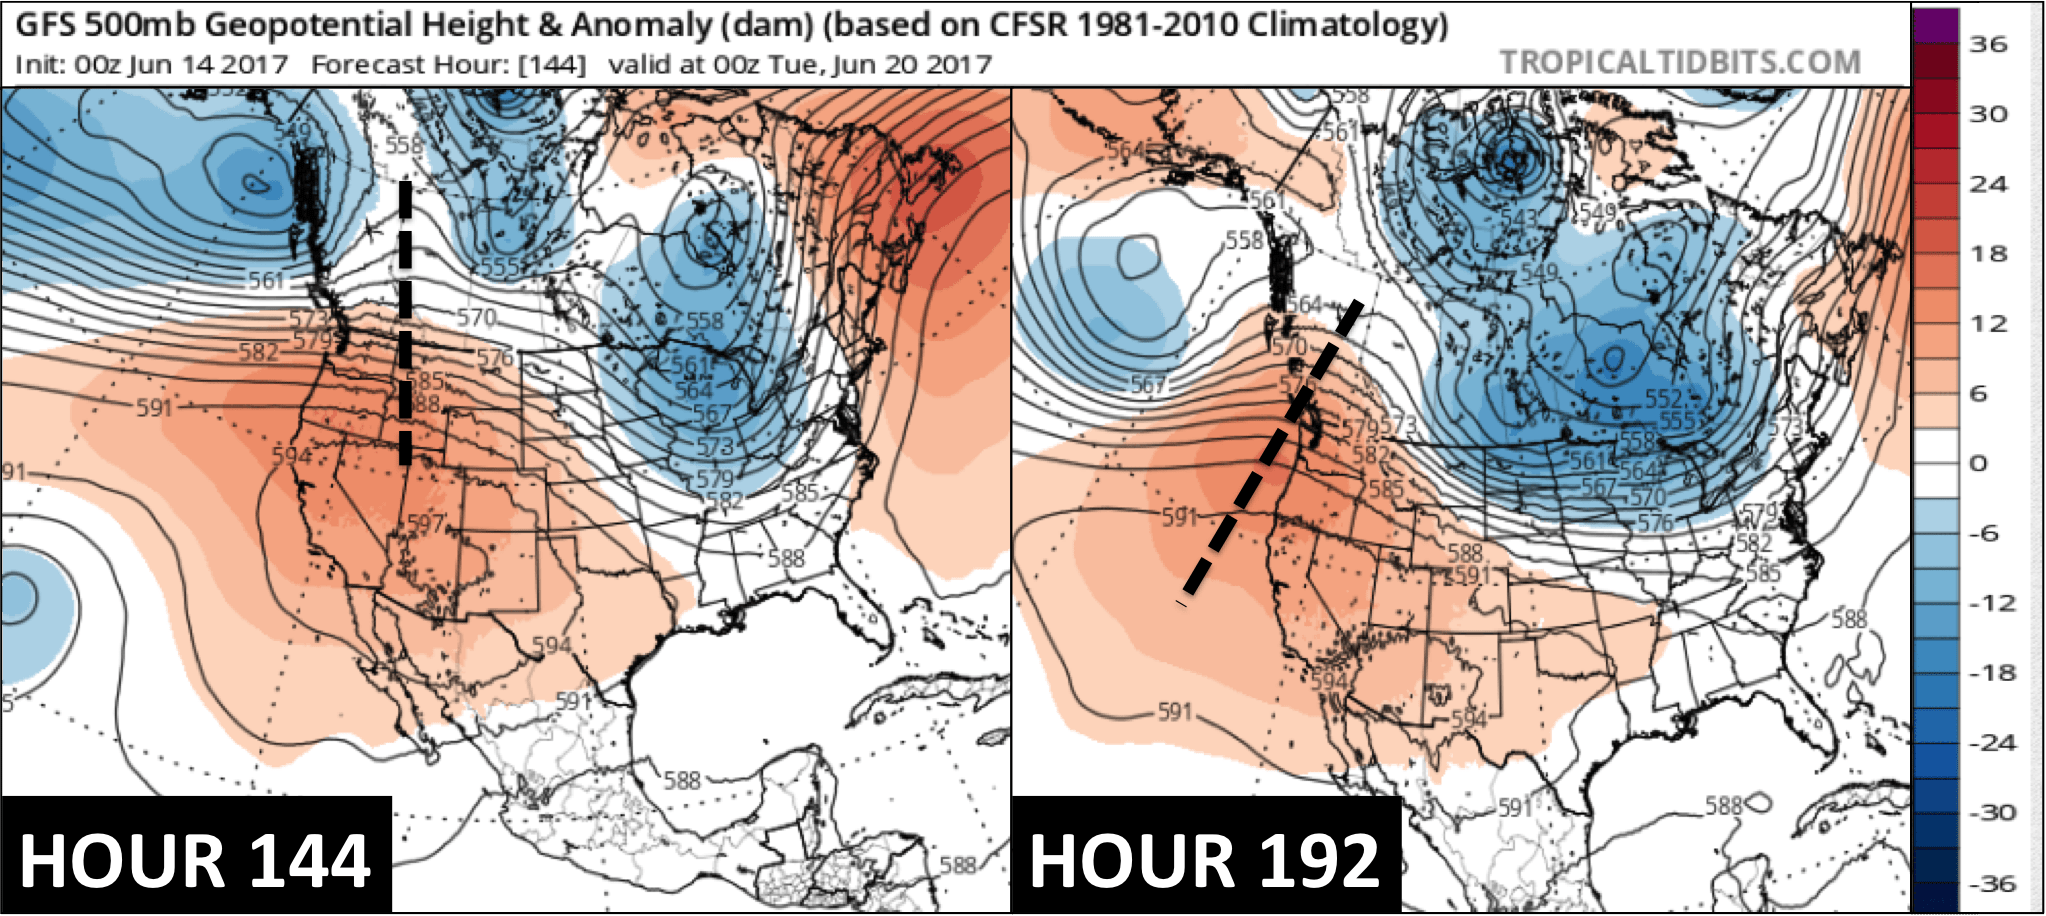
IMAGE SOURCE: TROPICALTIDBITS.COM
“There will be huge trading opportunities this summer in grains on weather and we understand the psychology of the market, but only for paying customers”–Jim Roemer
by Jim Roemer | Jun 5, 2017 | Climate, Commodities, Forecast
Spring wheat is making “waves” due to the recent price rally. This variety mainly grows in North Dakota and Montana. The 2016 county production chart highlights these areas. Farmers plant this crop in the late spring and harvest mid-August to mid September. Prices have risen into the planting season, as high as $5.90/bushel on the chart.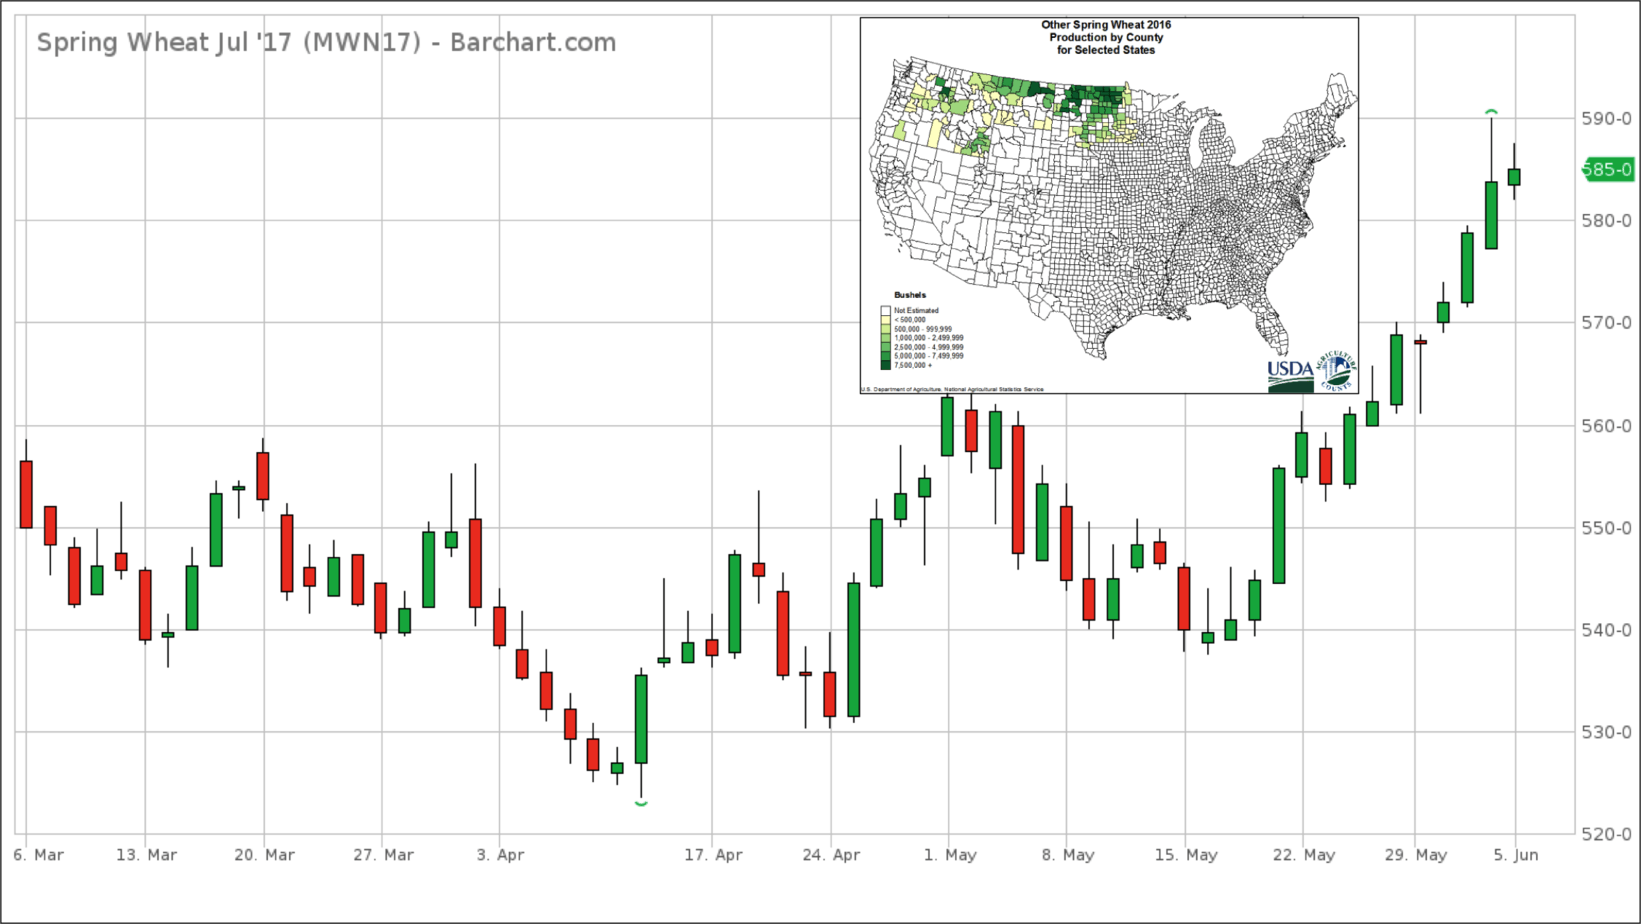
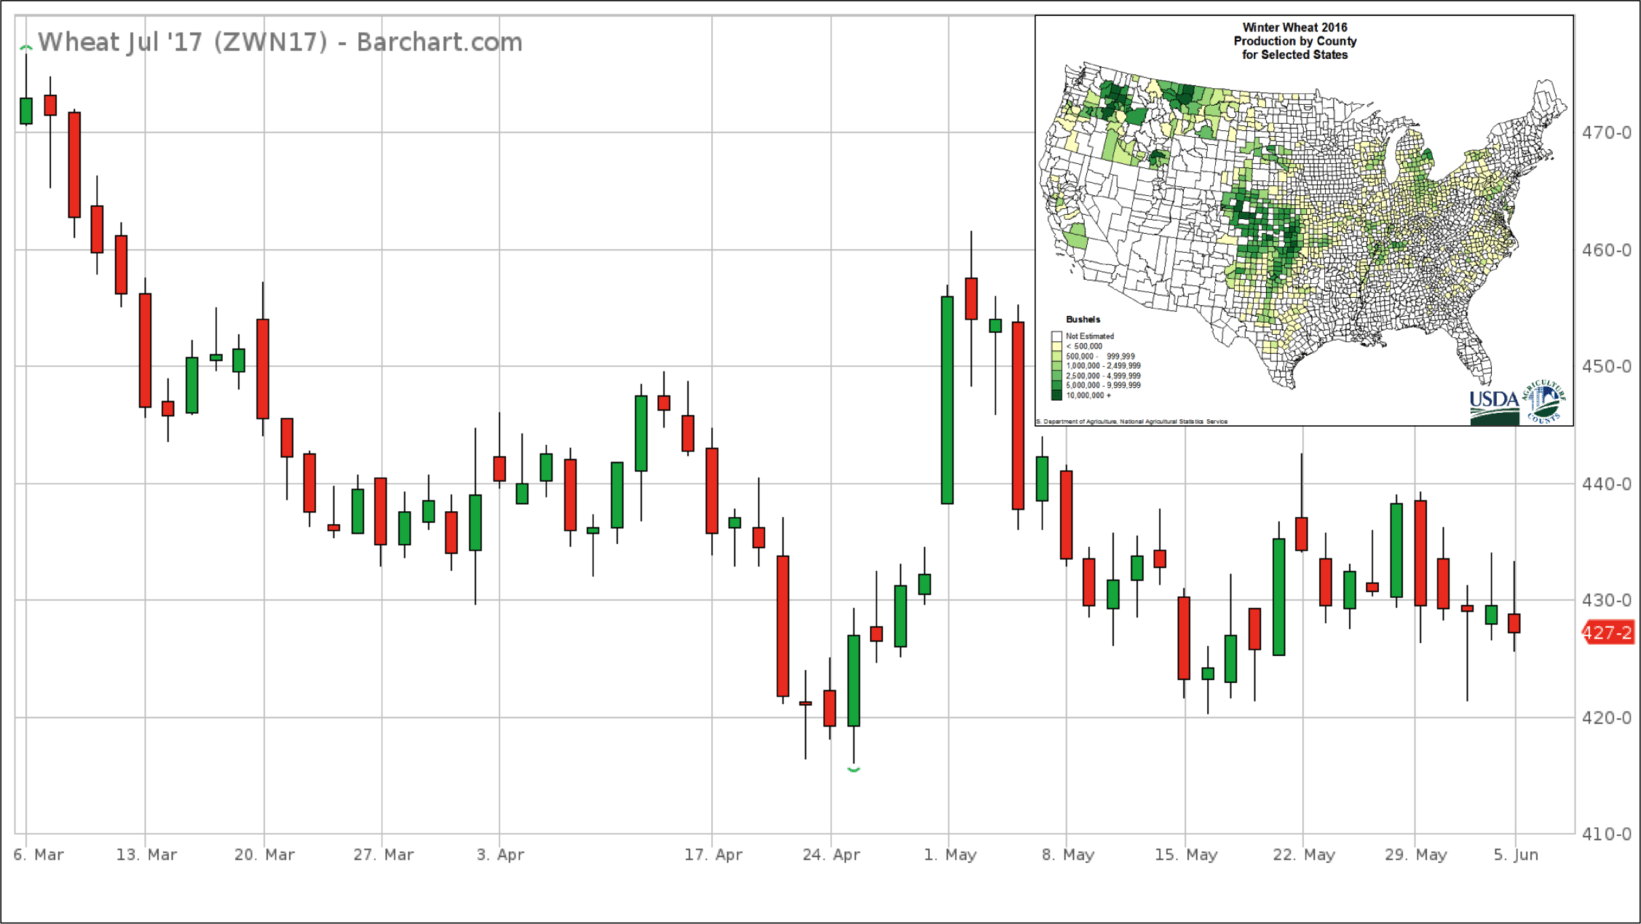
Winter wheat is grown, you guessed it, during the winter! (planted in autumn and harvested late spring). It remains in dormancy through the winter, preventing major freeze damage. As you can see, it is grown throughout the U.S., with a maximum in production near Kansas and Oklahoma. July futures tried to rally in late May as freezing temperatures and unusual snow hit parts of Kansas. Prices are now hovering near $4.30/bushel.
Two reasons for spring wheat price difference
So why are prices so much higher for spring wheat? The main reason is the “protein premium” that spring wheat has. The high levels of gluten make the wheat more valuable for food production. Blends of spring wheat with other, lower quality wheat create better grain products.
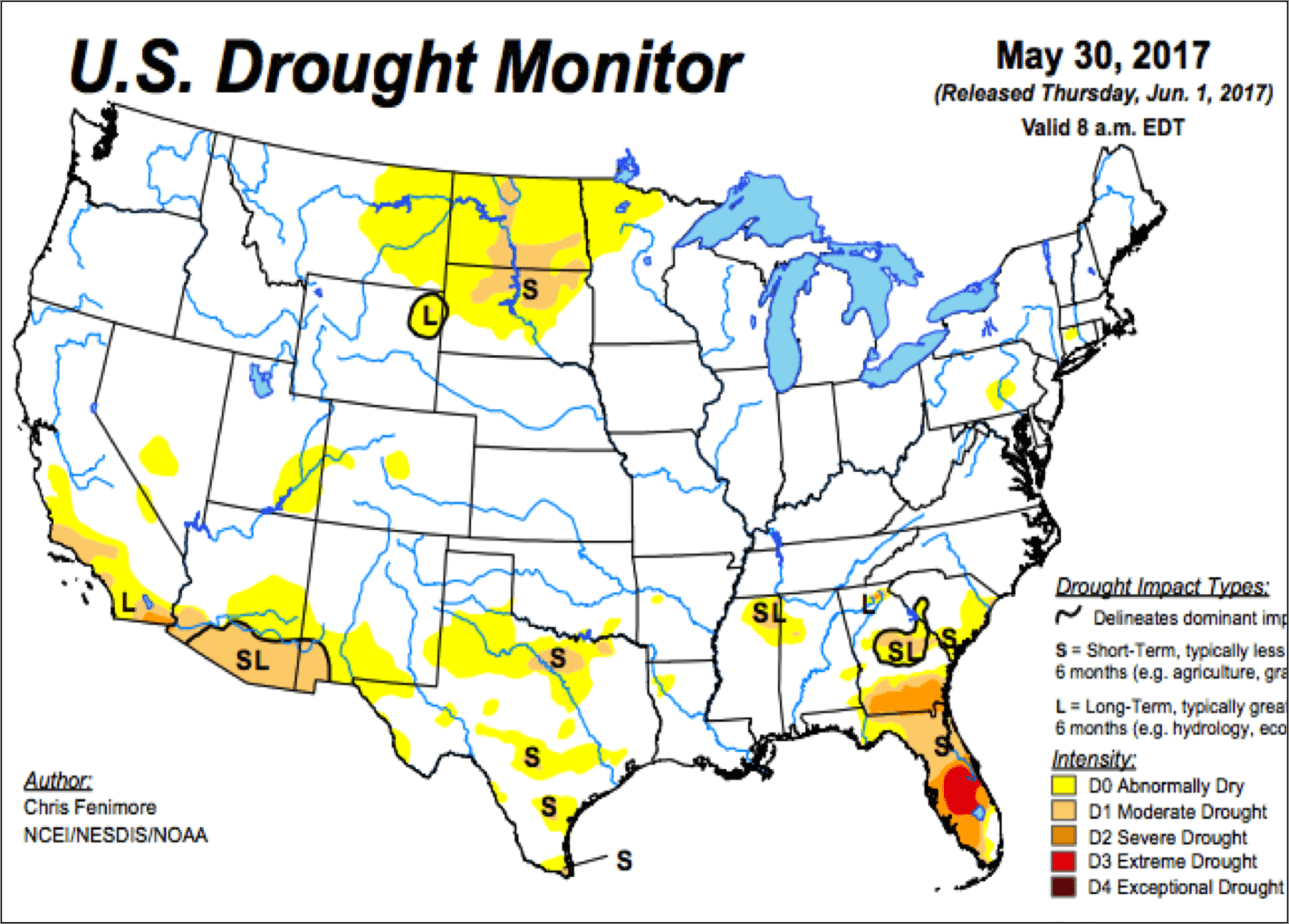
The other reason is the condition of the crops. Winter wheat broke out of a drought in March, leading to falling prices since then. Now that the heavy rain has slowed, the harvest will occur without delay. But just to the north, a drought is developing. This is not beneficial to to the recently planted crop. Below normal rainfall is expected to continue for at least the next 10 days. The current drought monitor indicates that all of North Dakota is abnormally dry, with some parts in a slight drought.
To subscribe to our newsletter, click here.

by Jim Roemer | Jun 1, 2017 | Climate, Climatelligence, Commodities, Forecast
We sent out or newsletter to our subscribers May 23rd, when July natural gas prices were still at $3.40 MMBtu. Our forecast called for below normal temperatures mainly in the late month of June, limiting cooling demand. Our bearish “score” for natural gas reflected this forecast. Prices have fallen $0.30 MMBtu down to near $3.1 MMBtu since then, with our forecast verifying. The composite forecast for June given in the newsletter:
Climatech backs up our research
Our research combined current SSTs, statistical analysis of teleconnections and other boundary conditions to forecast the most likely scenario. In house, most Climatech composites matched this research, giving us more confidence in our forecast. Our Climatech subscribers saw these below normal temperatures for the eastern two-thirds, too. Unless something drastic occurs, it seems like it will verify nicely. The first part of June will likely be warm with a cool finish, but ample stocks of natural gas will probably prevent any major rally.
What’s the forecast for summer? There are signs of hotter July weather that may put a floor in prices, but for June we have a bearish stance.
Our newsletter and Climatech subscribers also know our forecast for the July and August. They will be watching intently to see if we go three for three and if natural gas reacts.
by Jim Roemer | May 31, 2017 | Commodities, Forecast, Strategy, Weather
The United States Department of Agriculture released their first crop condition report for corn. It showed that 57% of the crop is rated good and 8% is rated excellent. The above normal rainfall that has fallen has prevented better conditions from materializing. A total of 65% good to excellent is on the lower end compared to the past few decades (bottom tercile).
Crop Conditions and Yields
So how important is this initial crop condition rating? We took a look at how U.S. yields fared when initial crop conditions were below normal. The chart below shows the percent of crop good to excellent in the first report (most of the years, it was released in the last week of May). The black numbers on top of each year indicate the yield departure (%) from trend.
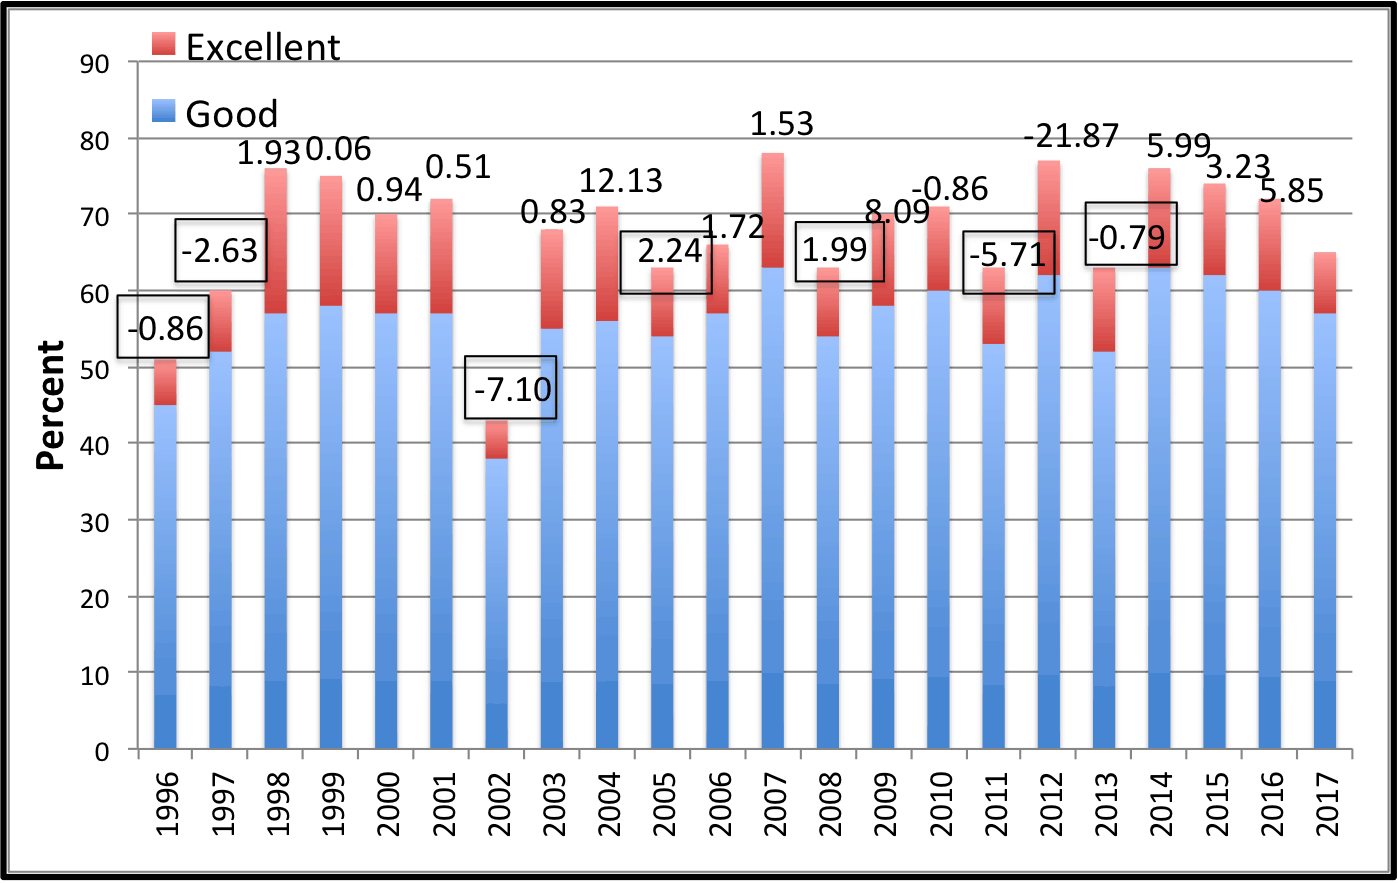
Historically, 7 out of 21 (33%) years had yields below trend (negative numerical values). However, lets isolate that percentage down to include the crop conditions. There were 7 years that had corn conditions at 65% G/E or below (not identical to the 7 below normal yield years). Of those 7 years, 5 of them had yield departures below trend, thus increasing the current chance of below normal years to 71%. Although it may be a decent indicator, it is not foolproof. Despite having great conditions to start the year, the worst yield departure year in this range is 2012.
On top of the poor conditions, the report also mentioned that only 91% of corn had been planted. This compares to the 93% average for the 2011-2016 period. Corn needs to be planted soon or farmers will not be able to purchase crop insurance.
by Jim Roemer | May 25, 2017 | Climate, Climatech, Climatelligence, Commodities, Forecast, Weather
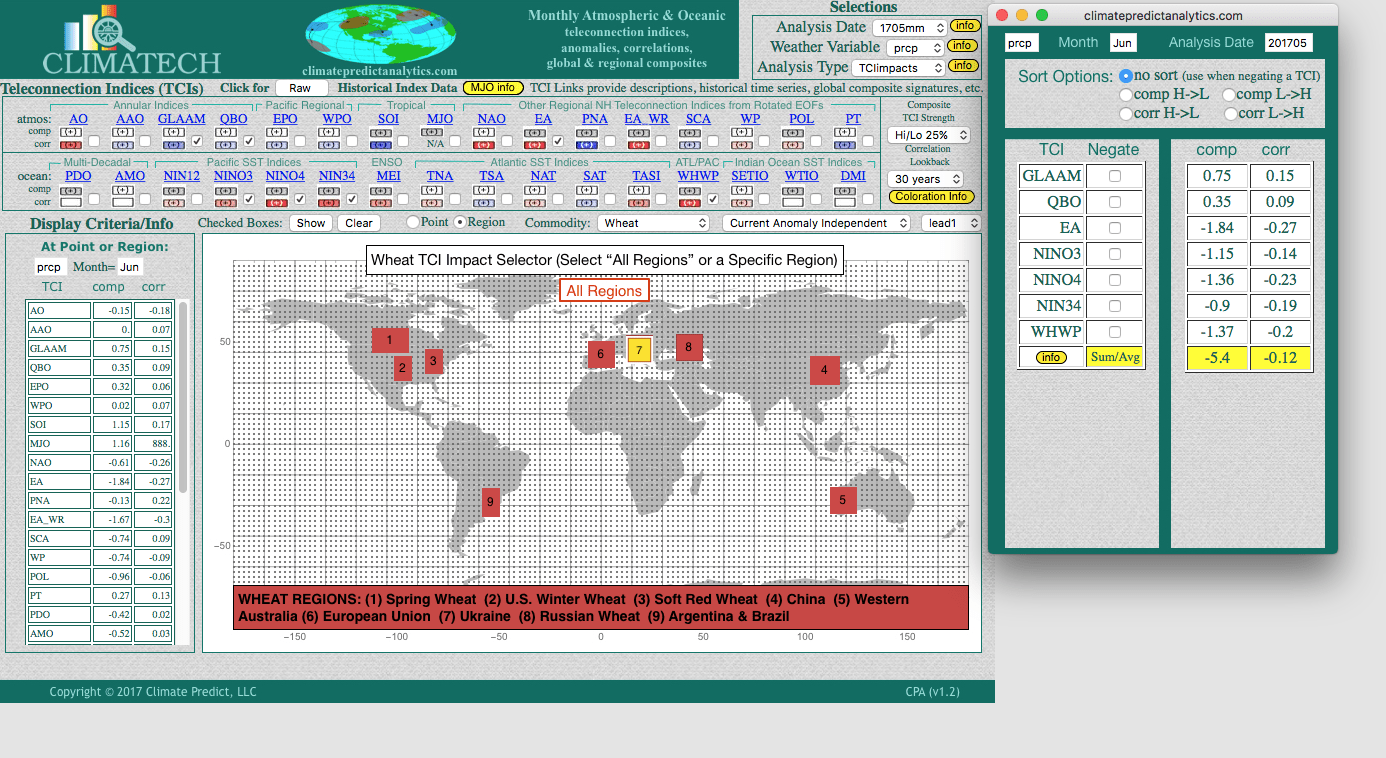
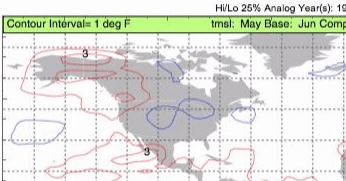
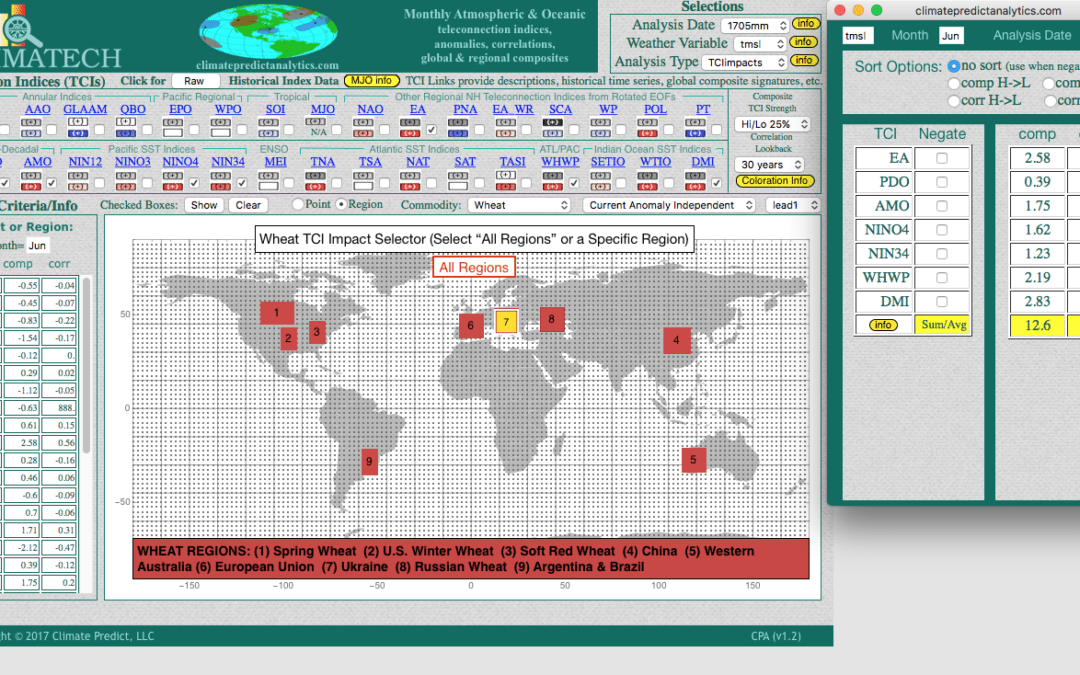
CLIMATECH above shows (7) areas in Europe that could have a hot June and potential crop stress next month. In combining the most important global teleconnections, notice how in some areas, the prediction is for temperatures in Europe to be as much as 12.6 degrees above normal
Wheat prices have been in the doldrums for years. However, a lower U.S. crop brought on by reduced acreage and the potential for continued severe weather and flooding that may lower wheat quality, could keep prices from falling very far.
At the same time, we are seeing the vegetative health index turn a bit dry in parts of Europe and Russia. While not a disaster yet, our exclusive CLIMATECH program is predicting areas of warmth and dryness in some European wheat areas next month based on various teleconnections around the globe.
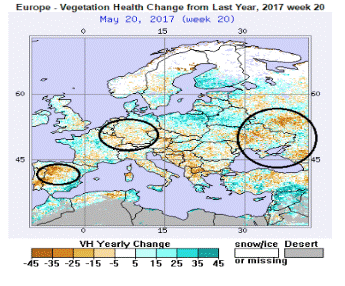
Areas of dryness (orange and red), need to be watched (above). If we have other weather issues around the world, other than wet U.S. weather hurting some crops, then wheat prices would take note
The best long-range weather forecasting tool in the industry, you can get a FREE demo but going to the web site Climatech, Shown below is our June forecast for below normal rainfall in parts of Europe due, not just to pre-El Nino conditions ,but a host of other global teleconnections.