by Jim Roemer | Aug 25, 2017 | Commodities, Forecast
Hurricane Harvey and Gasoline Prices
More than a week ago, we at BEST WEATHER INC. starting telling clients that the hurricane season would be stronger than others feel. We also mentioned Harvey would likely be more of a threat than many other forecasting firms felt. Why? One reason is something we call the “loop current” in the Gulf and another reason is the warmer-than-normal Atlantic temperatures this year. In addition, the MJO index is in a favorable position.
So then, why have gasoline prices exploded while crude oil prices have lagged as Harvey bears down on Texas? A good explanation can be found here: http://www.marketwatch.com/story/oil-prices-ease-with-caution-still-in-place-even-as-us-stockpiles-decline-2017-08-24. However, usually after a big rally in gasoline prices on hurricane “psychology”, prices fall back. There is still ample supplies of both gasoline and crude oil.
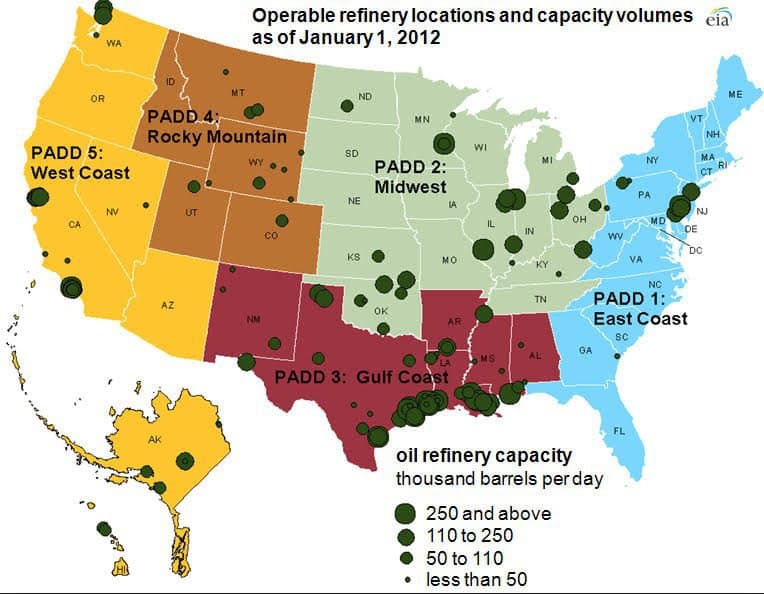
OPEC is not cutting back on oil production and the world is taking more steps towards renewable energy. Hurricane Harvey is having more of a threat on actually hurting crude demand. Harvey is shutting down gasoline refinery platforms in the Gulf. However, if Harvey makes its way closer to land, it may have some impact on crude oil and natural gas supplies by August 29th. But the primary fundamental issue remains the tremendous amount of U.S. shale production.
Readers who are wondering about the current lackluster performance of natural gas should remember that only 5% of natural gas production is found now in the Gulf. Compare that to more than 40% during the years prior to Hurricane Katrina. Back then, storm activity had much more of an impact on the market, both actually and psychologically.
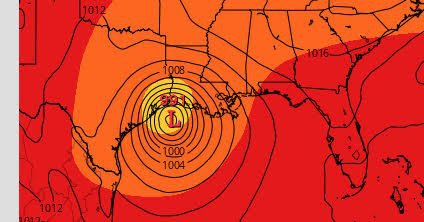
HURRICANE HARVEY WILL WEAKEN OVER LAND BUT HAS A CHANCE TO REFORM AND MOVE NEAR HOUSTON ON TUESDAY
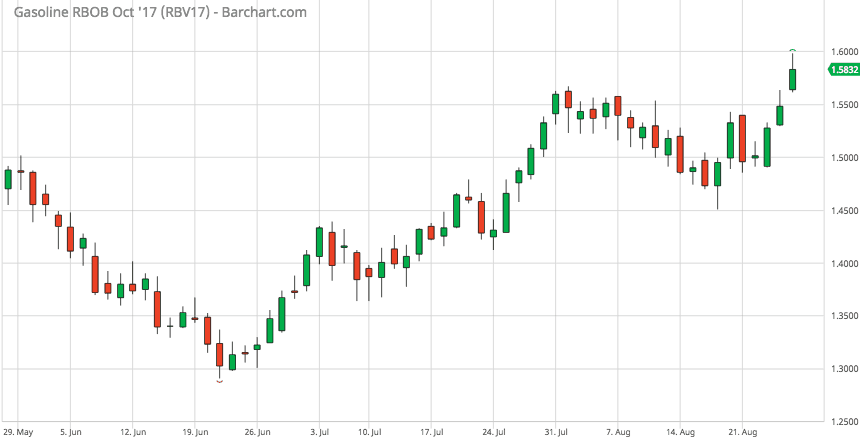
PRICE SPIKE OF GASOLINE DUE TO REFINERY SHUT DOWNS
More more information email us at: subscriptionsbestweather@gmail.com
-Jim Roemer
by Jim Roemer | Aug 17, 2017 | Forecast, Markets
The National Hurricane Center is currently eyeing three tropical waves in the eastern Atlantic. These systems will bear watching over the next week to ten days as they all have a 60% chance of forming. This far out, it is tough to give any concrete forecast until the picture becomes more clear. Recent model runs show all types of scenarios including storms going out to sea, making landfall, and storms completely dissipating.

Hurricane Season Forecast
We’ve done some research into the number of storms expected in August, September and October. Matching most other forecasts, we expect above normal activity through the end of this season. There are two key ocean features that support increased cyclogenesis compared to recent years. Warmer than normal sea surface temperatures in the Atlantic create more instability and allow for more water vapor to be drawn into a developing cluster of tropical thunderstorms. See the favorable anomalies in orange in the image below (the main development region–just west of Africa–as well as the Caribbean and the Gulf of Mexico).
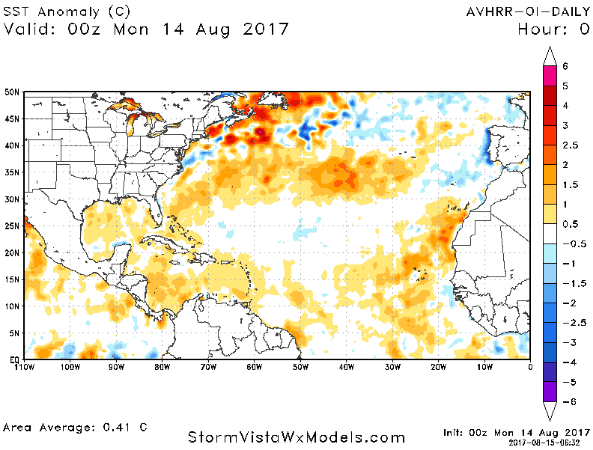
The other recent change that favors storm formation is the weakening of El Nino. When El Nino conditions are present, it tends to increase vertical wind shear in the Atlantic. Hurricanes thrive when they are stacked like a multi-layer cake, rather than the Tower of Pisa. The shear can shred and separate the storm, leading to its demise. Since sea surface temperatures in the equatorial Pacific are cooling, this should limit wind shear and allow storms to develop.
Market Consequences
Going all the way back to 2005, we saw natural gas prices increase significantly every time a hurricane (Wilma, Katrina, etc.) entered the Gulf of Mexico. However, shale production was not anywhere close to the levels we have now. Therefore, it is unlikely that a “major” impact to supply/demand would occur if a strong hurricane were to enter the Gulf of Mexico and limit production. Hurricanes also impact other markets. The home improvement stocks have bumped up slightly during previous landfalling hurricanes. Traders expect an increase in earnings on plywood and other storm/recovery supplies. Some other stocks to watch would be in the insurance, electric (GRNC) and shipping industries.
For all our research on the 2017 hurricane season, email us at subscriptionsbestweather@gmail.com for a special report.

by Jim Roemer | Jul 13, 2017 | Forecast
JIM ROEMER ON DEWPOINTS -EPO and GRAINS
We alerted “private” paying customers only, early Wednesday morning, about a potential change in the weather pattern for the Midwest drought as we head deeper into July. While our newsletter customers were alerted two months ago about about being long the GRAIN ETN—JJG, any slight changes in rainfall potential or a migration in the Midwest dome will create incredible grain market volatility. Dewpoint temperatures, which can help indicate the amount of moisture in the atmosphere, are unusually high over the Midwest currently. What this means is, that the potential is high for rain in some key dry Midwest regions, any time a front comes through. Normally, during the great bull market grain droughts of 1983, 1988 and 2012, dewpoints are in the 50’s in the Midwest, not the 60’s and 70’s like they are now.
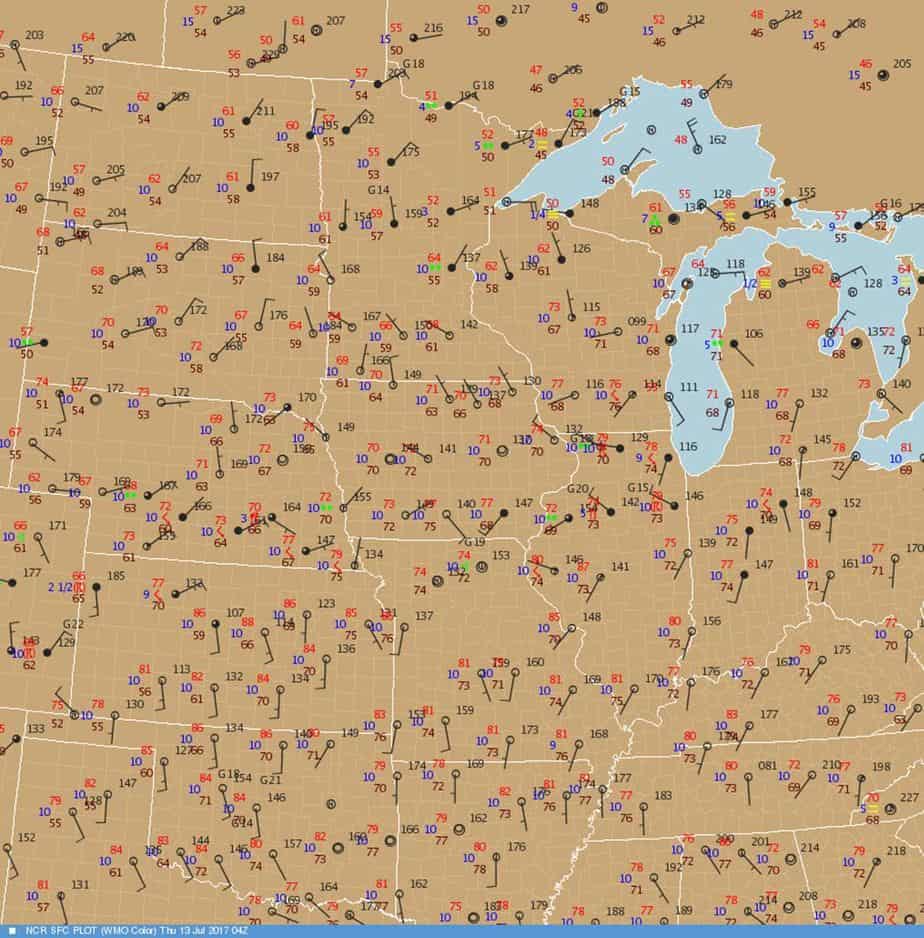
In meteorology, dewpoints are extremely important for rainfall potential. The higher the dewpoints the more humid it is and the more uncomfortable we feel. The dark black number to the left of the circle (see map above) is the dewpoint. Notice dewpoints only in the 50’s over the Dakotas where the drought has hurt wheat crops, but are over 70 in most of the Midwest grain belt. With a negative EPO (see next paragraph), more fronts could come down into the grain belt in a couple weeks. This, combined with >70 dewpoints, should increase rainfall amounts.
What is the EPO?
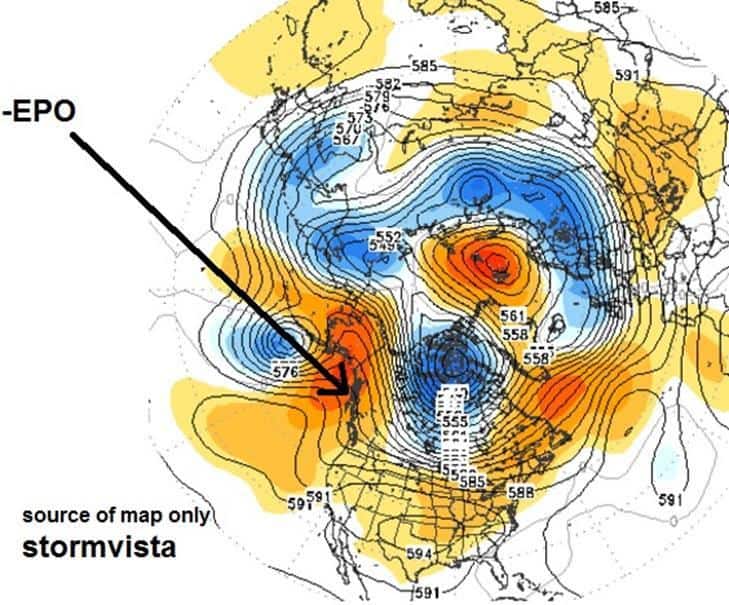
But what about the longer term pattern? During almost all major Midwest droughts, something we call the Eastern Pacific Oscillation Index (EPO) is almost always positive. This has to do with the weather over Alaska and western Canada. When the EPO index is negative (as models are suggesting) a western ridge near Alaska can open the door for Midwest cool fronts and a NW flow, killing the ridge. Given the high dewpoints, this could set the stage for much more impressive rains as we head deeper into July. IF THIS IS THE CASE, then corn and soybean prices have little chance (for now) for any major additional rally. However, our longer term research suggests “market volatility: and the heat and ridge could still affect parts of the Midwest again, later.
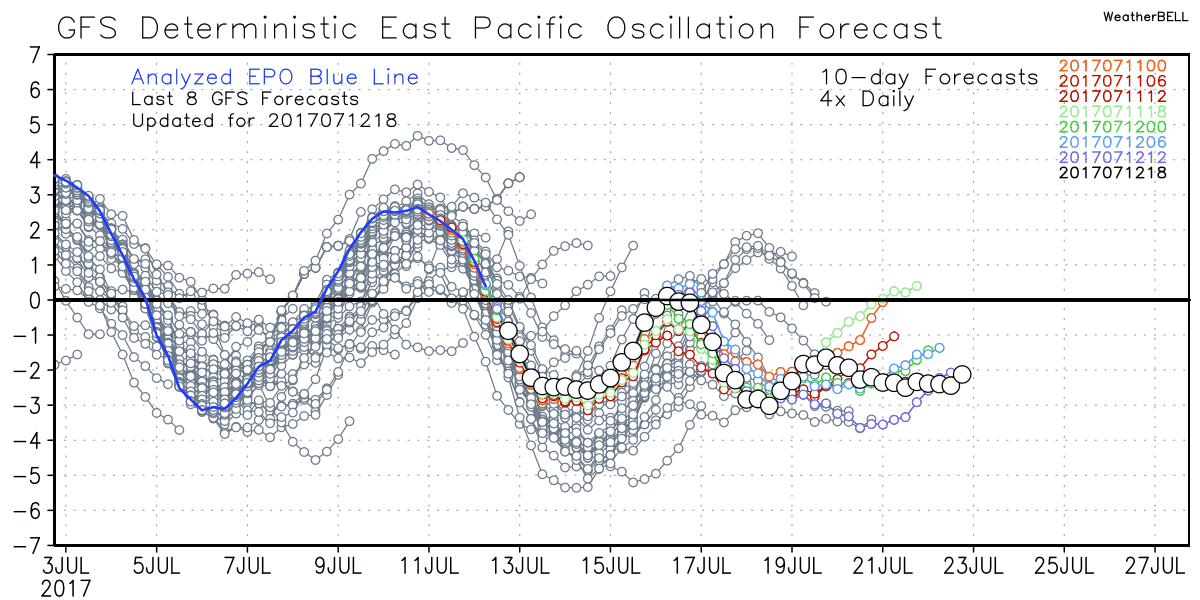
SOURCE OF MAP ONLY–WXBELL
EPO INDEX NEGATIVE COULD CHANGE THE MIDWEST WEATHER PATTERN AND EASE SOME DROUGHT CONDITIONS
Will the EPO go positive again? That would suggest that this break in corn and soybeans is only temporary and hot, dry weather could last well into late summer. This information is reserved only for paying clients to our daily service at subscriptionsbestweather@gmail.com If the EPO does go positive, a major rally in corn and soybeans will occur, if NOT, a collapse in prices. It is that simple.

by Jim Roemer | Jul 3, 2017 | Climatelligence, Commodities, Forecast, Strategy, Weather
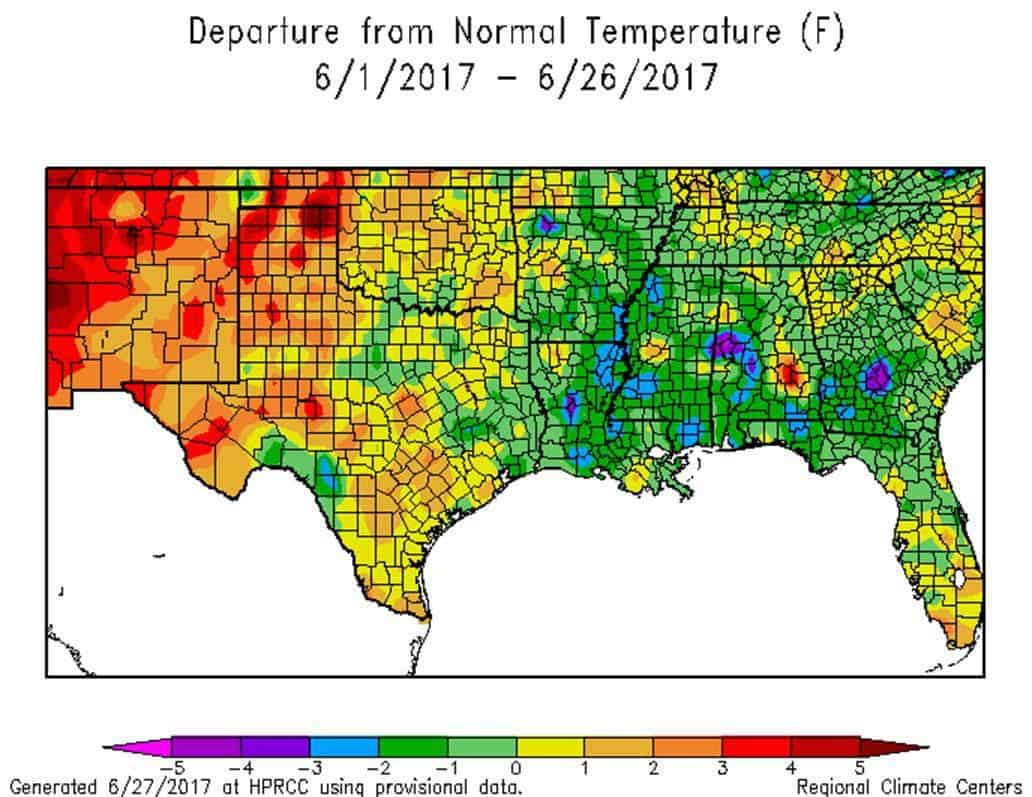
Grain prices have taken off, fueled initially by the first bull market in wheat in years. A severe drought in spring wheat areas in North Dakota was the first sign of trouble. Problems in Canada, Australia, and Europe followed. Now, soybean traders are worried about dry conditions developing in the Midwest. Just over 10% of soybeans are grown in the Dakotas. The drought is spreading into Iowa, with hot dry conditions expected over the next few weeks. Moving forward, less moisture on the ground will increase daytime surface heating, allowing for warmer maximum temperatures.
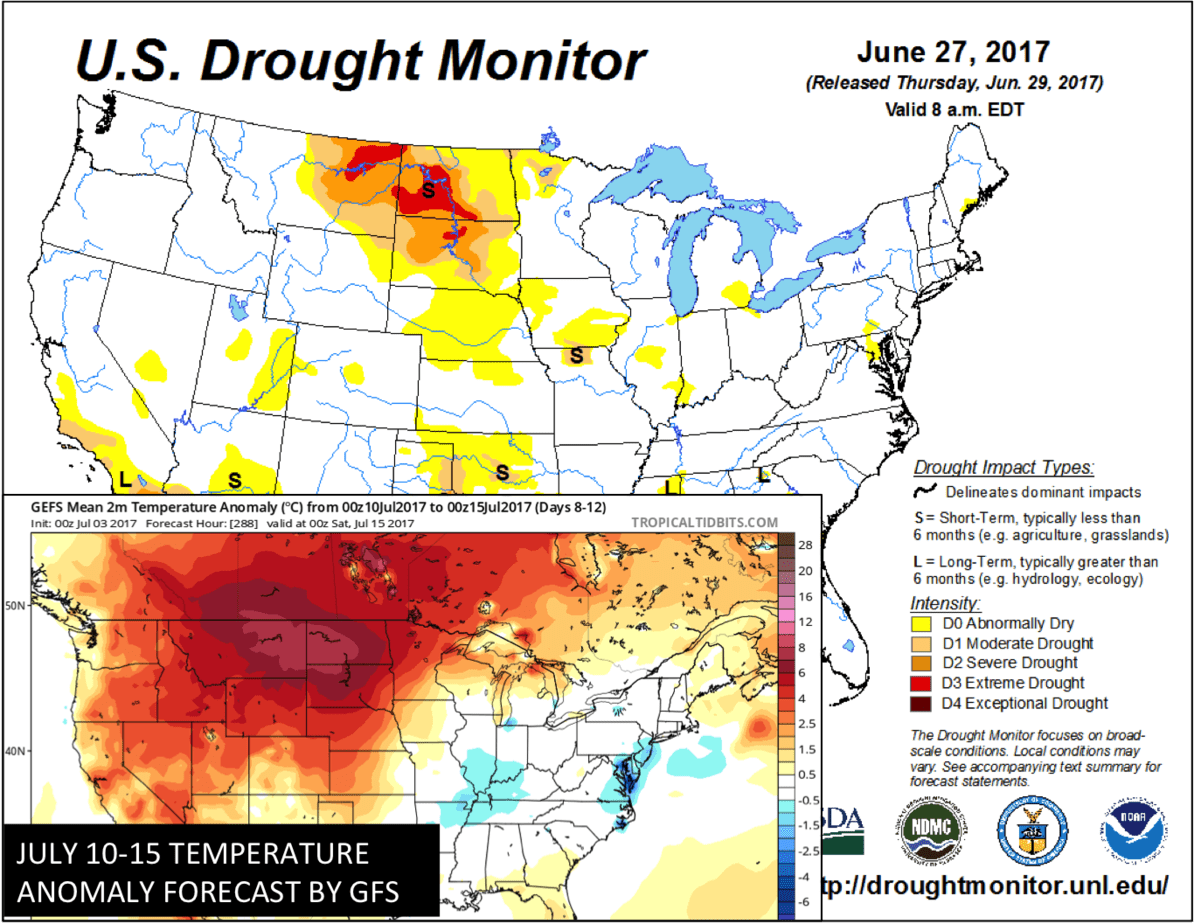 Image Credit: USDA & TropicalTidbits.com
Natural Gas prices have lagged behind the grains, despite some hot weather in the southwest and midwest. The pattern just does not want to push the hottest temperatures in the the Ohio valley and the East Coast. New York, Illinois, and Pennsylvania consume large amounts of natural gas for cooling demand. Therefore, it will take a decent heat wave for natural gas to compete with the grain market.
On your mark, get set, Grain!
The USDA acreage report acted as a ‘starting gun’ last Friday. Analysts forecasted more soybeans planted due to the rain delays in corn. However, the report showed the opposite occured, with corn acreage increasing instead of soybeans compared to expectations. That news, combined with the weather threats allowed soybeans to regain a month’s worth of declining prices in just a matter of minutes.
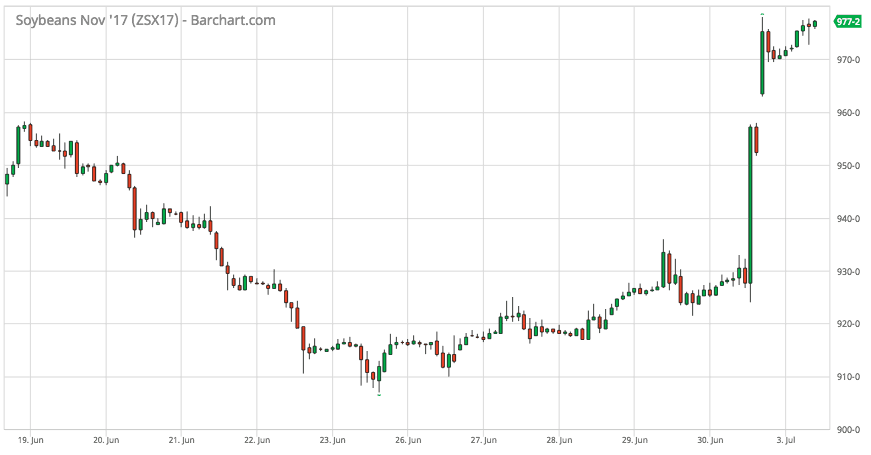
SOURCE: Barchart
We mentioned this grain scenario to our free newsletter subscribers back in May. The commodity ETN:JJG is comprised of wheat, corn, soybeans. We knew that if our weather forecast verified, that some fireworks in one or more of these markets could occur. The ETN price has already reached 4 month highs. In the coming weeks, traders will want to know how long this dry, hot weather will stick around in the Midwest. If wheat & soybean conditions continue to drop, so will the end-of-year yield/production estimates. Any shift in the ridge could mean a big change for corn and soybeans. For more on if grain prices will go higher, email subscriptionsbestweather@gmail.com

by Jim Roemer | Jun 27, 2017 | Commodities, Forecast, Strategy, Weather
Cotton prices dropped nearly 20% from May highs into late June. July futures prices spiked in May on tight supplies predicted in the USDA report. Great global crop conditions and strong speculative selling then spurred the current collapse. 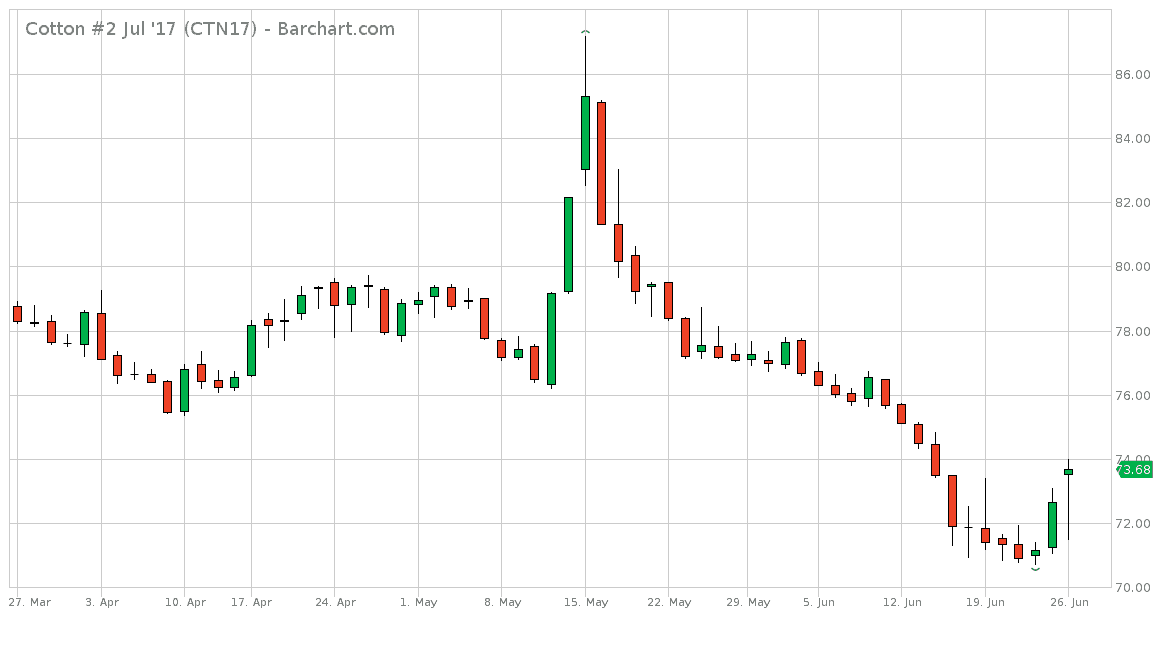 Credit: Barchart
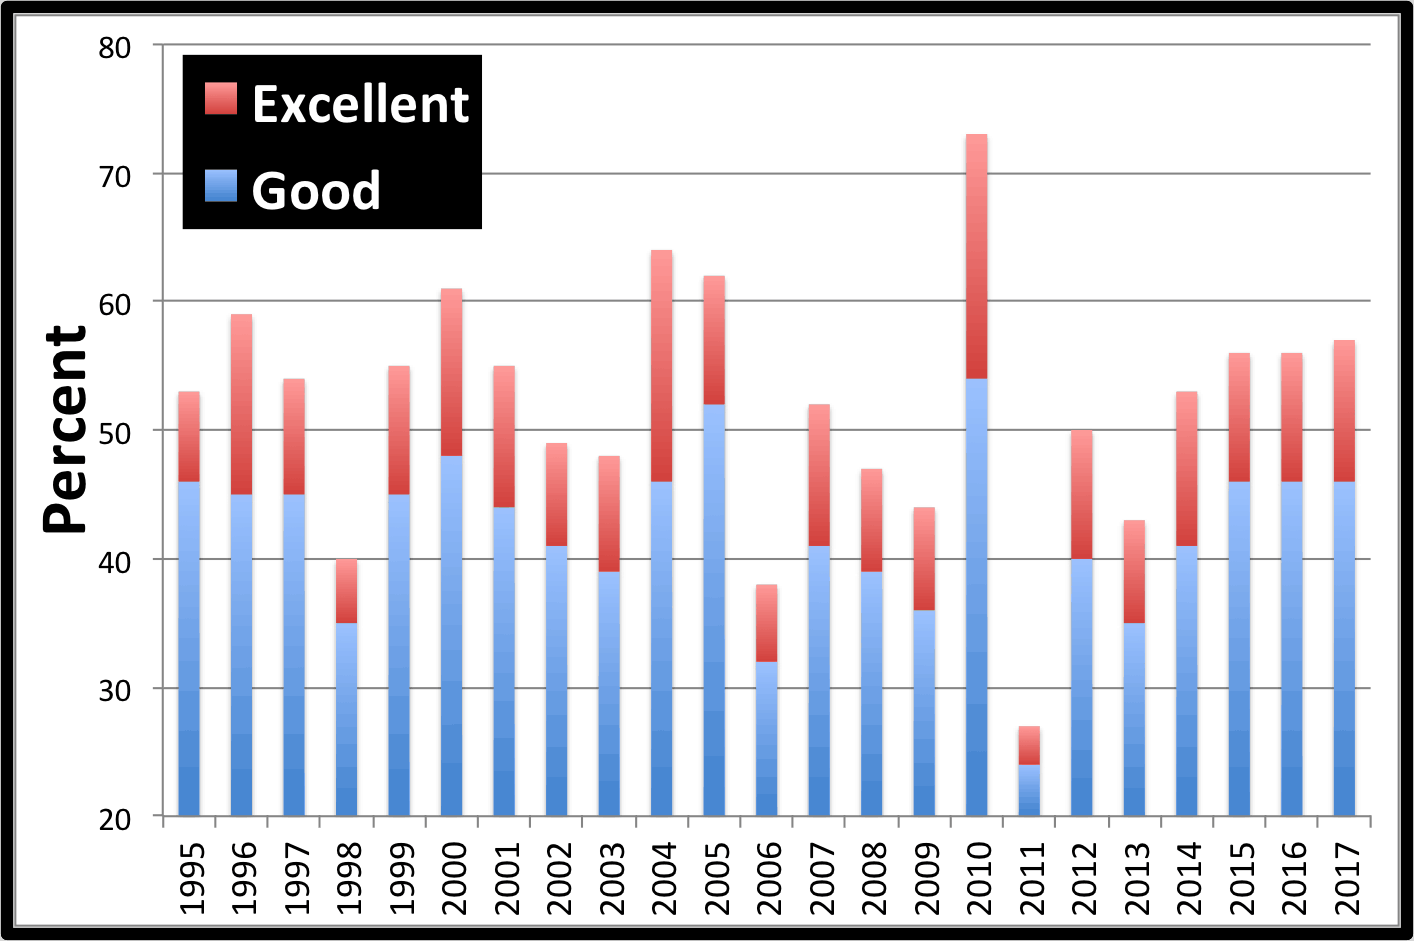
Most notably, India has had a great start to the monsoon (unlike the last few years). Farmers are getting adequate rainfall, aiding in the irrigation already in place. India is the second largest producer in the world behind China. Another country that should have great production is the United States. The latest crop condition report (June 25th) showed 41% of the crop rated good & 11% rated excellent (best since 2010 for this time of year).
Cotton Sales
The oddity of this price drop is that export sales have been very strong. China’s glut of cotton has been dwindling over the past few years. On top of that, China cotton users need higher quality cotton to blend with the old supply.
The next fundamental news to watch will be the USDA acreage report on June 30th. With good conditions, most analysts expect this to be friendly for U.S. production. Traders will also continue to watch India and U.S. weather conditions. We have an Indian monsoon report coming to our clients soon, giving the forecast for the rest of the season. The slight drought in Texas cotton areas may begin to be noticed if it continues. See the dryness developing in northern Texas:

by Jim Roemer | Jun 22, 2017 | Commodities, Energy, Forecast, Weather
Commodity prices are in a tail-spin, and global weather is not helping much. A rebound in sugar, cocoa and coffee production, plus a change in the pattern of much improved Midwest weather for corn and beans, has pressured most agricultural commodities. However, it is the energy complex that has really “taken it on the chin” recently. Despite the persistent hope for both an acceleration in domestic, and global, economic growth, commodities are down more than 13% in the past twelve months.
MARCH, 2017—–MY REASONS FOR BEARISH COMMODITIES
Jim Roemer on Bloomberg TV 3/14/17
How Lower Oil Prices Could Affect the Global Economy and Fed Action
Saudi Arabia earned $134.4 billion last year exporting its crude and refined oil products, down more than 60% from a peak of $337.5 billion in 2012, according to OPEC data. In reaction to plunging oil revenues, the kingdom drew heavily from its petrodollar reserves which have dropped below $500 billion for the first time in five years. Nevertheless, Saudi Arabia can still make decent profits even with oil at $30 a barrel. Consequently, there is little incentive for them to curb production. In addition, they began opening refinery operations a year ago, thus becoming an exporter of fuels and other petroleum products. This gives them a completely new revenue stream.
Combine this reality and the fact that the arctic is being tapped for more oil reserves, U.S. shale is increasing and the Chinese are taking measures to rely more heavily on renewable energy and cut their pollution problems, and one has very little case that crude oil will climb back over $50-$60, anytime soon.
The oil industry is learning to live with lower prices as the cost of exploration and production has come down. It is quite possible that this condition will ever change again.
With oil, natural gas and renewable energy sources so cheap, energy-fueled inflation may well be a thing of the past.
The cost of renewable energy sources, such as solar and wind, are slowly coming down, making them more competitive in the world market than ever before. If this trend continues, despite the Trump administration’s ill conceived action of pulling out of the Paris Climate Agreement and trying to revamp the U.S. coal industry (forget it—won’t happen in my opinion), global oil demand could stay flat or even fall over the years to come.
The Fed successfully fought financial deflation in the wake of the credit crisis in 2008/09. But technological deflation is making a comeback, which might limit price increases in consumer goods and services for many years to come.
There is some risk of financial deflation perking up again. While usually, there is often an inverse relationship with the price of equities and commodities, commodity price deflation might force resource companies to cut back again. Hence, while the U.S. stock market continues to roll along, this all “might” be a warning flag of “caution” in the months ahead.
Certain equity sectors could be at risk and in those emerging markets (Mexico, Brazil) that depend heavily on higher oil prices to boost their economy.
Perhaps, this might all influence Janet Yellen to rethink the Fed’s plan to raise interest rates in the months ahead. Inflation may not be headed in the direction that they feel.–Jim

