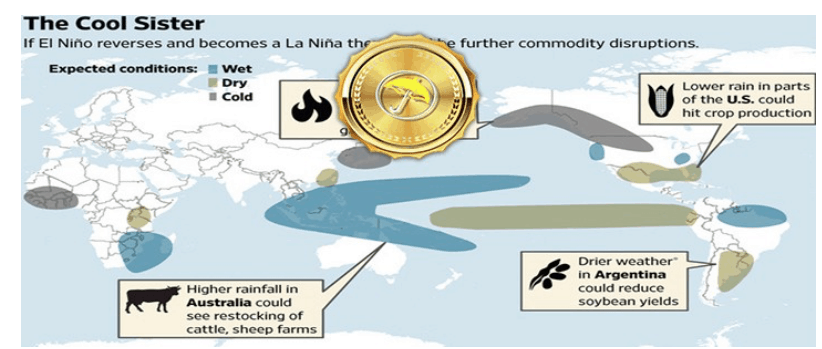
La Niña typically affects a broad range of farm commodities
Often called the “Cool Sister” of El Niño, but not because she is the “hip” one. Due to cooling waters off Peru’s coast that can extend west to Australia, she can bring above-average rainfall to The Land Down Under. She can also create potential flooding conditions to Southeast Asia. The cooler and more extensive these waters are, the stronger this phenomenon can be. A weak vs. a strong La Niña can have huge global impacts on commodities. It also increases price volatility in everything from natural gas to cocoa, sugar, coffee, cotton, grains and oilseeds.
Map Source: The Wall Street Journal
Some La Niña events can deliver global weather issues for coffee crops. We changed our view 3 weeks ago for our clients who subscribe to our WeatherWealth newsletter. Our outlook became more bearish as we saw a shift in the pattern for extensive rainfall in Brazil’s coffee region. This particular La Niña is creating a bull market in sugar, and prices have been soaring. Parts of Brazil (e.g., São Paulo) have a greater possibility for drought, and Argentina’s croplands can become more arid. Drought is also more likely in Thailand.
You can download Jim Roemer’s new, inexpensive global long-rang weather forecast newsletter for free
DOWNLOAD FREE REPORT–CLICK ABOVE
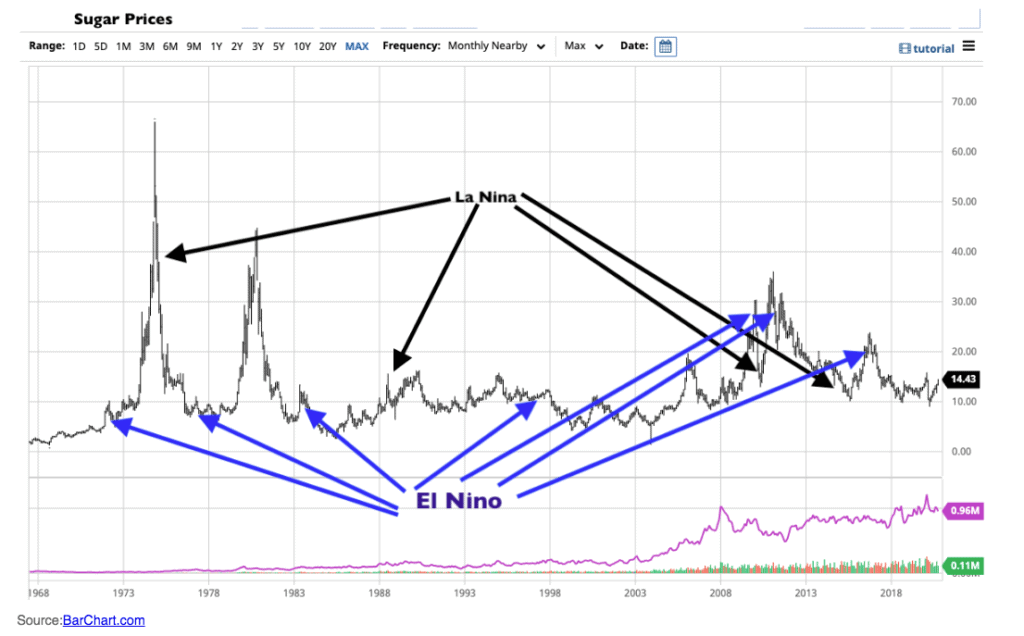
Sugar is in a bull market due to La Niña
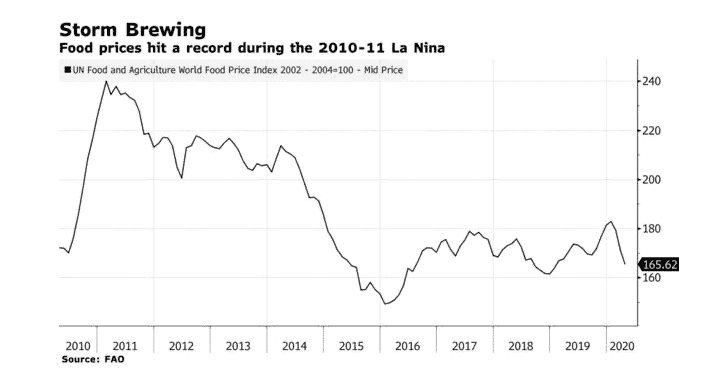
As is the case with El Niño, the Cool Sister can have an major impact on global commodities. However, La Niña’s influence is often the opposite. Keep in mind that not each La Niña event is the same. Furthermore, the media coverage often errs by looking at only a couple of cases. For example, the chart below shows higher global food prices during the 2010-2012 La Niña. To professional statisticians looking at 50+ years of historical cycles, ONE case to look at, is not enough.
There is one mistake that many commodity traders and news services make. They do not take into account other global teleconnections and phenomena. These are Sea Ice, Climate Change and weather variables thousands of miles away. That is how Jim Roemer makes long range weather predictions that support trade suggestions for our clients.
The chart above shows the historical movements of sugar prices during, or just after, the most impressive La Niña or El Niño events. One can see that most of the bull markets in sugar occur during El Niño events and not always from the sister who cools the waters. This is because India (the second largest sugar producer/exporter after Brazil) tends to have crop reductions during La Niña events. This year, however, a three month drought in São Paulo and longer after-effects in Thailand, from the last El Niño, have reduced global sugar supplies.
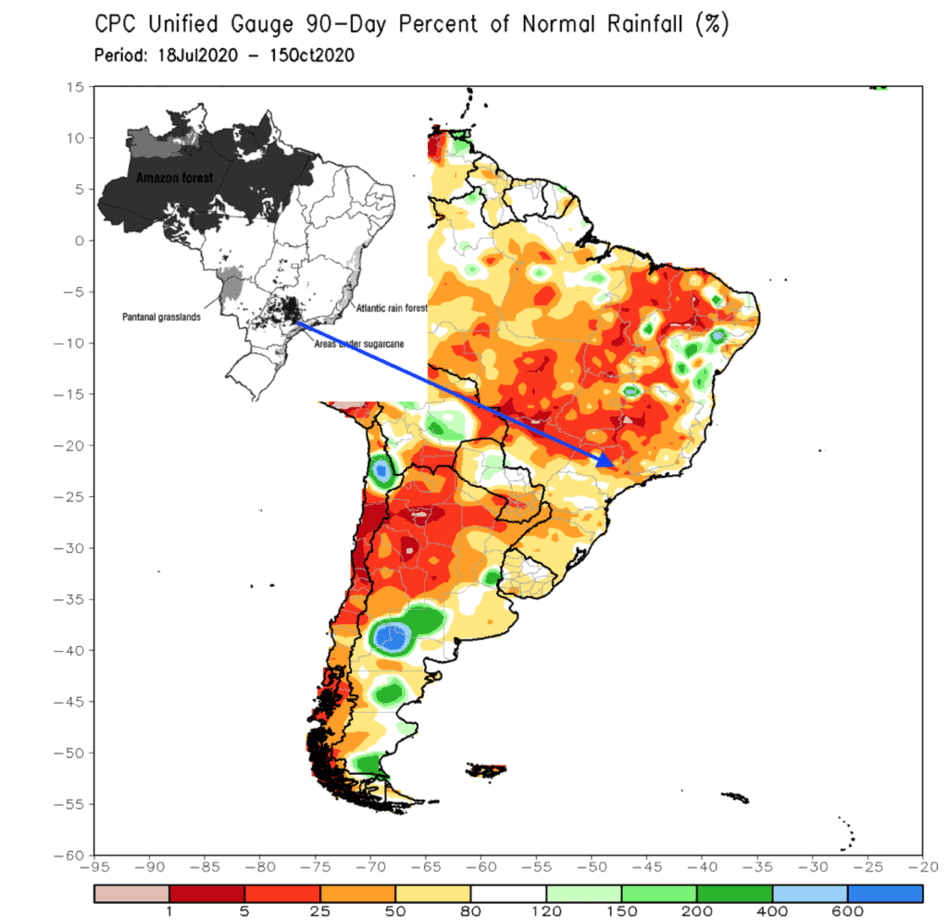
Map Source: NCEP
Above, the dry weather you see in Brazil during the last three months has been reducing the nation’s sugar crop. What’s next? Will corn and soybeans be affected, and result in a further bull market?
Stay tuned and subscribe to WeatherWealth
Global wheat production is reduced in 70% of La Niña cases
Higher wheat prices, longer term, and big crops in Australia, following devastating El Niño & Climate Change problems may be a blessing for Aussie wheat farmers in the months ahead.
Wheat is one of the few commodities that tend to “consistently” see global weather problems that reduce supplies.
After multi-year record global crops and poor prices, this market has finally begun to turn the corner. We began advising clients several weeks ago about a developing drought in Russia where fall wheat plantings would be affected, as well as drought conditions moving into the US Plains. Wheat prices have soared more than 15-20% in recent weeks, but will remain volatile and more difficult to trade due to the “demand side” of the equation remaining weak.
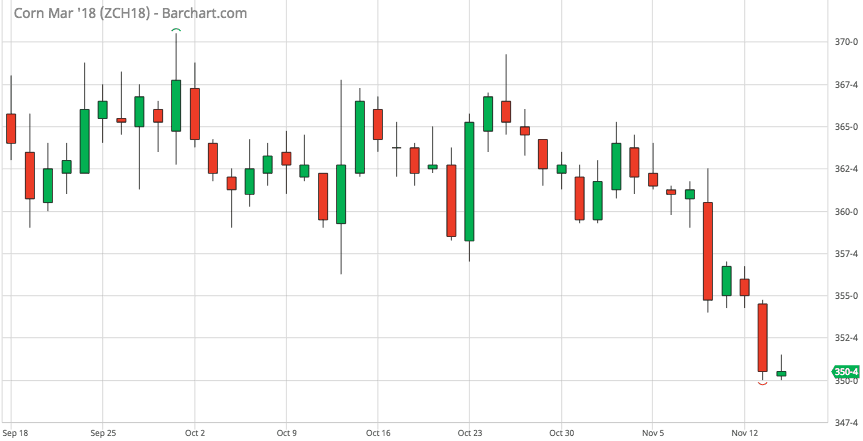
Corn futures have floated between $3.60 and $3.70 since mid-September. That is, until last Thursday. See the March prices below from Barchart.com.
USDA Report
The big news from the release was the increase in corn yields expected in the U.S. to 175.4 bushels/acre, a record yield if it verifies. Another record of 14.78 billion bushels was also forecast. Prices dropped 7 cents on the day of the report. This was a surprise. Just a few months ago there was strong concern over the drier weather in June and July. It appears corn was resilient and there was relatively no damage. As you see in the chart, prices continued to fall this week. Focus has now shifted to South America.
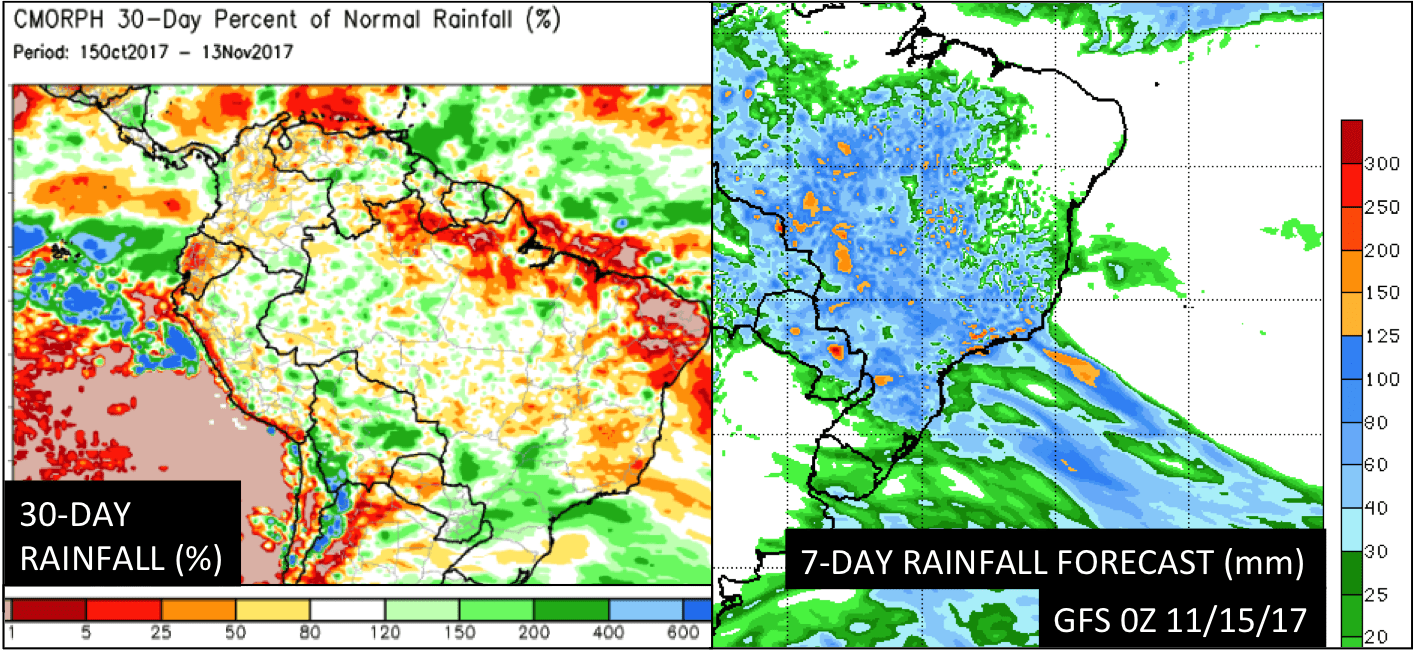
Brazil Rainfall
It has been a good start to the crop season so far. Rainfall has been above normal for most of the areas. The forecast for the next seven days continues to show ample moisture in Sao Paulo, Mato Grosso and Minas Gerais. This comes during a very important time in the crop growing cycle.
Argentina rainfall can slip during La Nina years, but otherwise there isn’t much worry in SA weather. Another great SA crop will limit any concerns on the supply side. Therefore, any rise in corn prices will likely come from the demand side. Such an increase could stem from continued evolution in tastes, as diets in Latin America and Asia have been “westernizing” in recent years. In addition, upward price activity in the energy markets could boost ethanol demand, thus helping to firm the corn market.
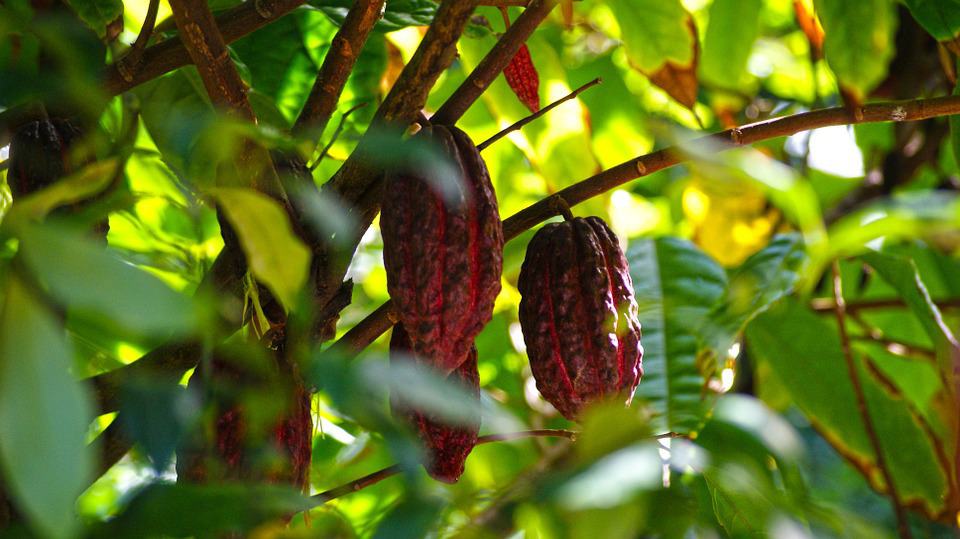
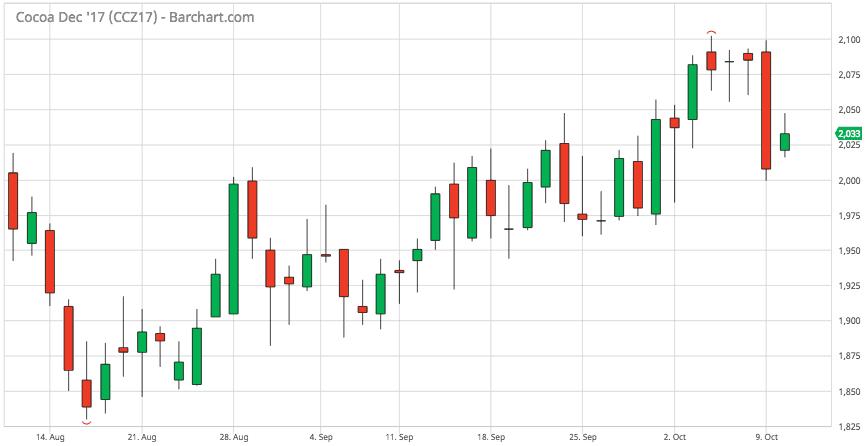
September became the first month since March that December Cocoa Futures did not drop to $1830. Cocoa prices have been hovering in a range between ~$1800 and $2100 in the same period. There just doesn’t seem to be enough news (on either side) to break out of it. The recent rally (although littered with retracements) is the first sign of life for cocoa. Smaller fundamental and technical news (like currency, technical levels) have been bouncing cocoa around. Traders will be watching and waiting to see if this will be enough to bust out of the range.
Great Weather
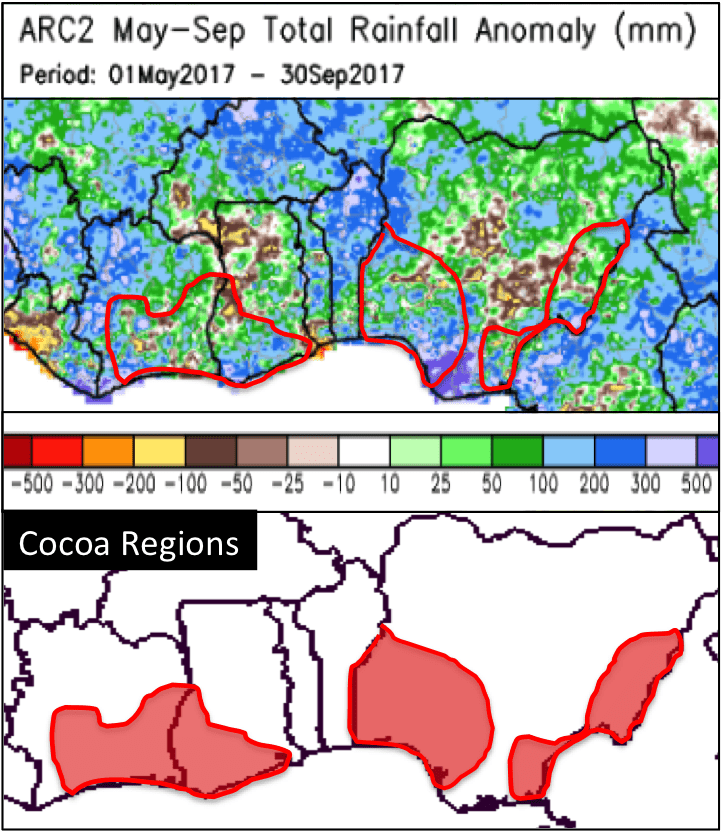
Weather for last year’s main and mid crop was fantastic (Climatech really nailed this), causing the large drop in cocoa prices in 2017. Then, traders eyed the next rainy season, which began in May. Although there were some scares, a second summer of beneficial rainfall occured. It was too rainy at times, but the past few month made up for it, with a good mix of sun and showers. See the plentiful rainfall May-Sept below:
Source: NOAA, NCEP
The next 15 days are set to have below normal rainfall, allowing for a more expedite bean harvest.
Demand vs Surplus
Last year had a global surplus of 371,000 tons, the largest in over 17 years. Despite a slight delay in harvest due to political instability, most analyst are expecting an additional surplus this year. The International Cocoa Organization (ICCO) has noted that although Asia grindings have decidedly increased, those for Europe and America have been modest at best. Europe Cocoa Association will release its grinding statistics for the 3rd quarter on Wednesday.
UPDATE: The European Cocoa Association announced a 3% increase in 3rd quarter grindings from last year, above expectations (Wall Street Journal survey estimated 2.3%). Total grindings so far this year are the highest in 6 years.
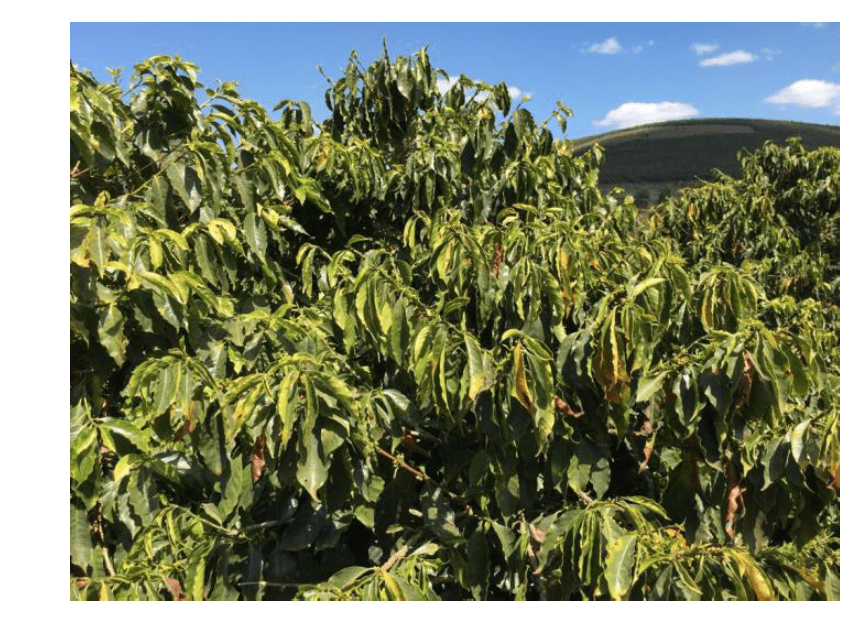
Photo Credit Judy Gaines: check out her website here The picture above shows leaves wilting on coffee trees in Brazil prior to the main bloom that begins in October. In the coffee areas, there were several droughts over the last 30 years during the critical October-December period. The most severe drought in that time frame occurred in 1985 when coffee prices rallied 80%. We will also monitor certain weather issues in Indonesia and Colombia. This enables us to build an overall longer term view of South American coffee production and price potential. This type of analysis is only available to paid subscribers.
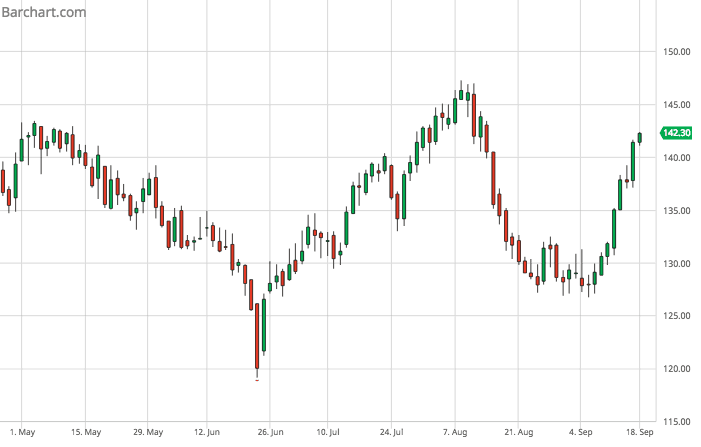
December coffee futures have bounced nearly 15 cents from the early September lows. The buying flurry is a result of the dry weather seen in the early development of the coffee crop. Prices have remained in the $1.20-$1.50 range since May. See the December contract prices below (Credit Barchart)
Lack of Rainfall
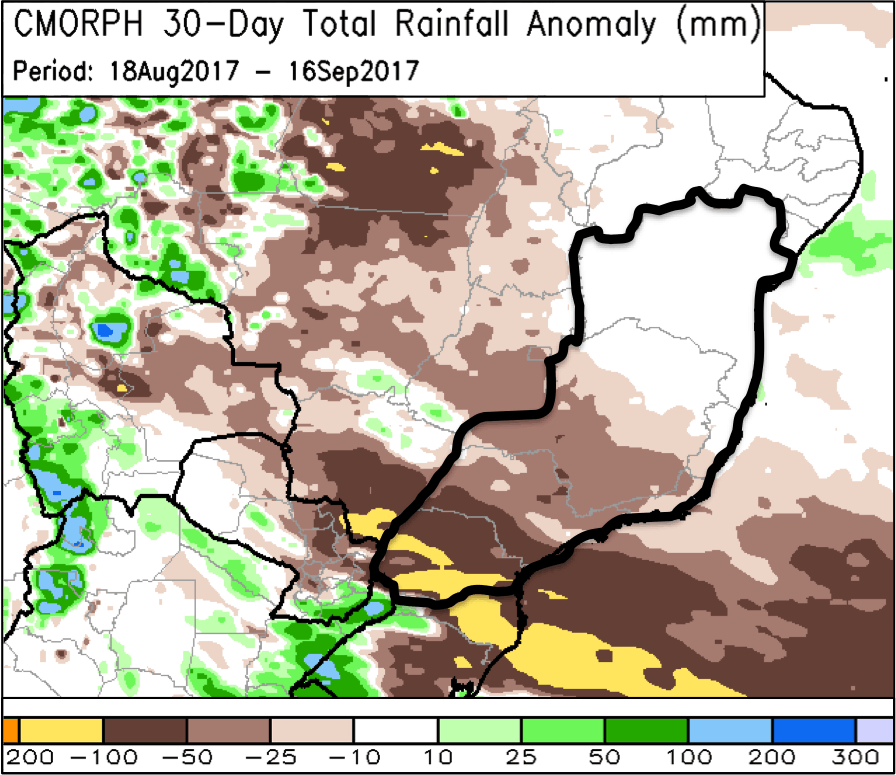
June is the peak of the dry season in Minas Gerias, Brazil’s greatest coffee producing state. Typically, rains start to pick up in September, on their way to a peak in December. However, 2017 has been stingy. Most areas have received 50-150 mm (2-6 in) less than average. The past 30 days of rainfall in the four major states outlined in the graph indicate poor conditions occurring over all areas.
This is an ‘on-year’ for Brazil coffee, with a massive crop expected. These hopes aren’t ruined yet, but rainfall is definitely needed over the next 2-6 weeks. The latest GFS forecast does not look beneficial for coffee in the 7 day outlook. Very little rainfall is expected. What about in the following weeks? Only paid subscribers will receive updates on if rejuvenating rains will occur, impacting prices.
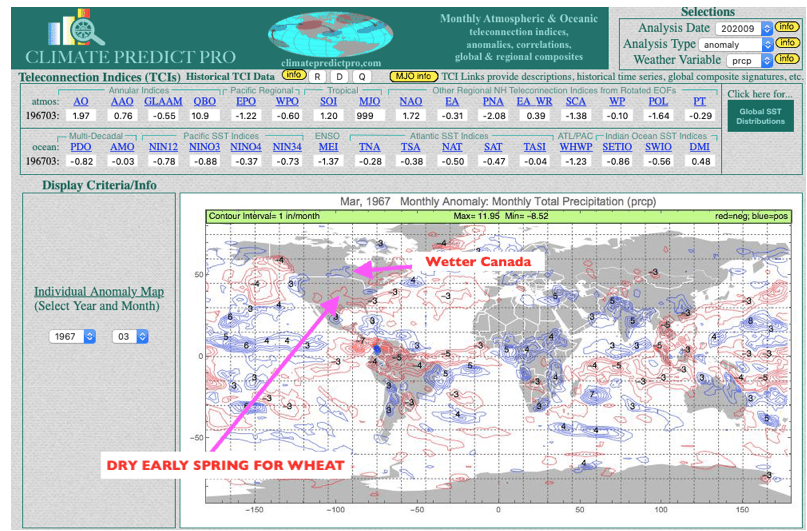
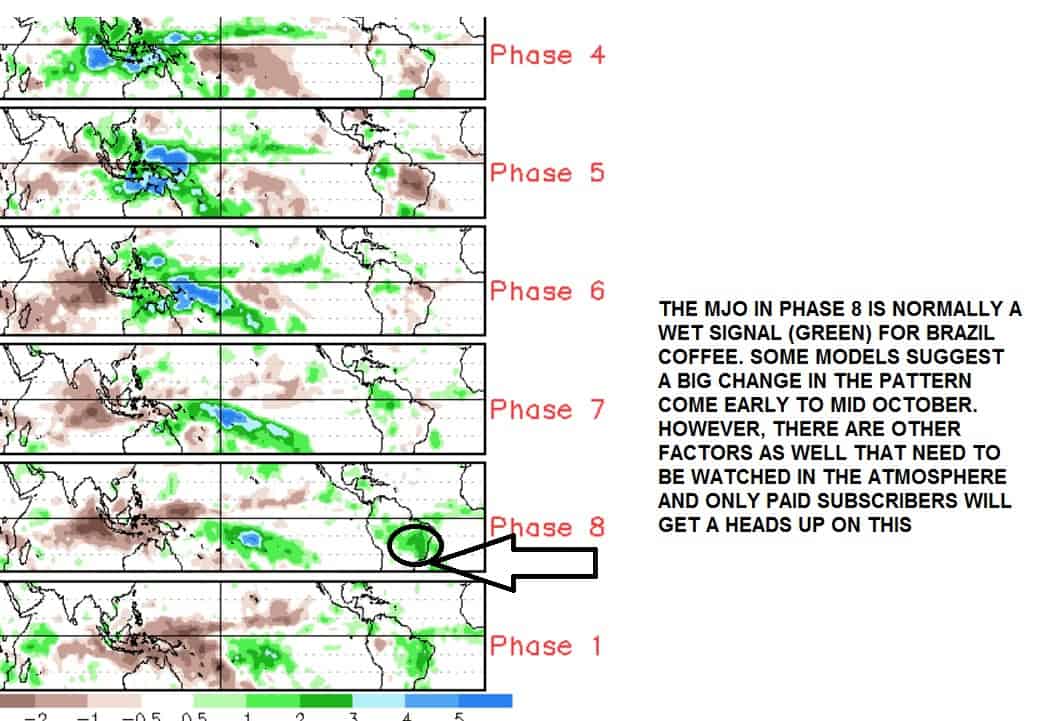
MJO Moving to Phase 8 and Weak La Niña Signal. Will It Break Brazil Dryness?
The Madden-Julian Oscillation (MJO) is a tropical disturbance that propagates eastward around the global tropics with a cycle on the order of 30-60 days. The MJO has wide ranging impacts on the patterns of tropical and extratropical precipitation, atmospheric circulation, and surface temperature around the global tropics and subtropics. There is evidence that the MJO influences the ENSO cycle. It does not cause El Niño or La Niña, but can contribute to the speed of development and intensity of El Niño and La Niña episodes.
The MJO (below) may be moving into a wetter Brazilian phase by October that could ease the Brazil dryness and if it does, break coffee futures. However, our unique Climatech Program can forecast weather months in advance and has been used recently to predict the very active hurricane season and many major moves in commodities. Will the dryness in Brazil break the coffee market if rains fall? Email us at subscriptionsbestweather@gmail.com for information about our services. –Jim Roemer
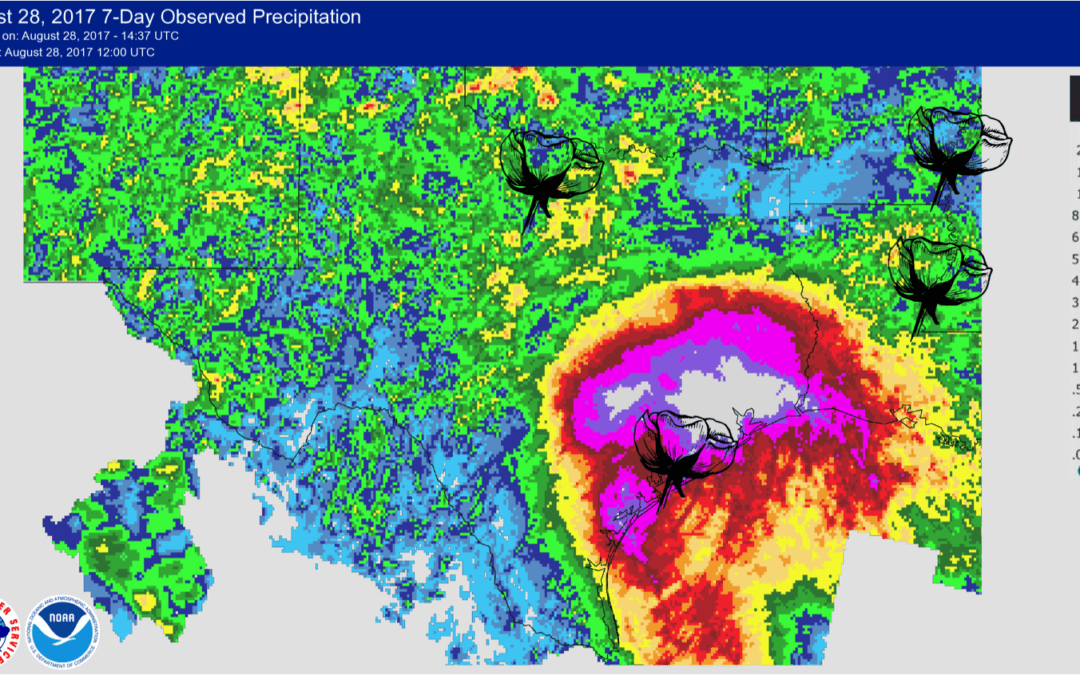
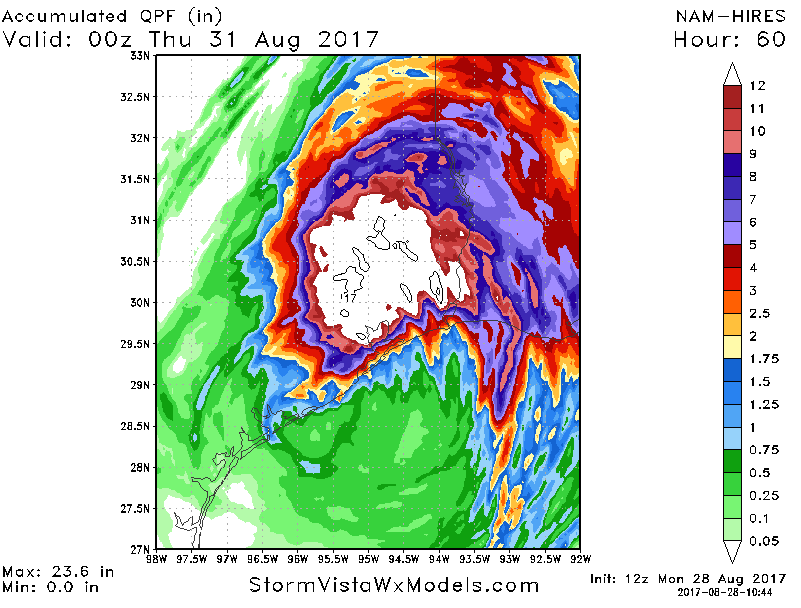
Harvey came ashore near Rockport, TX as a category 4 hurricane, with 130 mph winds; but, the worst flooding has yet to come. More than two feet of rain has fallen, so far, over most of the Houston metro area. News footage of flooded neighborhoods and life saving water rescues have been heartbreaking. Unfortunately, there could be another 10″-15″ on the way for parts of Houston. The image below shows the latest NAM model forecast of additional rain:
Why will the rain continue? The path of Harvey tracks back to a more favorable location: the Gulf of Mexico. In that larger body of water, the warm moist air is more conducive for a storm to regain power. The low will strengthen and pick up moisture starting late today into Tuesday night. A second landfall will occur sometime on Wednesday.
What stocks/futures were impacted?
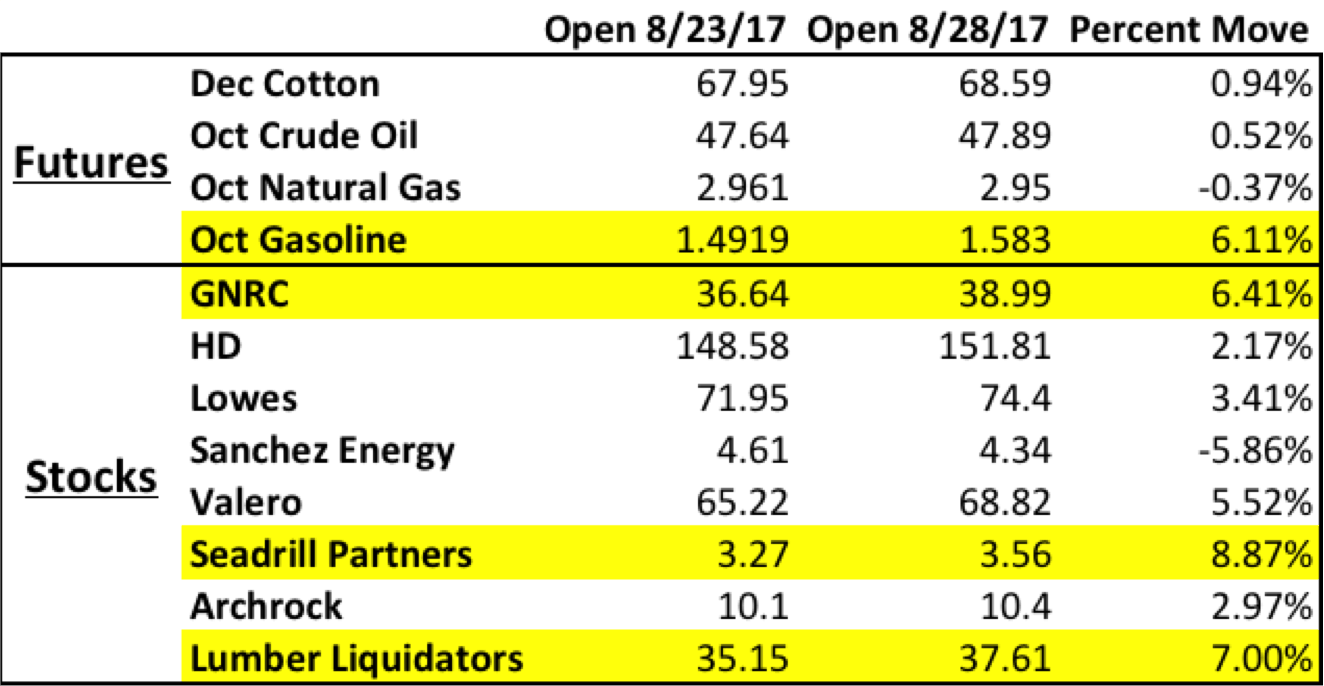
We created a table of current market impacts from Harvey. Generac (GNRC) produces commercial and residential generators. Home Depot (HD), Lowes (LOW) and Lumber Liquidators (LL) are retailers that have significant market share in home improvement goods. The remainder of the table include futures and stocks related to energy and cotton.
Parts of the energy sector have reacted differently to the aftermath of Harvey’s wrath. Natural gas and oil rigs can sustain 60 ft waves and category 5 hurricanes, limiting any damage. Natural gas futures are up today, as offline production is more than anticipated (production below 71 bcf/day). Although 105 out of the 737 manned platforms in the Gulf were evacuated, production should resume immediately once conditions improve. Gasoline (RBOB) refineries are another story. S&P Global Platts estimated that we are losing 2.2 million barrels per day from refinery shutdowns. Due to impassable roads, any permanent damage to infrastructure remains unknown. October RBOB futures prices have risen ~6% from last Wednesday’s opening to today’s. For more information on how Harvey will continue to impact the energy market, please email us at subscriptionsbestweather@gmail.com.
Cotton & Harvey
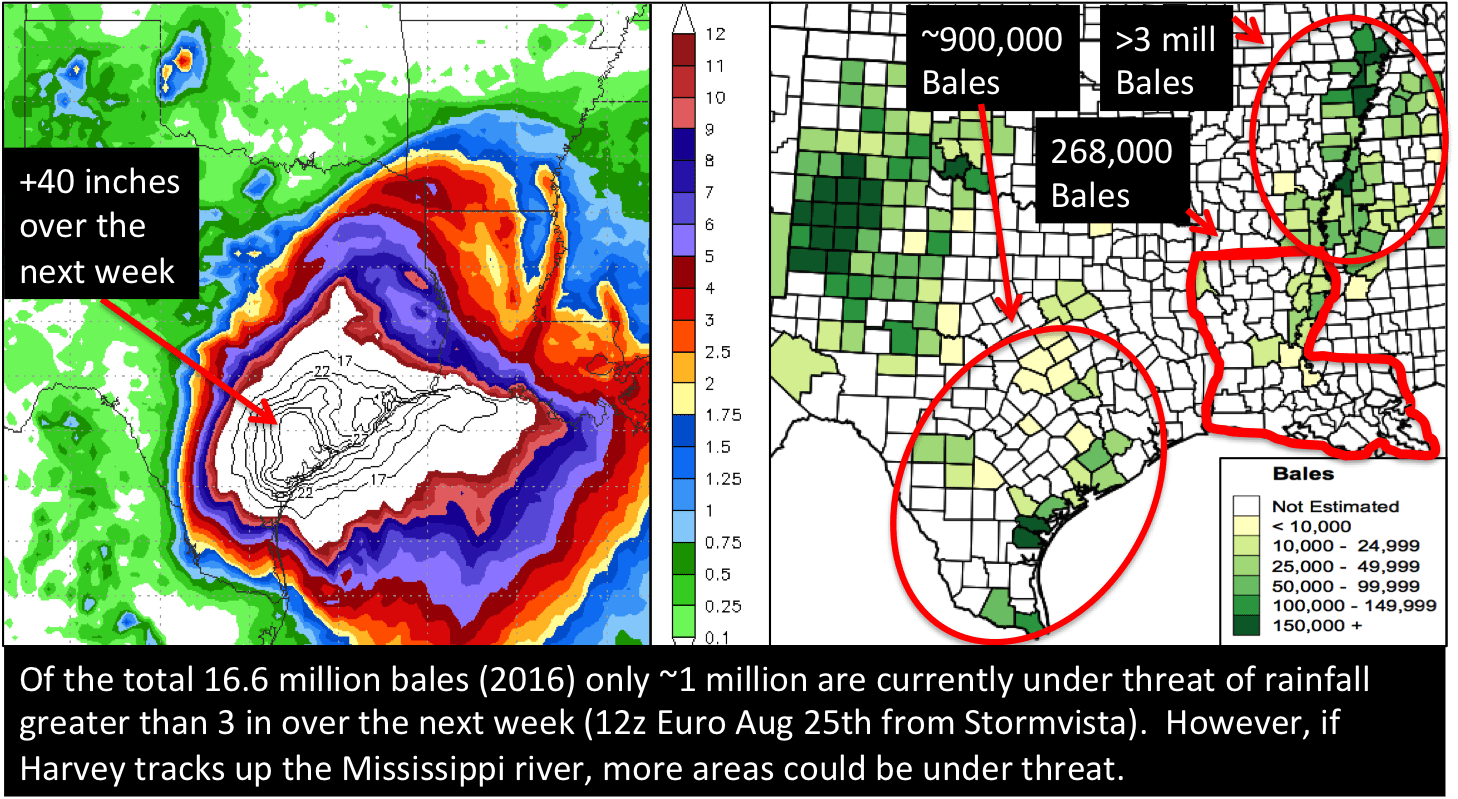
Cotton is another market that traders have been monitoring for Harvey related opportunities. When cotton bolls are open, heavy rainfall can knock off the fibers. There is also some concern of flooding in some of the storage facilities. However, only about 14% of Texas cotton grows in the southeast part of the state, and this amounts to only 5% of the total US cotton production. In order to impact the nation’s supply/demand equation, there would have to be crop damage in the areas up the Mississippi river. The image below shows the European forecast from last Friday with cotton growing areas highlighted:
HELPING YOU MAKE THE BEST INVESTMENT DECISIONS BASED ON THE WEATHER
We use cookies to ensure that we give you the best experience on our website. If you continue to use this site we will assume that you are happy with it.