by Jim Roemer | Feb 14, 2017 | Climate, Commodities, Skiing, Weather
Climatech above showing positive Global Angular Momentum above has been partly responsible for the warm winter and the incredible moisture out west and huge snows predicted as early as last November. This feature along with a positive QBO index have offset all forecasts by meteorologist this winter, calling for a cold winter. When GAAM is positive, the signals are more like an El Nino rather than a cold U.S. La Nina type winter.
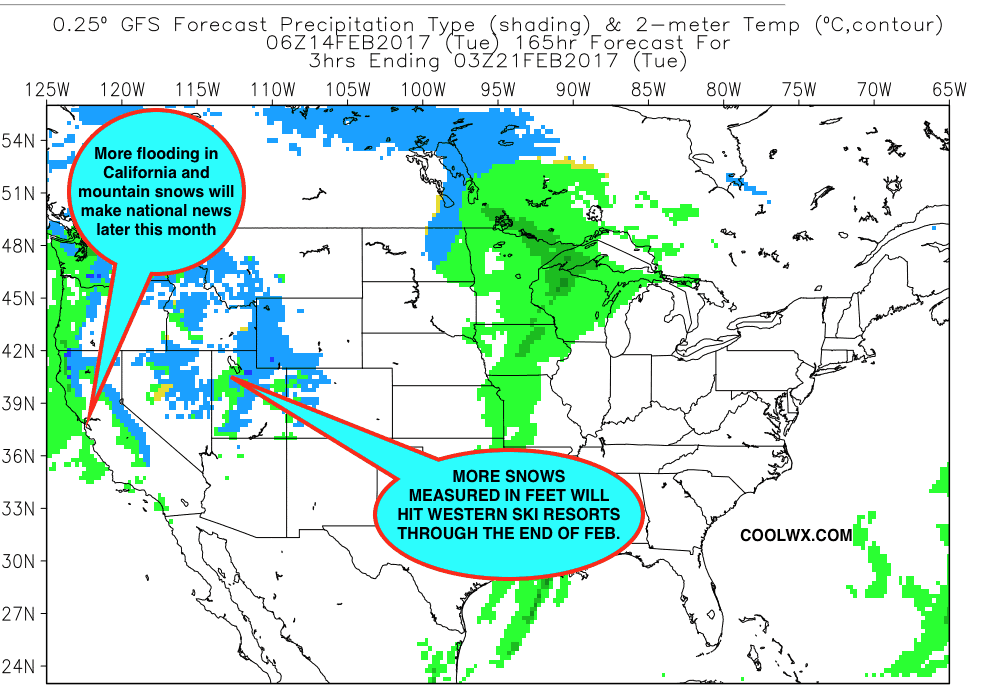 The continued “pounding” of the western U.S. has prevented major cold from affecting much of the Midwest and East this winter, and greatly responsible for the recent collapse in natural gas prices The Atmosphere has acted more like an El Nino, than a La Nina due to positive Global Angular Momentum. This may suggest that a weak El Nino could be on the way by summer. Cocoa traders will pay close attention to whether a weak El Nino will form, after our predictions last Fall of growing global cocoa production and a potential collapse in prices
Watch the storms Pound the West the next 2 weeks click here

by Jim Roemer | Jan 13, 2017 | Forecast, Skiing, Weather
In one of the most Jekyll and Hyde weather patterns in recent memory, much of the country will go from near record warmth next week to potentially very stormy and colder weather towards the end of January and first week of February. The pattern may continue to oscillate back and forth, with higher confidence that March will be quite cold. This is because of low sea ice helping to cause the polar vortex aloft to strengthen and once we head towards spring, this system will be displaced to the South. This could improve snowfall for many eastern ski areas before or by spring.
For now, after melting snow and more mediocre ski conditions in the East, I look for the NAO index to go negative later in January and for the potential for an important east coast snowstorm possible sometime around or after January 27th.
Each pattern change the last 6 weeks has been brought on by some feature entirely different than the previous. In the case coming up for later January, the MJO, stratospheric warming (see blog on January 10th below), plus what we call a retrogressive wave pattern, will open the door for yet another, colder pattern change. However, the way this pattern has been all winter long, I would expect that warmer risks will occur again later, making any major rally in natural gas prices the next few weeks unlikely. Computer models cannot be trusted this year.
Here We Go Again! Volatile U.S. Weather Pattern Affects Natural Gas Trading
MAP FROM WSI CORPORATION OF JET STREAM; COMMENTS BY JIM ROEMER. January 13th
WHAT IS RETROGRESSION?? Colder risks at time, but not consistent will result in more natural gas volatility.
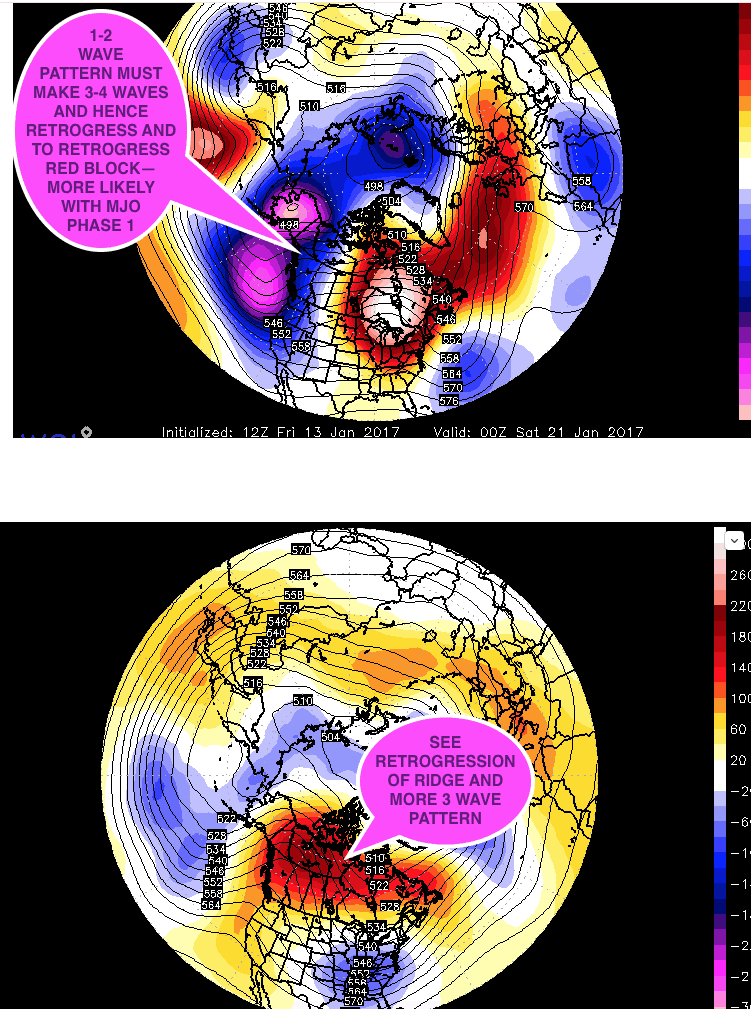
LATE JANUARY PATTERN FOLLOWING UPCOMING WARMTH
by Jim Roemer | Jan 10, 2017 | Commodities, Forecast, Skiing
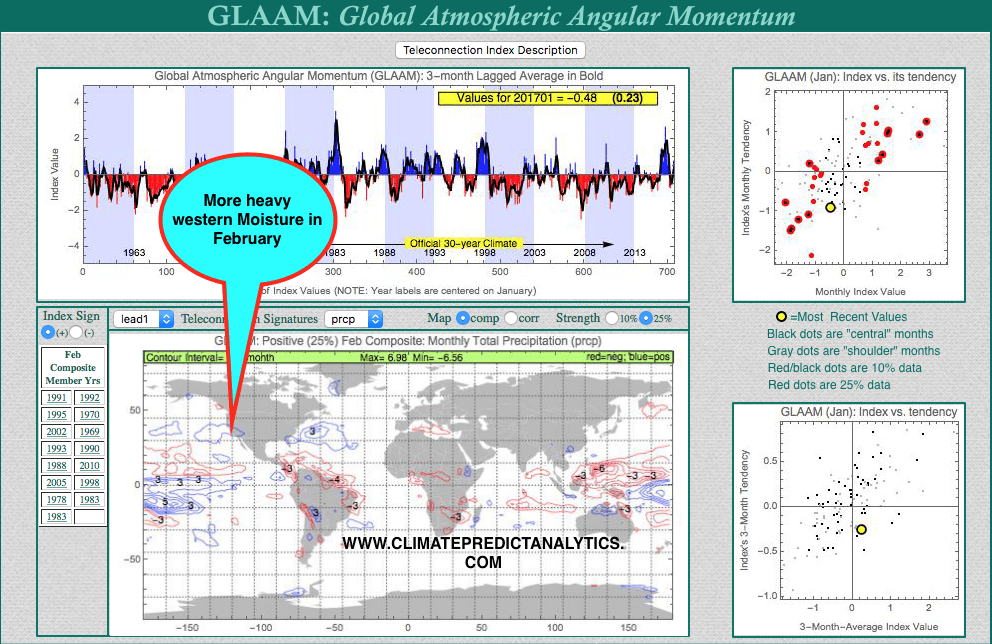
The global atmospheric angular momentum (GLAAM) index is simply the total rotation of the atmosphere compared to the Earth’s surface. Typically, El Nino years lead to positive GLAAM values and La Nina years lead to negative GLAAM values. When you have both in phase, El Nino and La Nina weather patterns are amplified. However, we currently have + GLAAM and a weak La Nina Modoki (west-based La Nina).
http://www.jamstec.go.jp/frcgc/research/d1/iod/e/elnmodoki/about_elnm.html
This is an odd occurrence, with the atmosphere “acting like” an El Nino, and sea surface temperatures indicating a La Nina. We believe this is one of the reasons contributing to the tough winter forecast this year, as well as the constant pattern shifts. However, more than a week ago, we began telling clients that this January could end up being a warm one nationally and natural gas withdrawals would decrease.
A +GLAAM also favors the record, damaging rains we’ve seen in California and Nevada over the past week. With +GLAAM in January, Climatech composites and correlations accurately predicted this wet weather pattern. Emergency managers are ‘all hands on deck’ in the valleys with flooding roadways and dangerous mudslides: https://www.youtube.com/watch?v=i26_tWxSCLA All the while, snow lovers are chomping at the bit to ski/snowboard near record mountain snows. Mammoth mountain received 82” over just the past 10 days!
Shown below are the composites (blue indicates above normal precipitation) and correlations (red indicates a positive relationship) from Climatech. Notice most years with a +GLAAM were El Nino years, unlike this year.
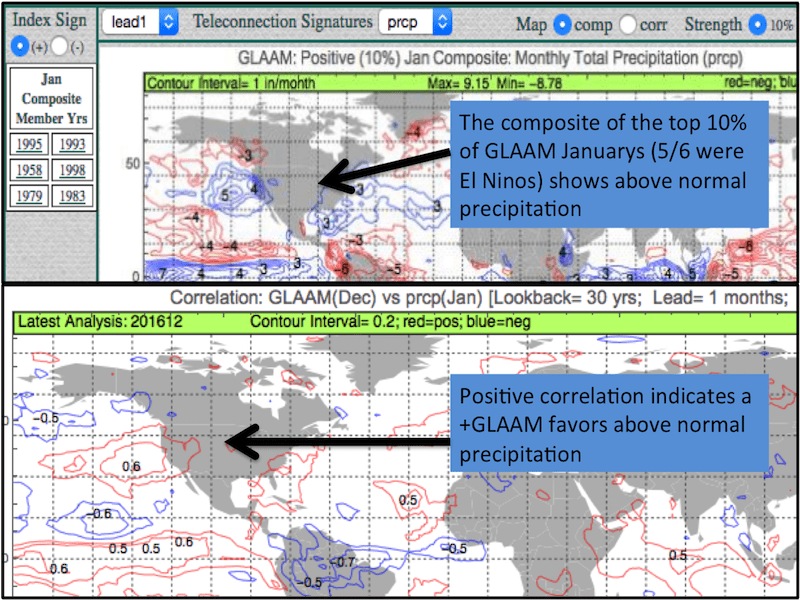
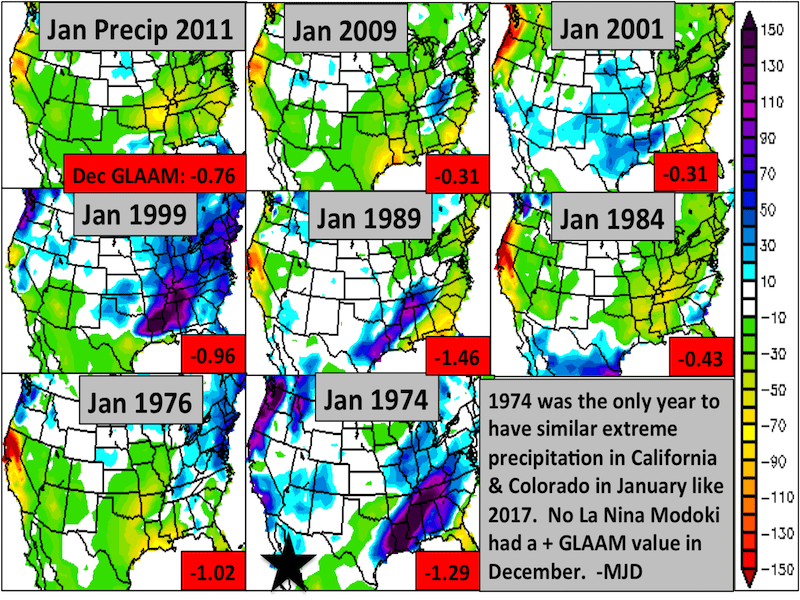
The question is, can we use these conditions to find good analog years? Meteorologists use analogs to forecast future weather. The theory is that similar initial conditions (e.g. strong pacific jet) or boundary conditions (e.g. sea ice extent, snow cover) will lead to similar conditions down the road. Only 4 La Nina years had similar rain/snow in January: 2008, 2000, 1996, & 1974, with 1974 being the only La Nina Modoki. 1996 was the only La Nina year which had a +GLAAM in December.
The images below show January precipitation patterns during La Nina and La Nina Modoki years. December GLAAM values are also shown.
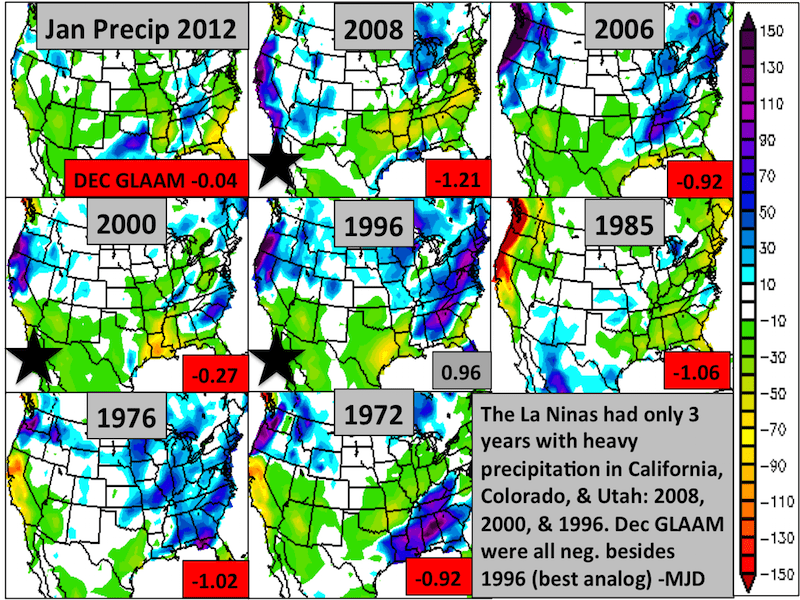
The analogs below are based on +GLAAM, a weak La Nina and huge snows out west have some colder risks, later this winter in the North and East. However, a warmer Atlantic and a lack of snow cover may mean warmer risks at first.
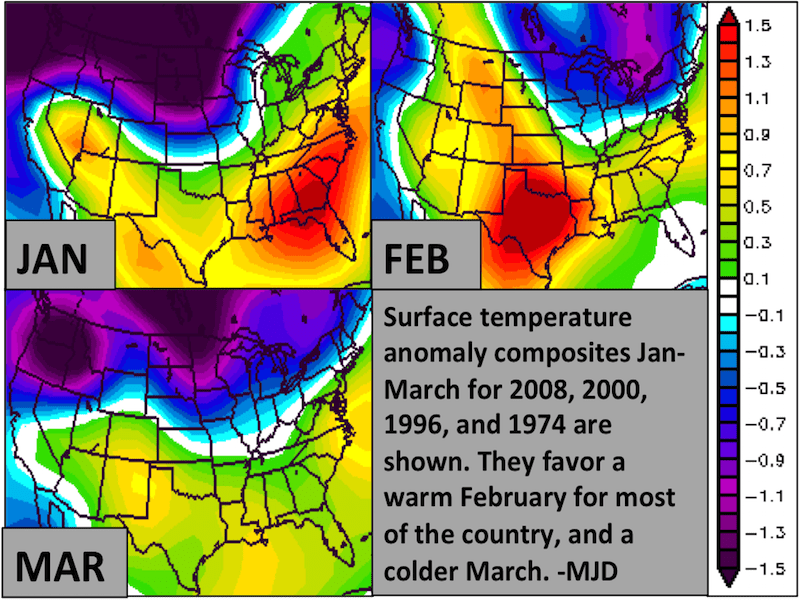
Although not perfect (January will end up warmer), these analogs somewhat agree with the forecast we have given our clients. This is a decent example of how analogs can be used in energy and agriculture weather forecasting, making Climatech an invaluable tool. In 3 of these 4 years, U.S. natural gas areas turned quite cold later in February and March, but odds remain high for warm weather until at least early February.
by Jim Roemer | Jan 5, 2017 | Climate, Forecast, Skiing, Weather
Our Climatech program below, the best long range product in the industry, saw these snows coming, weeks ago.
California Drought Easing
The on going California drought has caused billions of dollars in losses the last few years to municipalities, farmers and agriculture in general. California, whose GDP is higher than most countries in the world, depends greatly on winter snow pack for their water supplies.
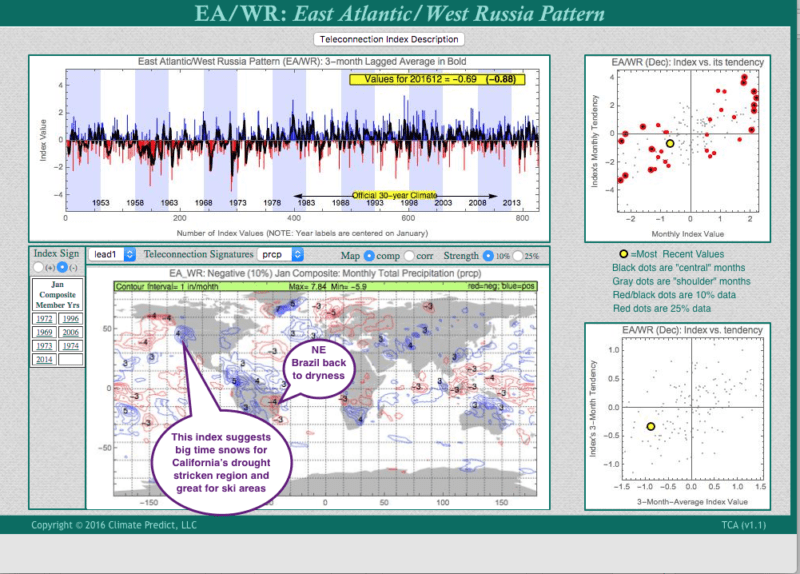
While many forecasters always blame the warm Pacific, or La Nina, etc. for the on going droughts out west, there is a little known teleconnection that may shed light for big time snows and a more active Pacific pattern this winter. The East Atlantic/West Russian Pattern Index is not discussed much, but the map below shows that its relationship with above normal January moisture in California for many ski resorts, is quite highly correlated.
This index also portends some potential problems for NE Brazil coffee areas and generally good weather for the west African cocoa crop.
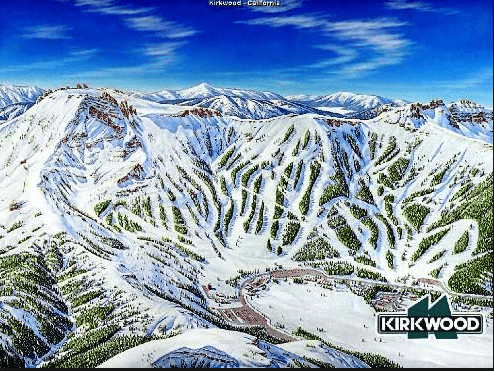
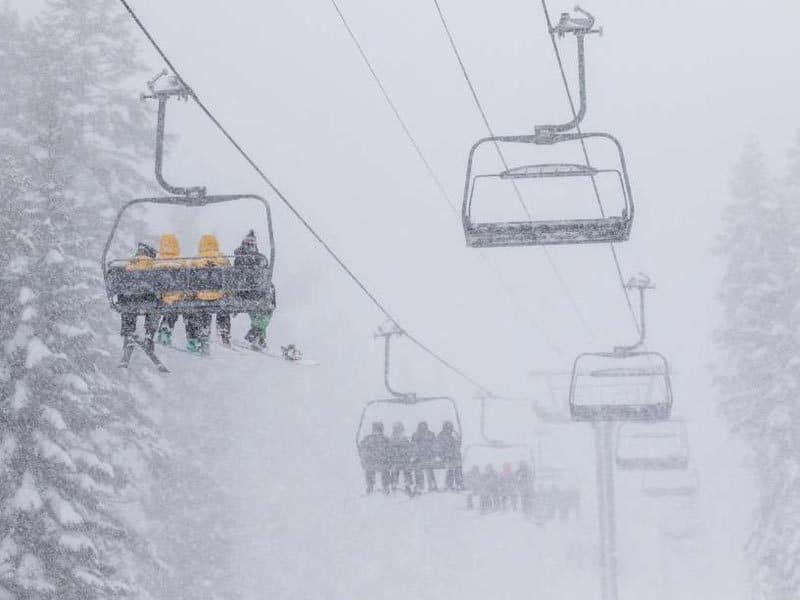
Ski areas such as Kirkwood, Lake Tahoe could see 5-10 feet of snow over the next week. Many areas have already seen 4 feet the last 7 days–the best skiing in years. Great skiing will continue in Colorado, Utah, etc., while eastern ski resorts see a big warming trend heading into mid-late January.
What is the East Atlantic/West Russia Index Pattern?
The East Atlantic/ West Russia (EATL/WRUS) pattern is one of three prominent teleconnection patterns that affects Eurasia throughout year. This pattern has been referred to as the Eurasia-2 pattern by Barnston and Livezey (1987). The East Atlantic/ West Russia pattern consists of four main anomaly centers. The positive phase is associated with positive height anomalies located over Europe and northern China, and negative height anomalies located over the central North Atlantic and north of the Caspian Sea.
The main surface temperature anomalies associated with the positive phase of the EATL/ WRUS pattern reflect above-average temperatures over eastern Asia, and below-average temperatures over large portions of western Russia and northeastern Africa. The main precipitation departures reflect generally above-average precipitation in eastern China and below-average precipitation across central Europe.
CLIMATECH
BLUE SHOWS ABOVE NORMAL JANUARY PRECIPITATION OVER CALIFORNIA AND RED, DRY OVER NE BRAZIL. This product can predict weather trends months in advance before other services.
by Jim Roemer | Dec 20, 2016 | Forecast, Skiing
The weather pattern is such that tons more snow will fall on western ski resorts through early-mid January, while eastern regions see less optimal conditions. By Christmas, near or record warmth will affect the east, as I advertised eight days ago. While many forecasters point to a La Nina Modaki (west based weak La Nina) to predict a cold January, these teleconnections below say otherwise. A lack of stratospheric warming aloft, plus various factors related to global angular momentum acting more like a weak El Nino, etc., suggest a warm pattern through mid January for much of the eastern half of the U.S. The drought stricken west will receive feet more snow over the next 2 weeks for skiing and will ease the water restriction situation.
Heavy rains in Argentina breaking the soybean market, tons of snow for the western U.S. are all signs that the atmosphere is not necessarily acting like a La Nina, The AO, NAO and other teleconnections will remain positive suggesting warm weather for U.S. energy areas and little chance for a major rally in natural gas prices over the next couple weeks.
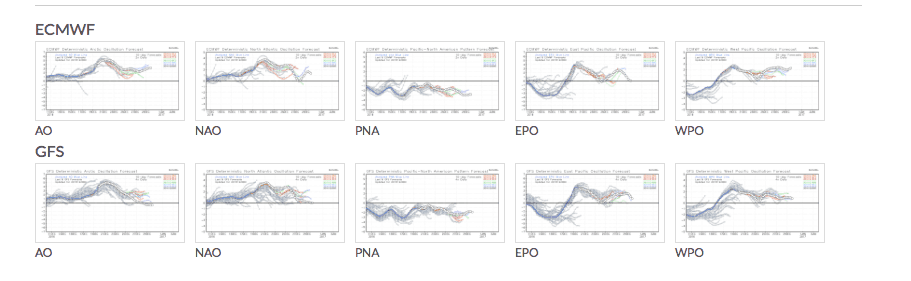
TELECONNECTIONS ABOVE SUPPLIED BY WEATHERBELL, INC.
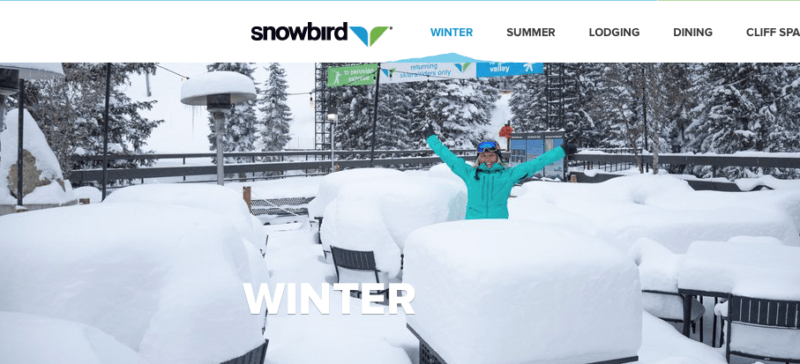
Places to go Skiing through January 10th are places like Snowbird, Utah, with tons more snow coming with 2 more storms around Christmas and then January 5th. The Sierras, Cascades too will see some of the best late December and early January ski conditions in several years.
www.snowbird.com
by Jim Roemer | Dec 5, 2016 | Forecast, Skiing, Strategy, Weather
Some of the best skiing in the U.S. will be across the Pacific Northwest and into places in Utah (Snowbird, Utah), etc. the next few weeks. Several more feet of snow will fall from the Cascades and N. Sierras to the Wastach range in Utah making for improved skiing for December. Cold weather will be the rule across New England well into mid-late December favoring improved skiing across Vermont, New Hampshire and Maine. Should be good skiing in the Northeast for Christmas and possibly 1-2 storms in the next 2 weeks.

