
It all depends on how you look at price. Based on the London gold “afternoon fix” the all time high was on September 5th and 6th (both days) in 2011. That price was $1,896. In the recent run up, the highest London p.m. fix was $1,683.65 on March 6, 2020. When the financial markets took a nosedive in unison, the p.m. fix got as low as $1474 today, March 18th.
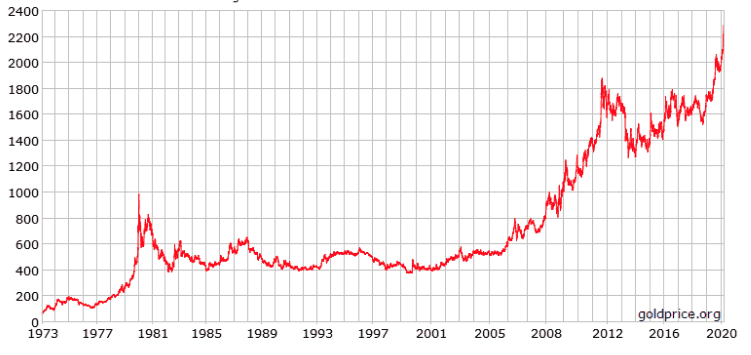
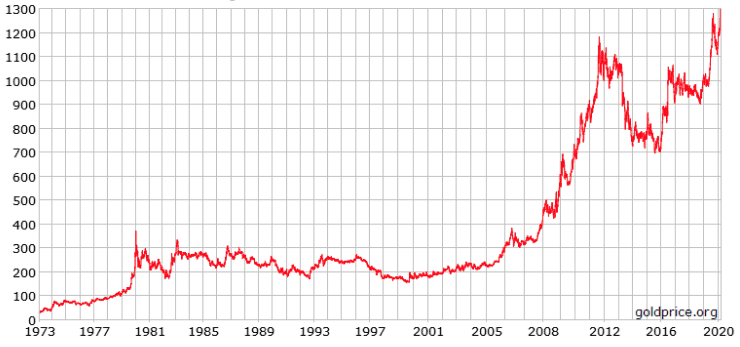
However, if you have the perspective of a currency other than the USD, the picture is different. Accordingly, the charts below show the long term history of gold priced in US Dollars, Canadian Dollars and British Pounds.
The Price of Gold Expressed in Different Currencies

But wait! A currency’s price is in terms of another currency.
How many Rubles is a Shekel worth? One Canadian dollar will cost you how many Australian dollars? How many Rupees would you get for a Peso? I think you get my point.
Normally, the price of gold is denominated in US Dollars per troy ounce. But, if the dollar is not your base currency, that ounce of the yellow metal has a differently stated value. Therefore, because a currency price pairs fluctuate, the historical gold charts differ slightly.
The “apples to apples” rule implies gold’s evaluation can be ounce based, using another precious metal. Consequently, bullion traders and investors have always followed the gold to silver ratio (GSR) and the gold to platinum ratio (GPR).
Apples to apples thinking, means that gold is at its all time high when measured in ounces of silver.
Because silver crashed more than gold crashed, gold ounces increased in value when measured in ounces of silver.
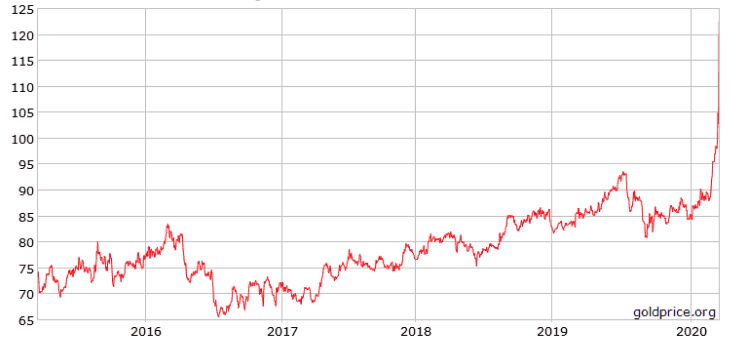
In this month’s market, after the multiple crashes, one ounce of gold is worth over 120 ounces of silver. At the end of 2019 it was 85 to 1. Historically, the jump from 85 to its recent peak of 123.78 is a record for this ratio. Whereas, the chart below shows a much longer time series.
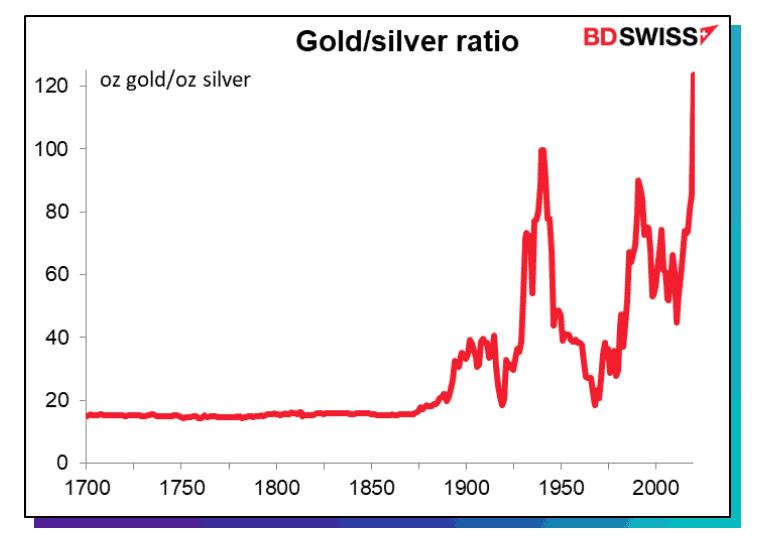
Antiquity
15:1 was the lowest level for the ratio in U.S. history, as it had been legislated into the Mint Act of 1792. The concept is as old as the hills. The Roman Empire had declared a 12:1 relationship for the pair. Three millennia earlier, during the reign of Pharaoh Menes (the first king of Egypt), it was written in hieroglyphics, that 2.5:1 was the GSR. According to Marshall Gittler, head of investment research for BDSwiss Group, the gold/silver ratio is “…perhaps the longest-running price series in financial history…”

Regarding this week’s markets, the conclusion is that gold crashed, or didn’t crash, depending on your point of view. Do we liken apples to apples, or apples to bananas?
Last week (3/8/20) our own Jim Roemer, who publishes this blog, alluded to a possible immanent bullion price collapse. His commodity service and WeatherWealth newsletter focus on weather and climate fundamentals in agricultural and energy markets. Weather does not usually impact metal prices. However, in these volatile times, with the global economic woes rippling throughout the macro-marketplace, everything is connected.
Scott Mathews
A blog that I posted here in 2018 focused on some not-so-obvious ways that the weather can affect markets. One of the examples I wrote about makes a connection between a hurricane and gold.
Interested? Here it is: “Out of the Blue”


