
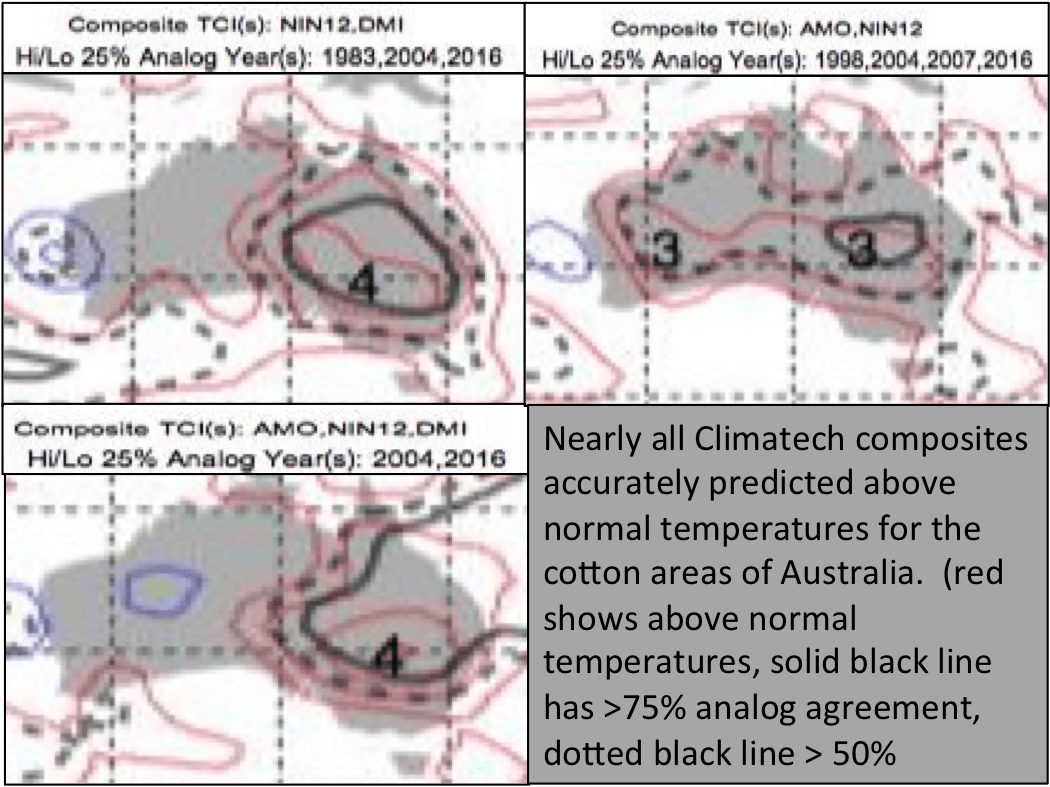
Prolonged heat over the past 5 weeks is forecast to continue into late February in East Australia. Climatech nailed the forecast of these warm temperatures. Climatech has several tools at its disposal that help accurately predict conditions months in advance. Using monthly teleconnection values, with mid-month updates, you can predict future conditions by finding analog years. Typically, we use sea surface temperature teleconnections with this tool, as atmospheric teleconnections are less inert. For example, the North Atlantic Oscillation (NAO) continually switches phase, where as the Atlantic Multidecadal Oscillation usually varies over years. The AMO and Nino 1+2 are currently positive, and the Dipole Mode Index (DMI) has been negative. Several different combinations of these teleconnection-based analogues led to a composite of above normal temperatures for East Australia, including cotton areas. See image below:

IMPACTS ON AUSTRALIA
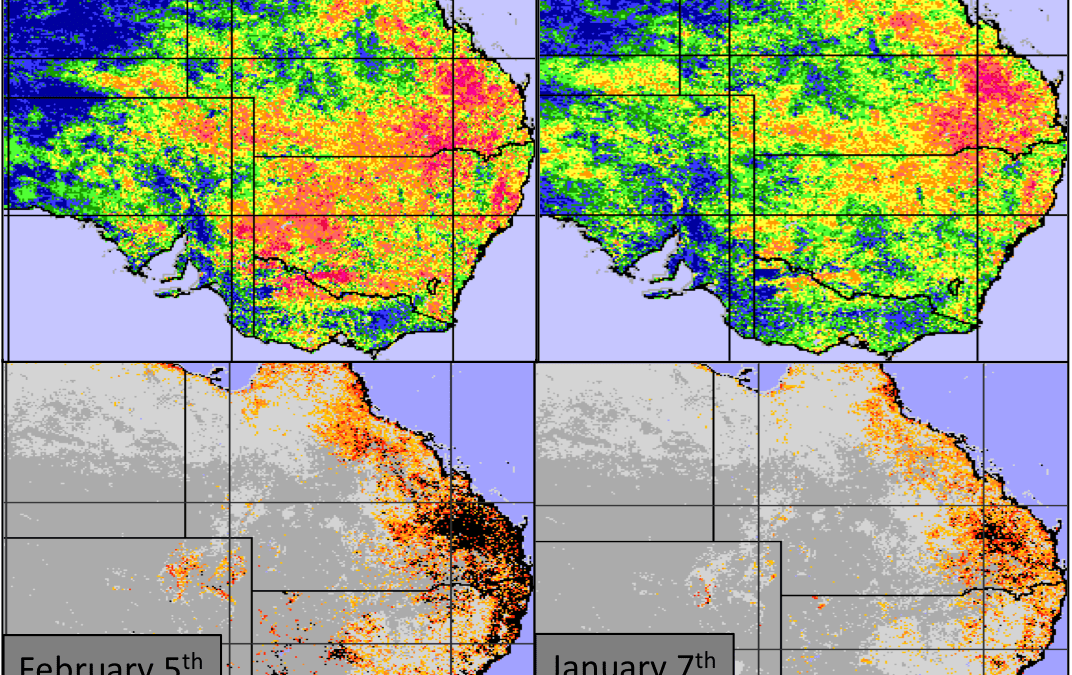
As a result of this heat, air conditioning bills are increasing. Beverage sales could rise. In addition, dry hot temperatures impacted the growing areas of cotton, wheat and soybeans. A change in conditions is observed in the Vegetative Health Index (VHI) values and the Thermal stress indicators from the first week of January to now. The Center for Satellite Applications and Research (STAR) division of NOAA provides these images. The measurements needed to calculate the indices are observed by satellites high above the atmosphere. Red pixels in the top two images indicate poor VHI values, with black pixels representing poor thermal conditions. Most notable are the increase in red pixels over SE Australia over the past month.
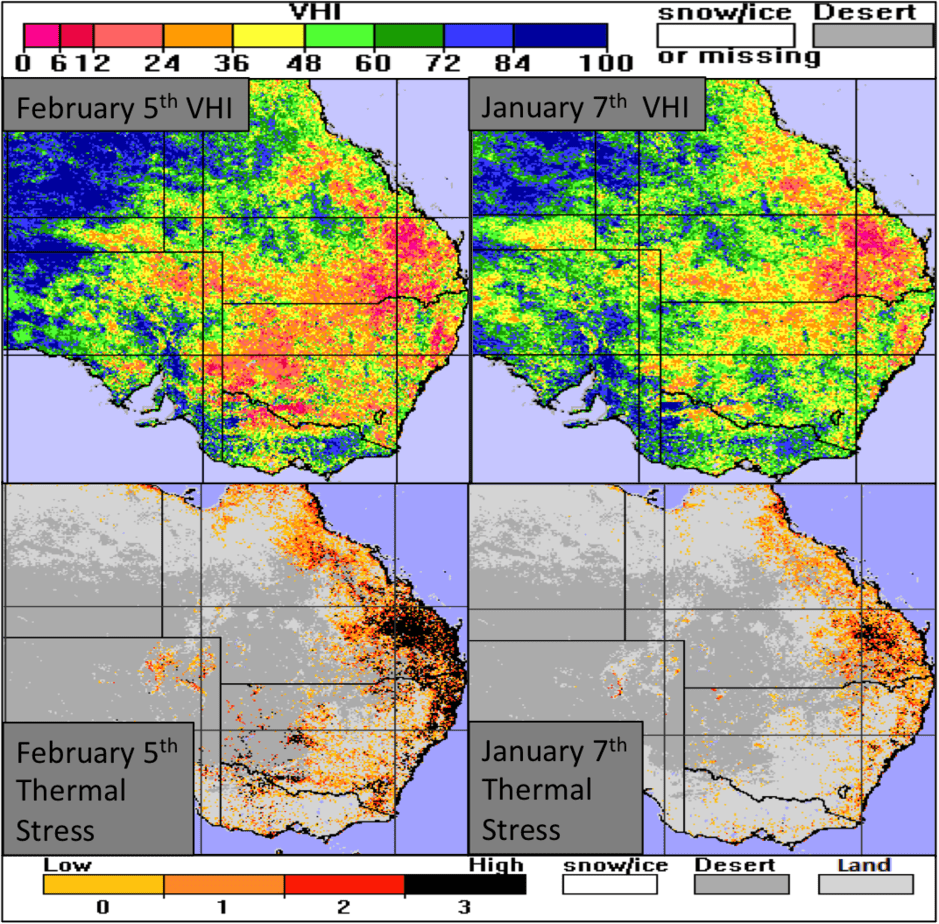
IMAGE CREDIT: NOAA/ NESDIS STAR
So what does this mean for the crop areas? We show years with similar VHI, indicating similar Australia crop conditions: 2016, 2014, and 2013. Cotton had yields near normal (-3%, -1% and +5%, respectively). Although a slight decrease in yields occured in a few of these years, no major crop issues occurred.
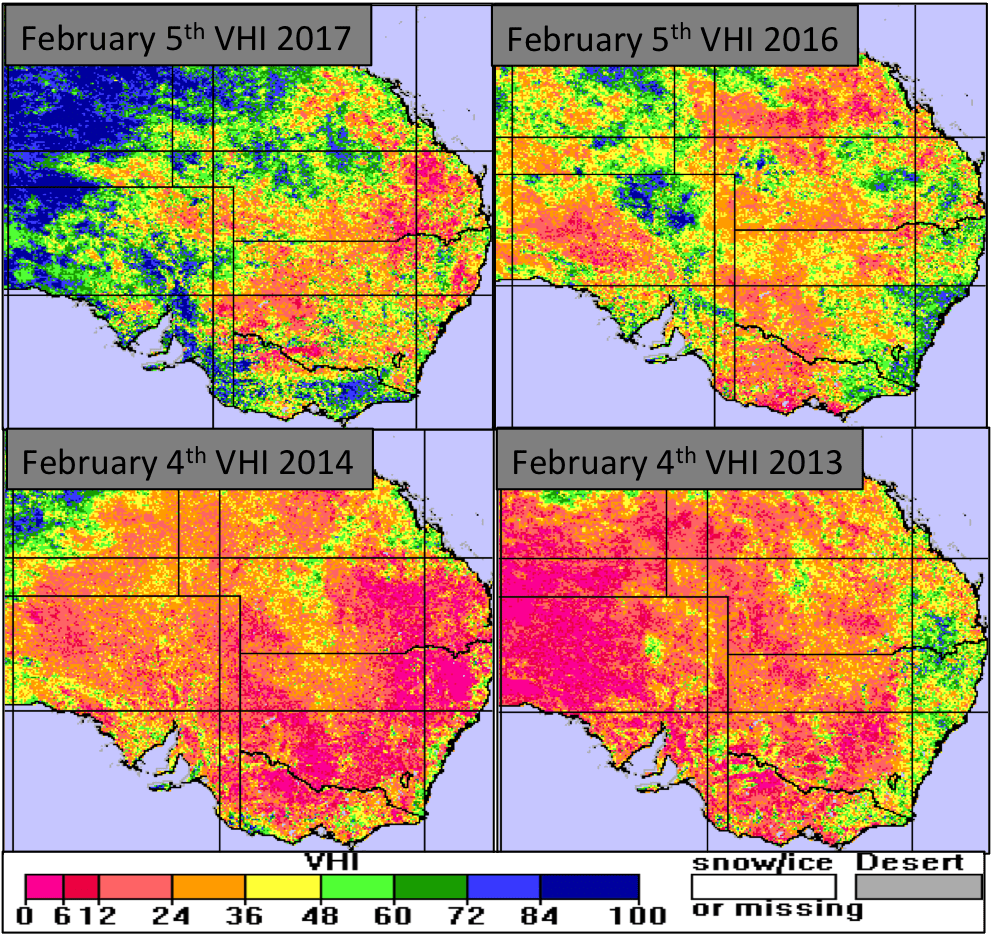
IMAGE CREDIT: NOAA/ NESDIS STAR
Conditions were much worse in 2011 (not shown). However, extreme flooding caused these poor values, not heat. Therefore, less impact is expected on crops in 2017. Moving forward, the next important forecast will be whether or not conditions for soybean, wheat and cotton will be ideal March through May (e.g. flooding during cotton harvest).
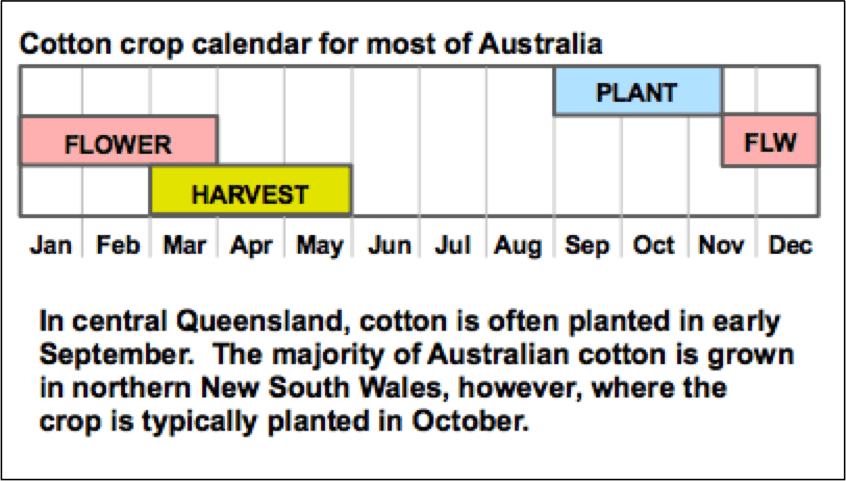
IMAGE CREDIT: USDA
