
A Weak Start To The Indian Monsoon: Its Effect On Commodities
by Jim Roemer – Meteorologist – Commodity Trading Advisor – Principal, Best Weather Inc.
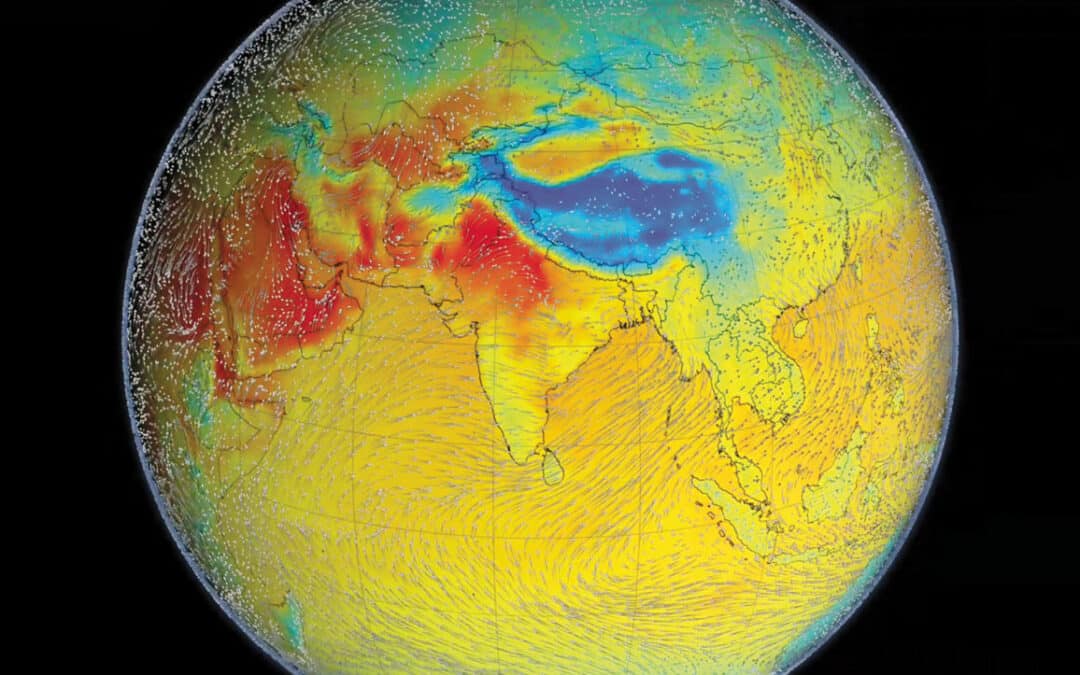
The image above is from Jim Roemer’s latest Weather Wealth Report. If you have not already done so, please feel free to request a two-week complimentary trial subscription here and learn how we use weather to trade futures, options, and ETFs from grains to soft commodities, natural gas, and more. You’ll also get more useful long-range weather forecasts.
Discussion about the Indian Monsoon
Why is the Indian Monsoon important?
India is the world’s biggest producer of sugar, cotton, and pulses (legumes) and the second-biggest producer of wheat and rice. The success of these crops is largely determined by the June-September monsoon, which delivers about 70% of the country’s annual rainfall.
Monsoon’s effects on Indian farmers
India is an agricultural economy, which means most of India’s GDP depends on farm growth and production. More than 50% of the Indian population earns their livelihood through agriculture. Monsoon is one of the most important seasons for farmers in a country so dependent on its agro-industry. Most of the Indian agricultural land is irrigated by the southwest monsoon. Crops such as wheat, rice, and pulses, are staples in Indian diets. They need heavy rainfalls to grow. Rubber trees in the southern region require heavy and regular rain with high temperatures.
A look at the history of floods vs. droughts in India
The above image shows total summer and autumn rainfall from 1970 to 2015 (I did not include the last six years of the Indian Monsoon). Notice, historically, that during La Niña events (blue stars) there is a much greater likelihood of some flooding than droughts in India. In contrast, during certain (not all) El Niño events, drought tends to be the rule.
One of the most significant market-impacting drought years that I experienced and can recall, was in the summer of 2009. Back then, flooding in Brazil, combined with a severe drought to sugar cane and some cotton helped sugar prices soar.
Regarding big flood years, the one that stands out most in my mind was the La Niña of 2010. The impact was actually greater on Pakistan’s cotton production than anywhere else. That year, there were droughts to global wheat areas in Russia and a historical move to over $2.00 in cotton on La Niña-related problems.
The Indian Dipole is going negative: What are the potential Indian Monsoon impacts given the present La Niña?
“Down the road” I will discuss more about the Indian Dipole and describe what it is. However, two potential analog years I am looking at that had a weak summer Indian Monsoon (below normal rainfall) were 1962 and 1996. These two years were the exception to the rule, as usually, La Niña means good Indian crops or some flooding, but not drought.
However, a negative Indian Dipole and La Niña can result in the Indian summer heat and some reduction in either cotton, sugar, or ground nut crops.
Notice, for example, one of my favorite analog years (1996) that resulted in the Plains wheat drought and explosion in wheat prices until harvest (late May and June–when prices began to collapse). This particular year had a weak Monsoon and a relatively dry Indian summer for more than 50% of their croplands.
How the Indian Monsoon can influence Q4 gold demand
Amazingly, yes, how much rainfall hits India and affects millions of Indian farmers has a direct effect on gold prices prior to the “wedding season” which lasts from late October to mid-January. Gold plays a significant role in Indian weddings, which number 10 million per year. I will elaborate on this in a later article about how a great Monsoon gives millions of Indian farmers additional income to buy wedding-related gold items. Droughts, on the other hand, have the opposite effect.
The image below is from my in-house long-range weather forecast application, Climate Predict. For free, readers can access this program at www.climatepredict.com The screenshot suggests the following rainfall trends for the rest of June. This is based on what we call an “east-based La Niña” and also the negative Indian Dipole as well as other phenomena.
So, how does an investor (or a hedger) trade grains and soft commodities by incorporating the potential weak Indian Monsoon and global La Niña rainfall trends for June and into summer?
That is where we come in with our Weather Wealth newsletter.
Thanks for your interest in commodity weather!
Jim Roemer
Weather Wealth & Climatelligence
Mr. Roemer owns Best Weather Inc., offering weather-related blogs for commodity traders and farmers. The Weather Wealth blog, including short/long term forecasts and trading ideas, are accessed at https://www.bestweatherinc.com/
He also is co-founder of Climate Predict, a detailed long-range global weather forecast tool. As one of the first meteorologists to become an NFA registered Commodity Trading Advisor, he has worked with major hedge funds, Midwest farmers, and individual traders for over 35 years. With a special emphasis on interpreting market psychology, coupled with his short and long-term trend forecasting in grains, softs, and the energy markets, he established a unique standing among advisors in the commodity risk management industry.


