
The maps and discussion below portray a potentially dire situation for the Brazil soybean crop over the next 1-2 months. A La Niña type drought is developing in southern Brazil and possibly Argentina, while the northern part of Brazil remains too wet in some areas. That can cause issues later. It’s important to receive the right timely weather information ahead of the crowd and to gauge market psychology for any changes.
You can subscribe to my YouTube channel here
l
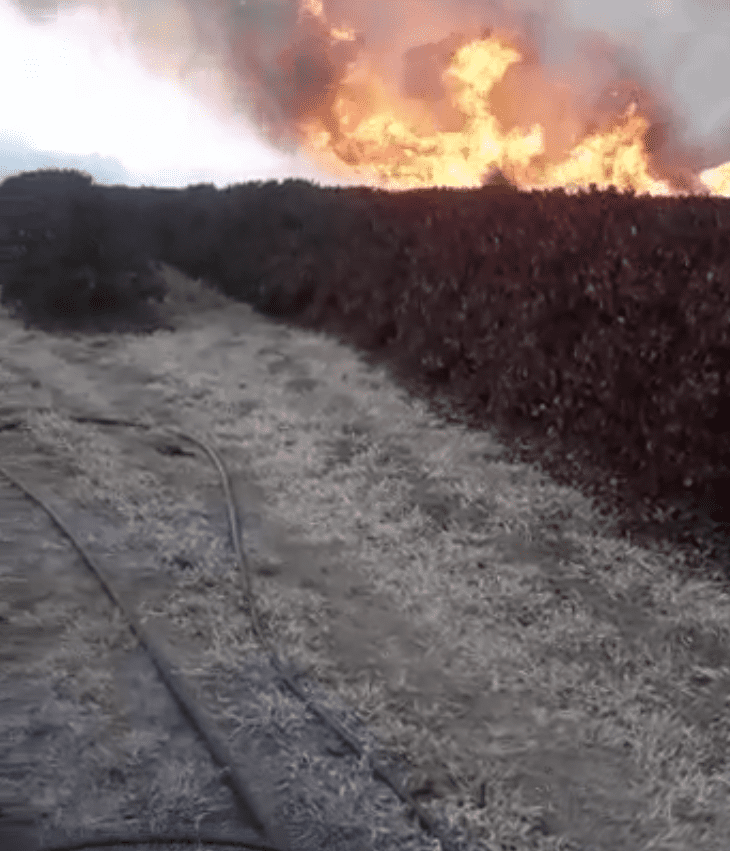
The fires in the photo above show the impact of the historical dryness that hurt the coffee crop earlier this year. Now droughts have been replaced by floods. Which commodities will be most affected – and how do you trade this? Find out here
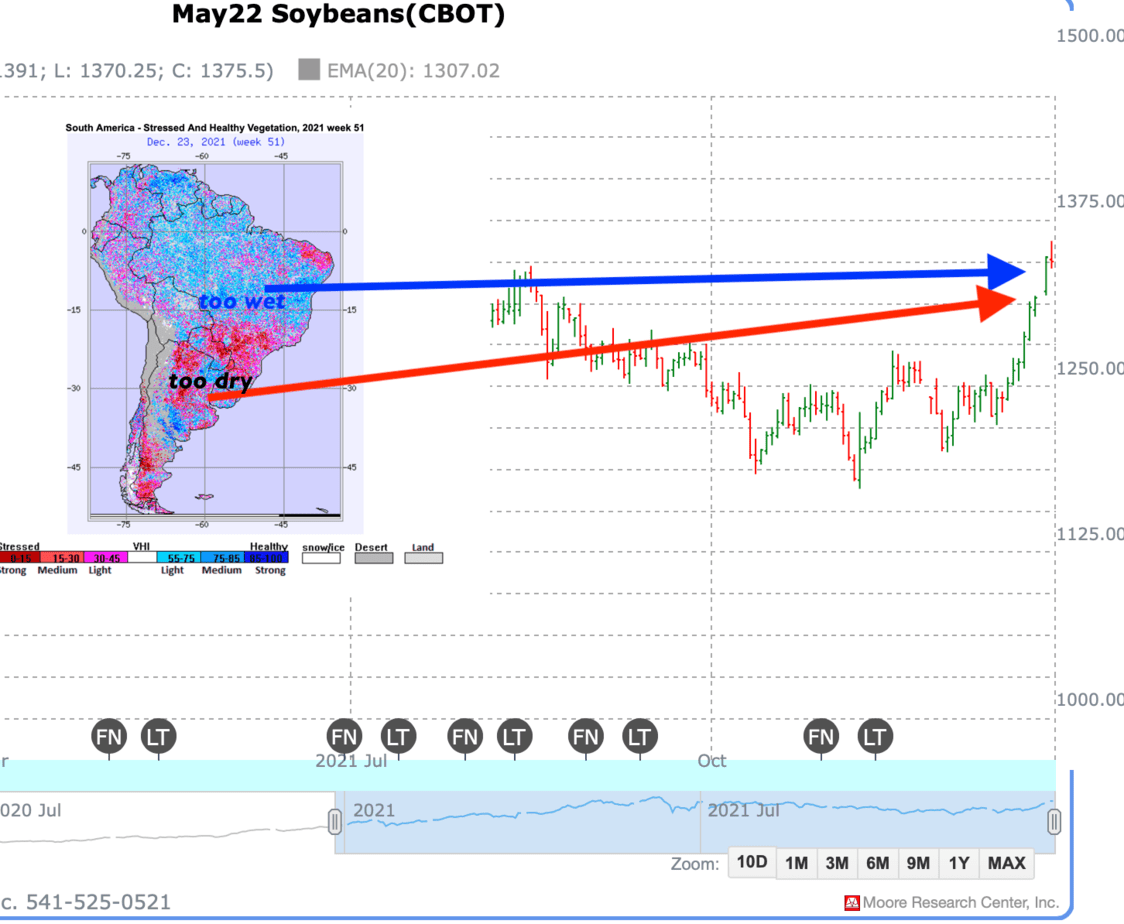
Two weeks ago, I called the spike in soybean for my clients, due to the weather problems shown below. How high I think prices will go will depend on my forecasts. Updates in the weeks ahead.
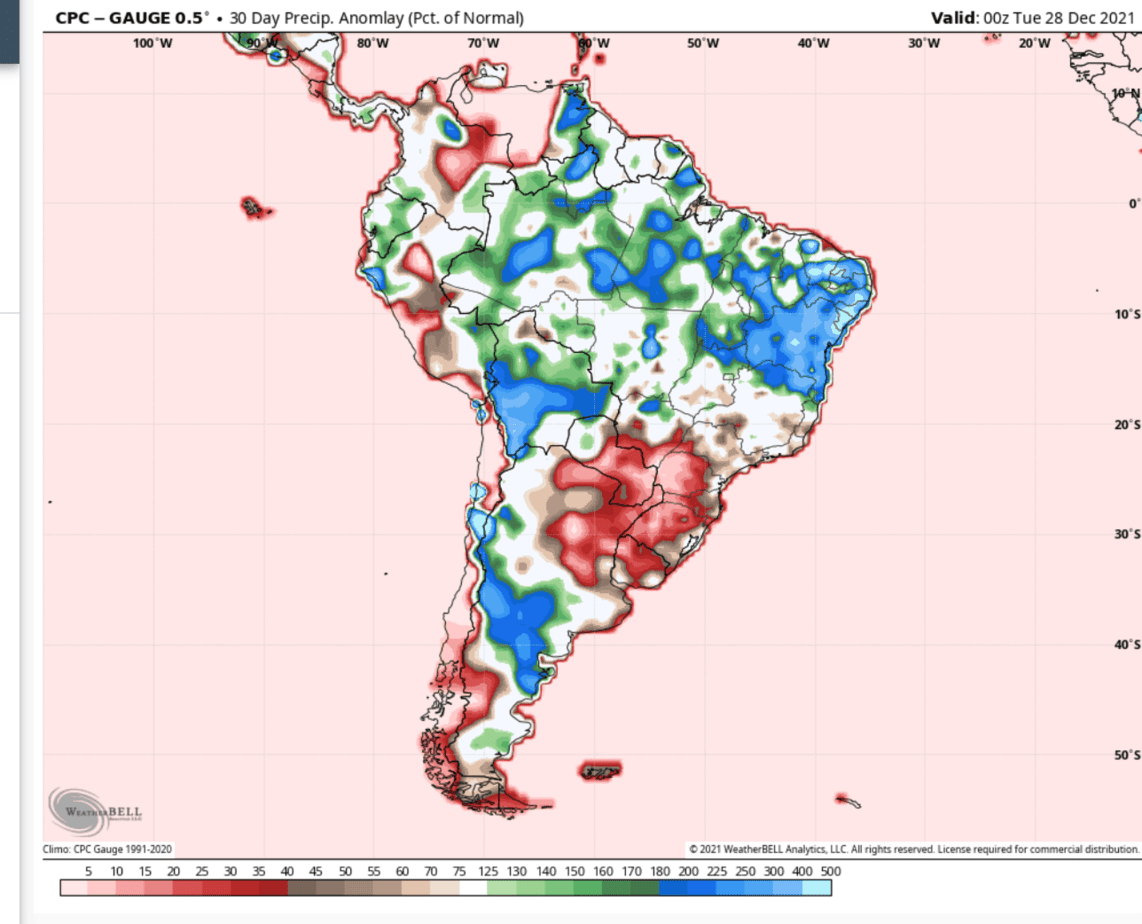
The map above shows the percentage of normal rainfall the last 30-40 days. Notice parts of Brazil are getting too wet in the north (blue) but too dry in the south (red).
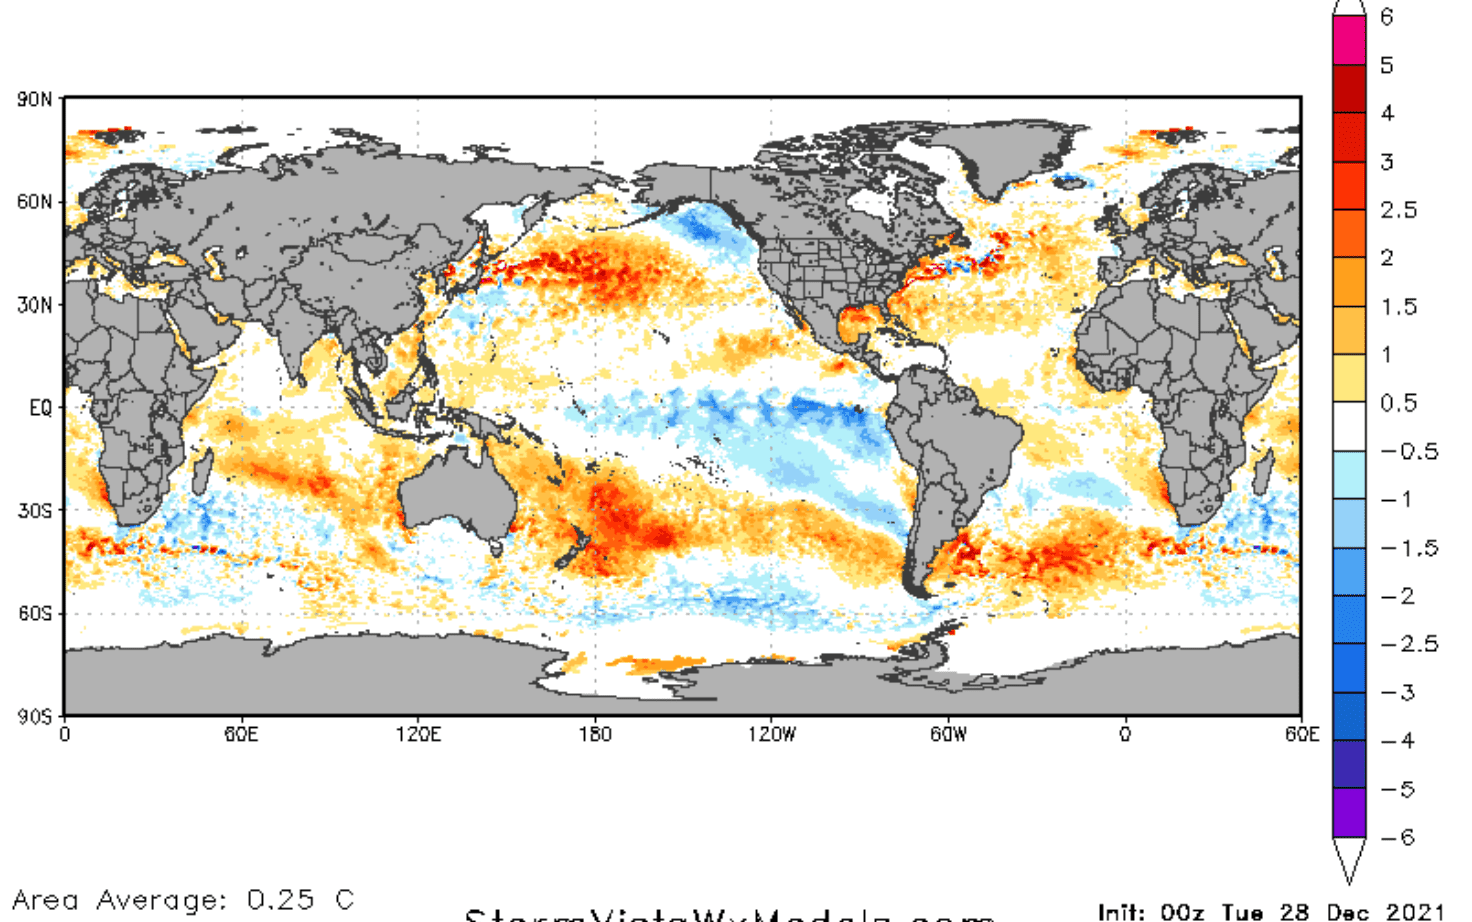
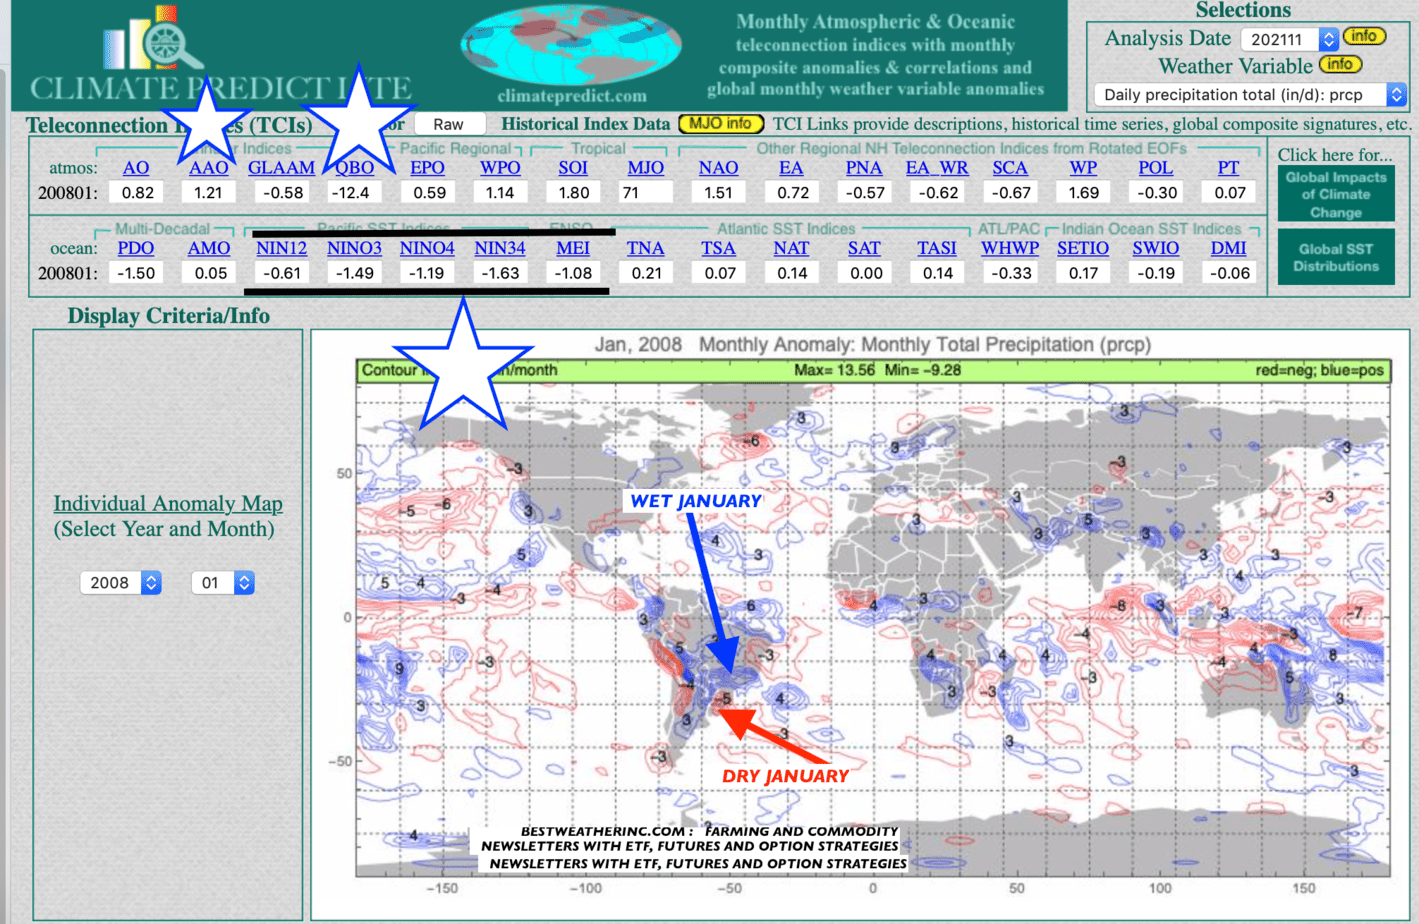
On the map above, notice the blue colors in the equatorial Pacific. This is a full-fledged moderate type of La Niña (standard, not Modoki).
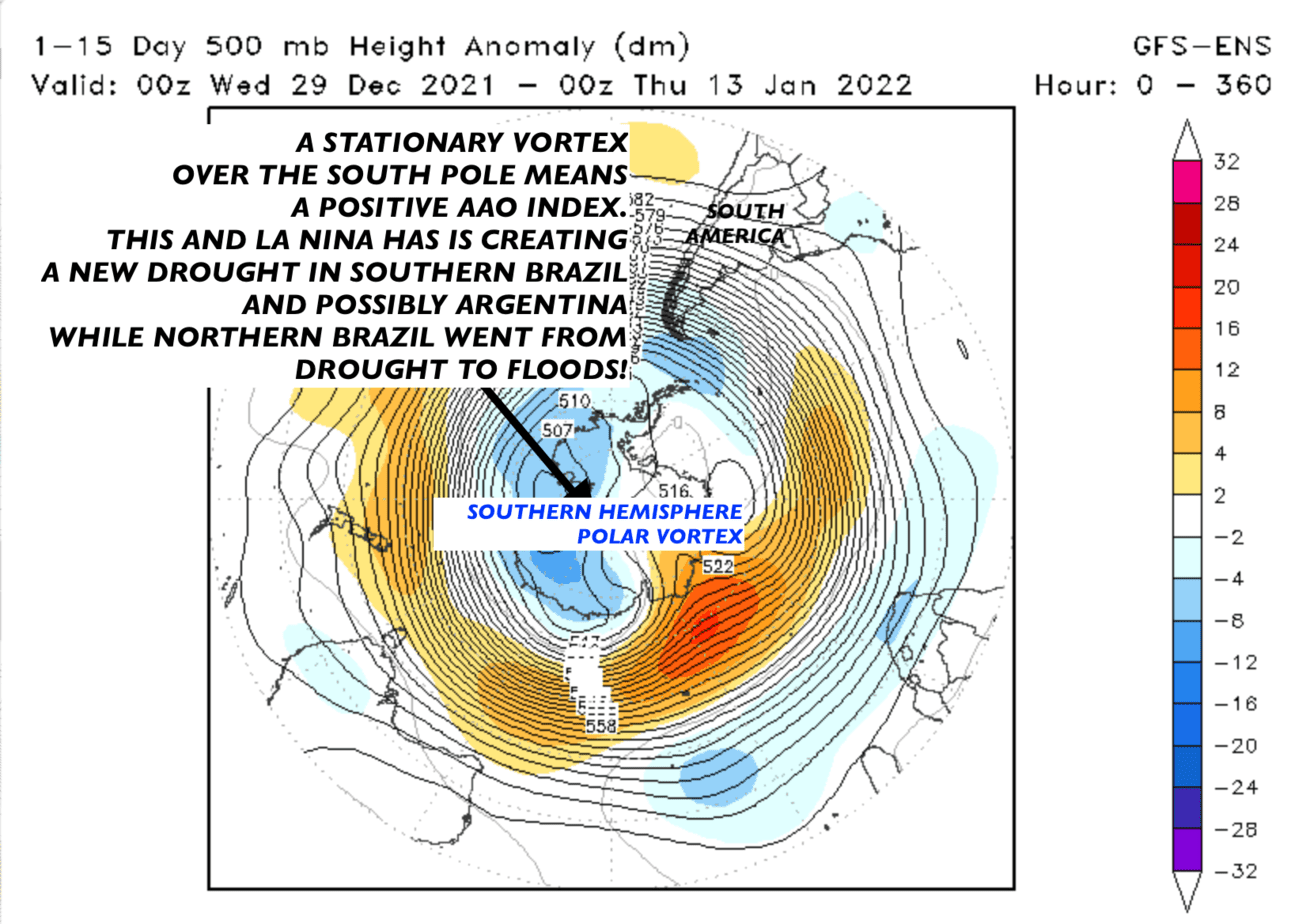
Shown above is the positive AAO index plus La Niña. These are two of the reasons why weather problems should continue through July for some South American crops.
My ClimatePredict weather software shows what happens in January with a +AAO, warm Atlantic Ocean coupled with La Niña. I use teleconnections around the world to out-forecast other weather firms and most models.