
Sugar prices rose near 50% in 2016 as the global deficit continued into its second year. India did not have the recovery in rainfall that most had hoped following an El Nino. The stocks/usage ratio dipped below 19% (ratio indicating percentage of global stocks compared to global consumption). But now, the outlook is bright. Brazil is about to harvest a bumper crop. Producers will process more sugarcane into sugar, rather than ethanol due to ethanol’s low prices compared to sugar. Demand for sugar snacks has also been waning, with Americans picking up more granola bars than candy bars. All of these paint a prettier picture for the supply/demand balance.
Historical Sugar Price Reversals
The image below shows the monthly sugar price versus the yearly stocks to usage ratio. We sent this to our clients back in October about our bearish stance. Typically prices peak during the winter months, after poor Indian/Thailand harvests are realized. Supplies are tight for the winter when stocks/usage ratio is below 19%. However, the prices usually fall when confidence in good Brazil production is realized. This occurs after the peak in the rainy season (Jan-April).
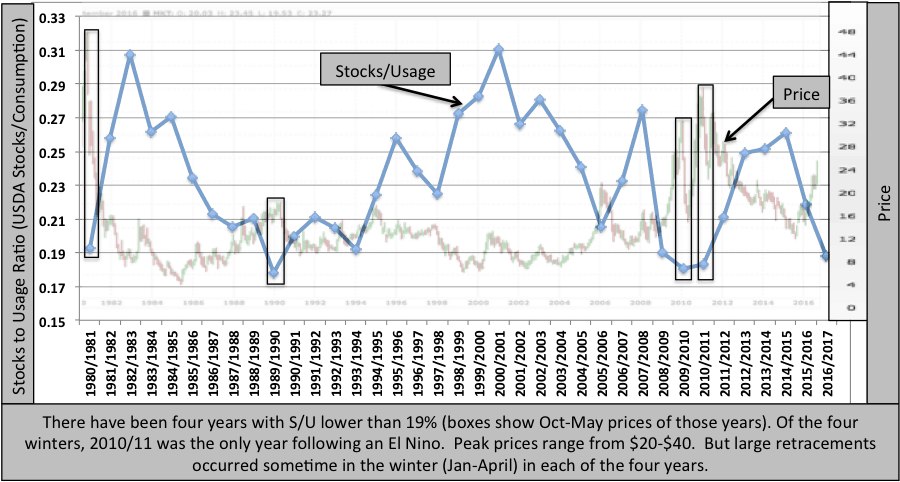
Data Source: https://apps.fas.usda.gov/psdonline/app/index.html#/app/home
Moving forward, traders will be watching the progression of the Indian Monsoon. A +Nino 3.4 usually leads to below normal rainfall in the summer, as occurred in 2009. The ENSO models currently give a good shot of an El Nino forming for next winter. The main question we are answering for our clients: Will it develop quickly enough to negatively impact rainfall in India? We are working on research right now to determine whether or not the sugar deficit will continue.
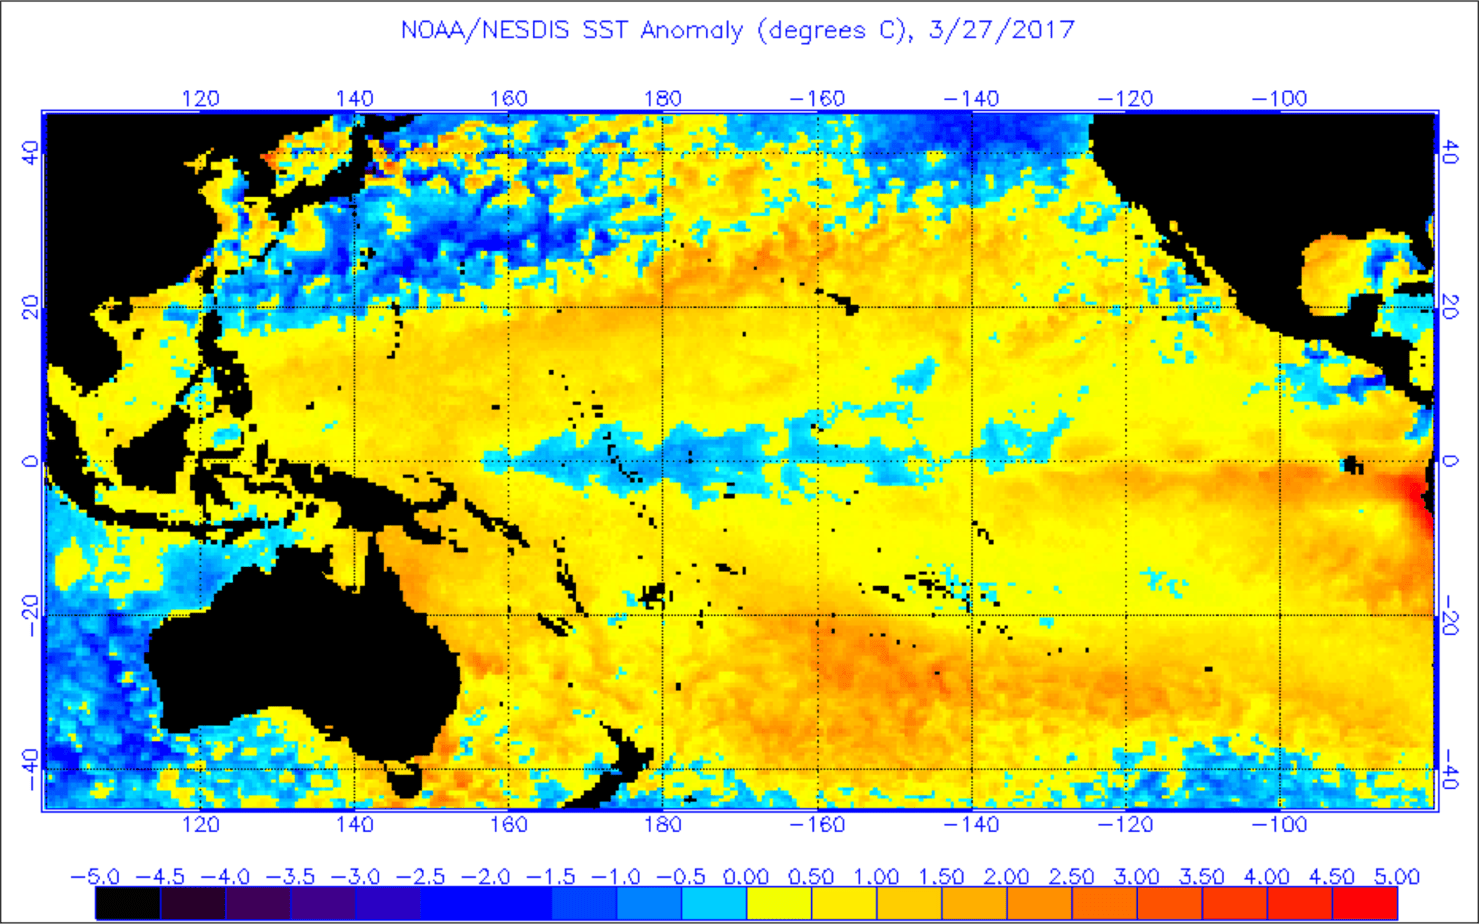
Source: http://www.ospo.noaa.gov/data/sst/anomaly/2017/anomnight.3.27.2017.gif


