
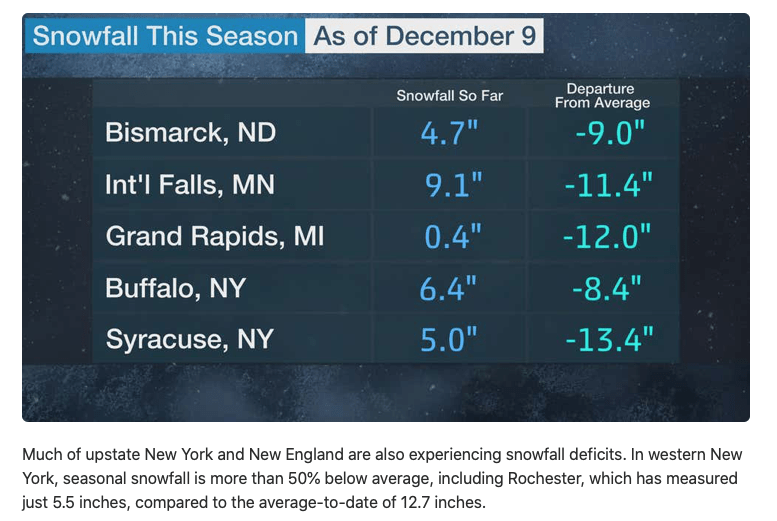
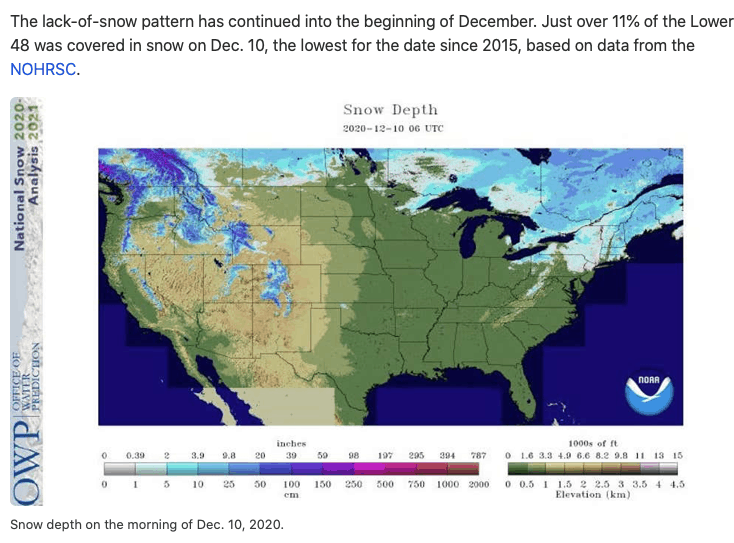
The Present US Snow Drought:
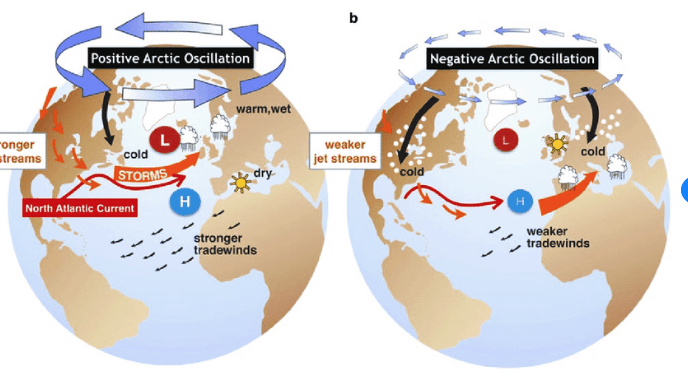
In other words, the snow drought is due in part to the warming Arctic and positive AO index (3rd map down to the lower left)
In no uncertain terms, the Arctic Oscillation Index is a key teleconnection for winter weather. Therefore, due to complex global weather variables, the index has been positive since late this autumn. For much of the United States, this is resulting in one of the warmest Novembers and Decembers on record.
The image to the upper level reflects how the AO index has been much of this fall.
Snow Will Begin To Increase as the AO goes more negative:
Markedly, the index is beginning to become more negative for the first time in months (image to the upper right). Consequently, energy traders will be watching whether this trend continues. However, in the short-term, there will be a few snow events over the Southern Plains and then the Northeast.
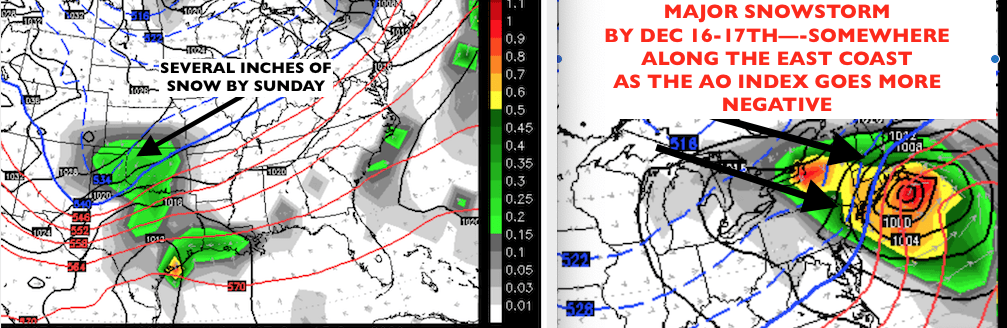
Yet, the AO index will go negative shortly, but no major extreme cold is likely in most US regions. Nevertheless, the map to the left shows up to 2-5″ of snow across southern Kansas into Oklahoma this weekend. For example, the map (above right) shows a potential Nor’easter. As a result, the storm may bring 6-12″ of snow by December 16-17th to upstate New York and parts of New England
By the way, where you should go skiing this winter? Who will have a white Christmas? Will the US snow drought end? Why have we been bullish on wheat futures for months? What is our short and longer-term view in commodities based on weather? Click on the images below. For just $13 you can get our latest CLIMATELLIGENCE REPORT
You can’t do anything about the weather, but for just $13 you can make money from it.
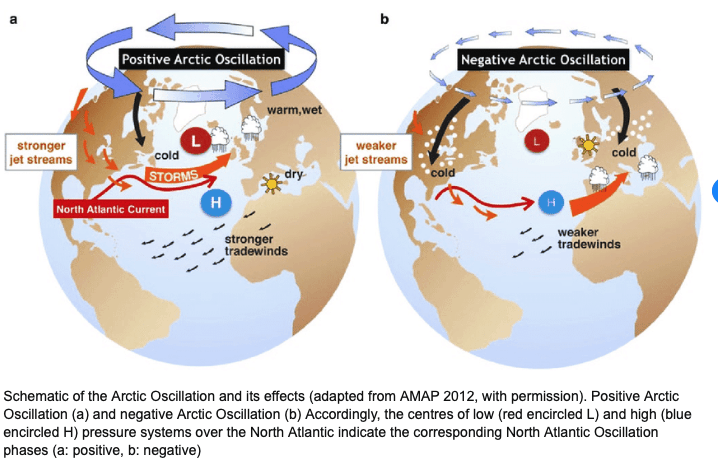
The Melting Arctic and Arctic Oscillation Relationship:
As the term Arctic Oscillation Index” implies, the Arctic is warming more than twice as quickly than the global surface average. This phenomenon is known as “Arctic amplification”. In part, this stems from the rapid loss of sea ice cover in the region. In fact, as Arctic sea ice diminishes, the sun’s energy is not reflected away by the bright white ice. Instead, it is absorbed by the ocean, causing further warming (declining snow cover over Arctic land areas has the same effect.)
Notwithstanding, the idea of a link between Arctic conditions and mid-latitude weather goes back a long way. Prof James Screen, an associate professor in climate science at the University of Exeter, says some of the earliest research on the topic was published by Swedish meteorologist Professor Hugo Hildebrand Hildebrandsson in 1914 and Russian oceanographer Wladimir Juljetitsch Wiese in 1924
For example, the earliest modeling study to investigate the links between sea ice and winter weather in the US and Europe could be a 1978 paper in the Monthly weather review by a pair of NASA scientists. The study used an early climate model to show that sea ice changes are “capable of altering local climates in certain regions of the high and mid-latitudes”.
CONNECTIONS
Similarly, and expanding on this concept, In 2005, Dr. Judah Cohen, director of seasonal forecasting at Atmospheric and Environmental Research (AER) authored a paper that proposed direct connections among climate change, declining Arctic sea ice and different phases of the Arctic Oscillation.
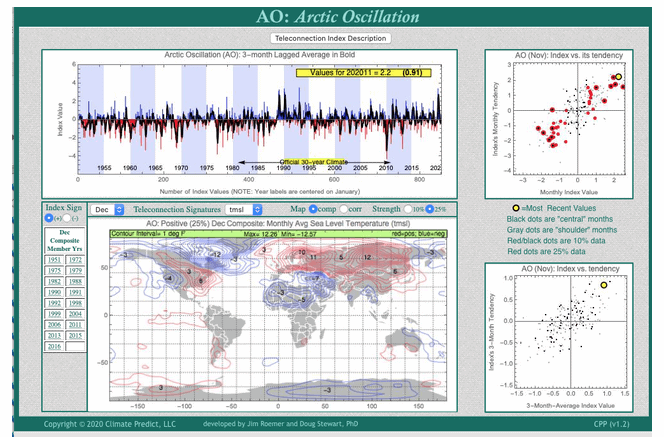
Notably, the warming Arctic last fall caused stronger winds at the North Pole. As a result, this has kept the polar vortex well to the north. The above image is from Climate Predict, our proprietary analytic forecast program. Weeks ago, it predicted a warm (red) late fall and early winter. Since then, natural gas prices have collapsed. Logically, this was related to projections from my program of the Polar Vortex staying mostly over northern Canada and the North Pole (a positive AO index). For convenience, we’ve listed (on the left) all of the analog years that had positive AO events.
Pay Attention!
Keep your eye on what happens with La Nina and the AO index in the months ahead. Consequently, this will have a huge effect on everything from grains to natural gas and “soft commodities” (coffee and sugar). For instance, there are some signs that the AO index (Arctic Oscillation Index) will begin to turn more negative deeper into December and January. However, because of melting sea ice the odds of consistent major cold weather is probably not in the cards for at least the first half of the US winter.
Jim Roemer
