

The global atmospheric angular momentum (GLAAM) index is simply the total rotation of the atmosphere compared to the Earth’s surface. Typically, El Nino years lead to positive GLAAM values and La Nina years lead to negative GLAAM values. When you have both in phase, El Nino and La Nina weather patterns are amplified. However, we currently have + GLAAM and a weak La Nina Modoki (west-based La Nina).
http://www.jamstec.go.jp/frcgc/research/d1/iod/e/elnmodoki/about_elnm.html
This is an odd occurrence, with the atmosphere “acting like” an El Nino, and sea surface temperatures indicating a La Nina. We believe this is one of the reasons contributing to the tough winter forecast this year, as well as the constant pattern shifts. However, more than a week ago, we began telling clients that this January could end up being a warm one nationally and natural gas withdrawals would decrease.
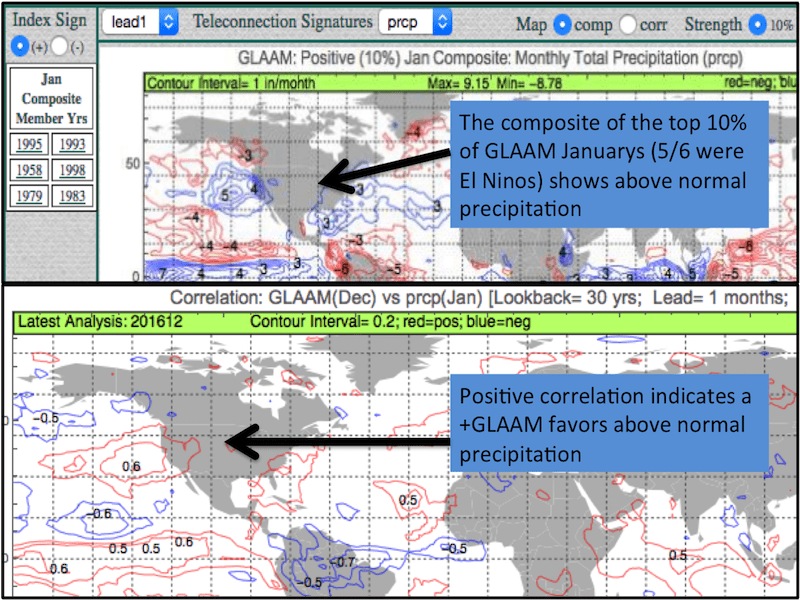
A +GLAAM also favors the record, damaging rains we’ve seen in California and Nevada over the past week. With +GLAAM in January, Climatech composites and correlations accurately predicted this wet weather pattern. Emergency managers are ‘all hands on deck’ in the valleys with flooding roadways and dangerous mudslides: https://www.youtube.com/watch?v=i26_tWxSCLA All the while, snow lovers are chomping at the bit to ski/snowboard near record mountain snows. Mammoth mountain received 82” over just the past 10 days!
Shown below are the composites (blue indicates above normal precipitation) and correlations (red indicates a positive relationship) from Climatech. Notice most years with a +GLAAM were El Nino years, unlike this year.
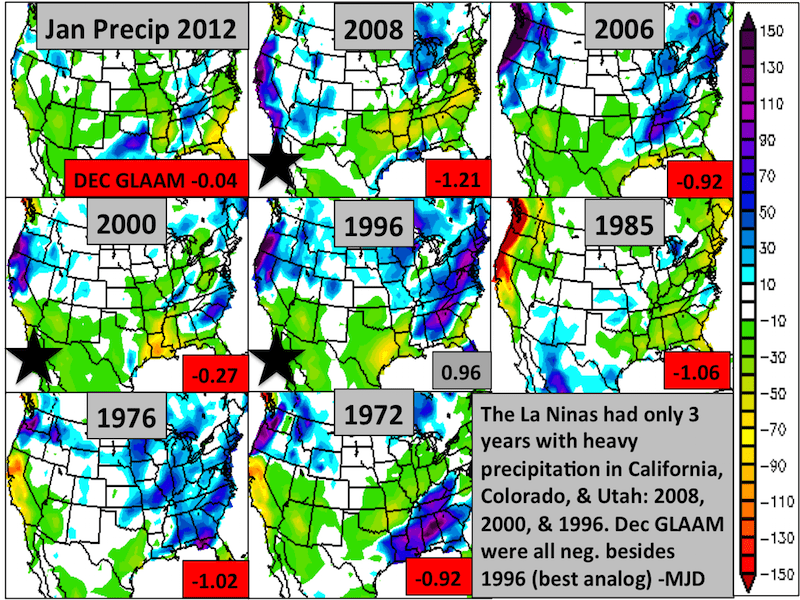
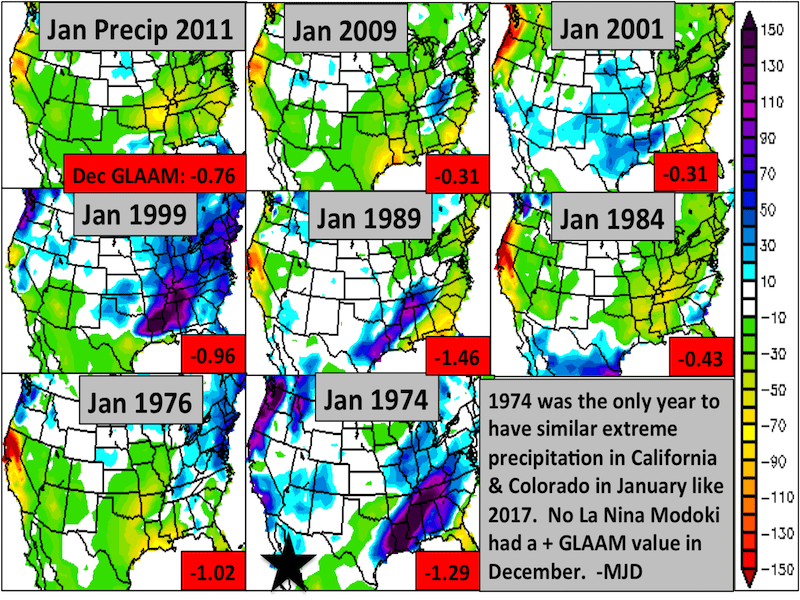
The question is, can we use these conditions to find good analog years? Meteorologists use analogs to forecast future weather. The theory is that similar initial conditions (e.g. strong pacific jet) or boundary conditions (e.g. sea ice extent, snow cover) will lead to similar conditions down the road. Only 4 La Nina years had similar rain/snow in January: 2008, 2000, 1996, & 1974, with 1974 being the only La Nina Modoki. 1996 was the only La Nina year which had a +GLAAM in December.
The images below show January precipitation patterns during La Nina and La Nina Modoki years. December GLAAM values are also shown.
The analogs below are based on +GLAAM, a weak La Nina and huge snows out west have some colder risks, later this winter in the North and East. However, a warmer Atlantic and a lack of snow cover may mean warmer risks at first.
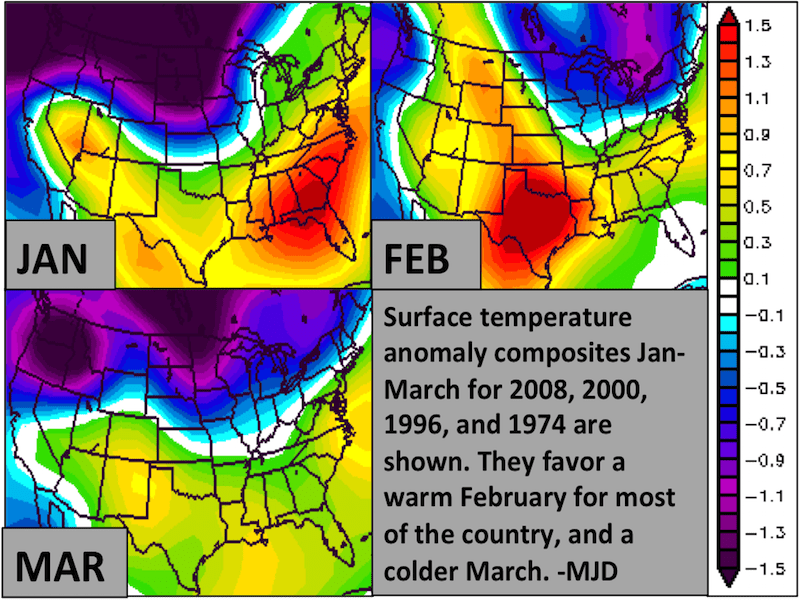
Although not perfect (January will end up warmer), these analogs somewhat agree with the forecast we have given our clients. This is a decent example of how analogs can be used in energy and agriculture weather forecasting, making Climatech an invaluable tool. In 3 of these 4 years, U.S. natural gas areas turned quite cold later in February and March, but odds remain high for warm weather until at least early February.


