ENERGY COMMODITIES
SAMPLE REPORTS #3
ENERGY COMMODITIES
SAMPLE REPORTS #3Natural Gas & Commodities
December 4, 2019
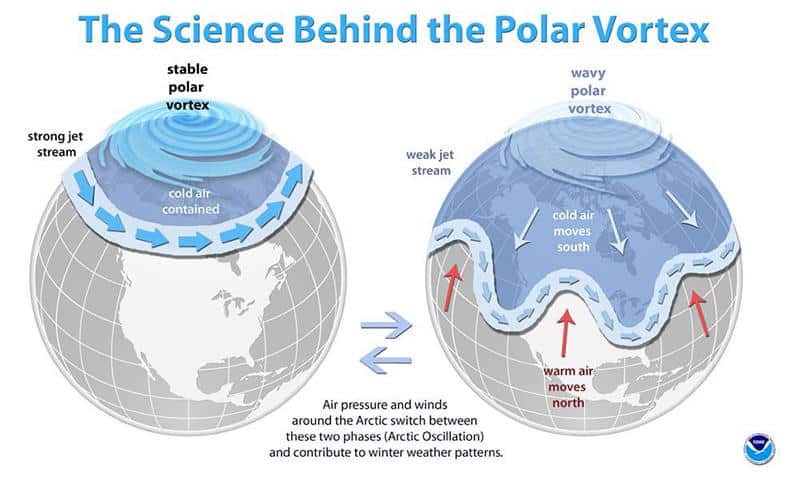
LOWEST ARCTIC SEA ICE IN YEARS AND THE IMPORTANCE OF A POLAR VORTEX FOR NATURAL GAS PRICES
I have received numerous questions around the world from natural gas producers, hedgers, traders, and even some pipeline operators, what my official long-range weather forecast is for the northern hemisphere winter.
In the meantime, as of this writing (November 12th), some energy traders are baffled as to why natural gas prices have sold off 10% this week, following a stellar early November bull move on extreme US cold. However, prices should be rallying back again soon due to the ongoing record cold and some suggestions of a return to cold late November weather.
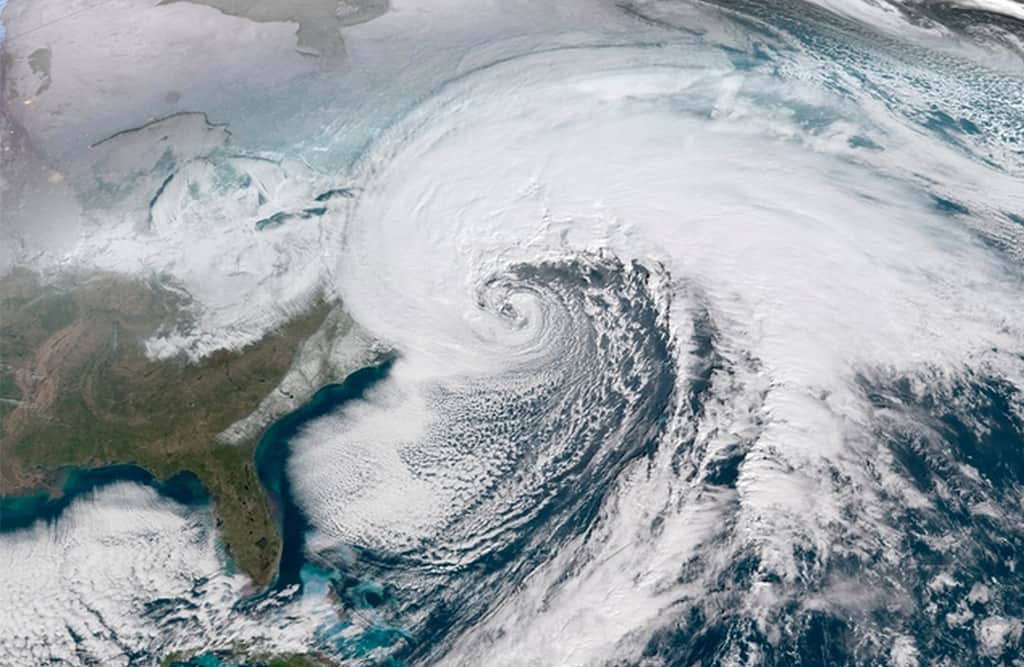
The graphic of the Polar Vortex at the top of this page helped create a major short-covering rally in natural gas prices a week ago. However, record low sea ice and other climatic factors will be easing the US cold deeper into November and one reason why prices sold off earlier this week. Nevertheless, weather maps still suggest some cold late November weather in the eastern US and the recent cold may inspire a friendly EIA number this week. Hence, without major prolonged warm weather, natural gas prices will remain volatile.
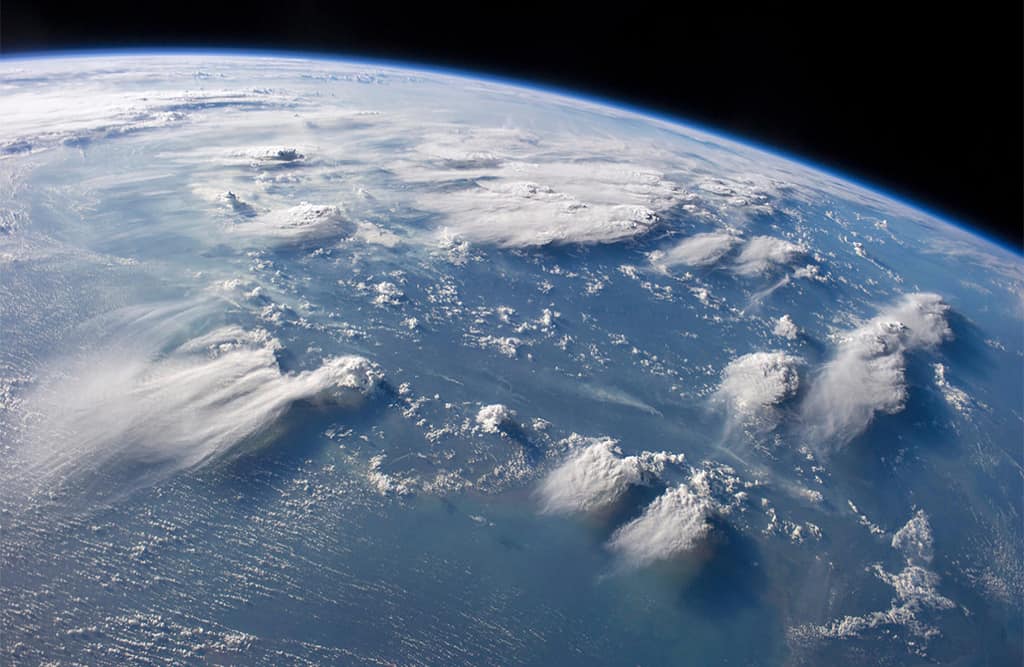
Arctic sea ice is one of the most dramatic indicators of the changing climate. Ice cover on the Arctic Ocean is in some months about half what it was decades ago, and its thickness has shrunk, by some estimates 40 percent.
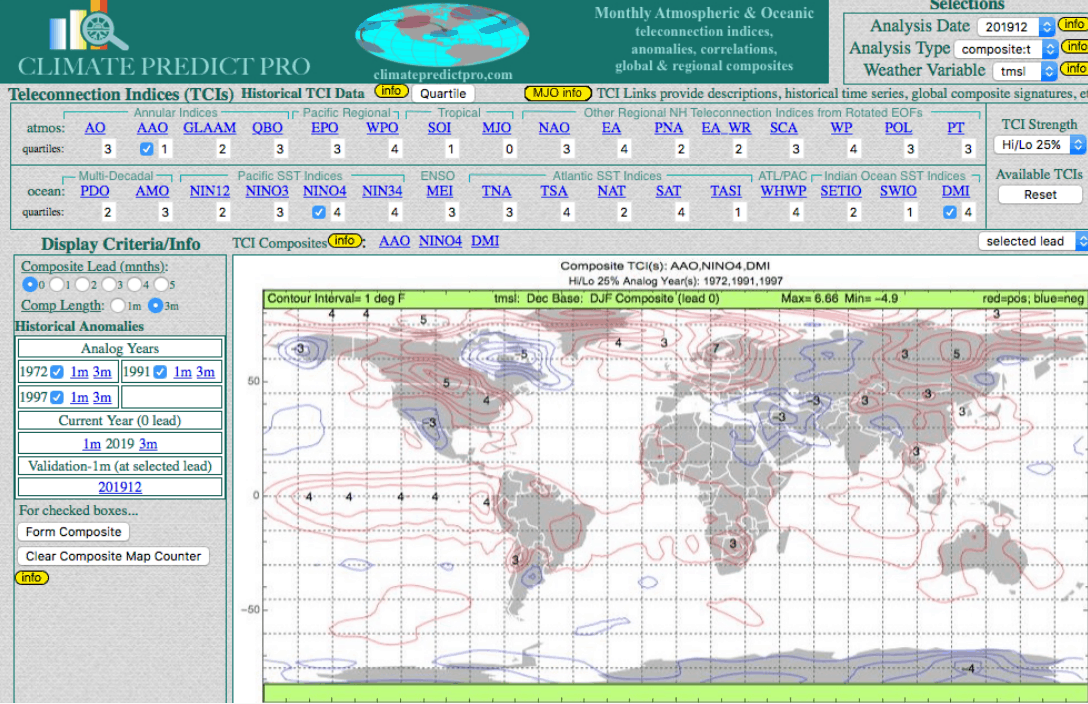
Most of my research suggests a warm winter for the United States’ natural gas areas. This is based on low Sea Ice, the possible lingering effects of El Nino and my Climate Predict program, below⇓
TRADE OF THE MONTH
(Dec. 4, 2019)
⇓ GOLD MEMBERSHIP ONLY ⇓
My bias is to sell natural gas. The conservative route is to buy the inverse short natural gas ETF (DGAZ) if you are unfamiliar with futures trading.
Also, buying a February put option in natural gas, expecting a downward spiral may be another good idea.
RESULT—Prices by early February 2020 dropped almost 50% in natural gas.
WeatherWealth
With Jim Roemer
2 week free trial
• Weekly global commodity weather and crop outlooks
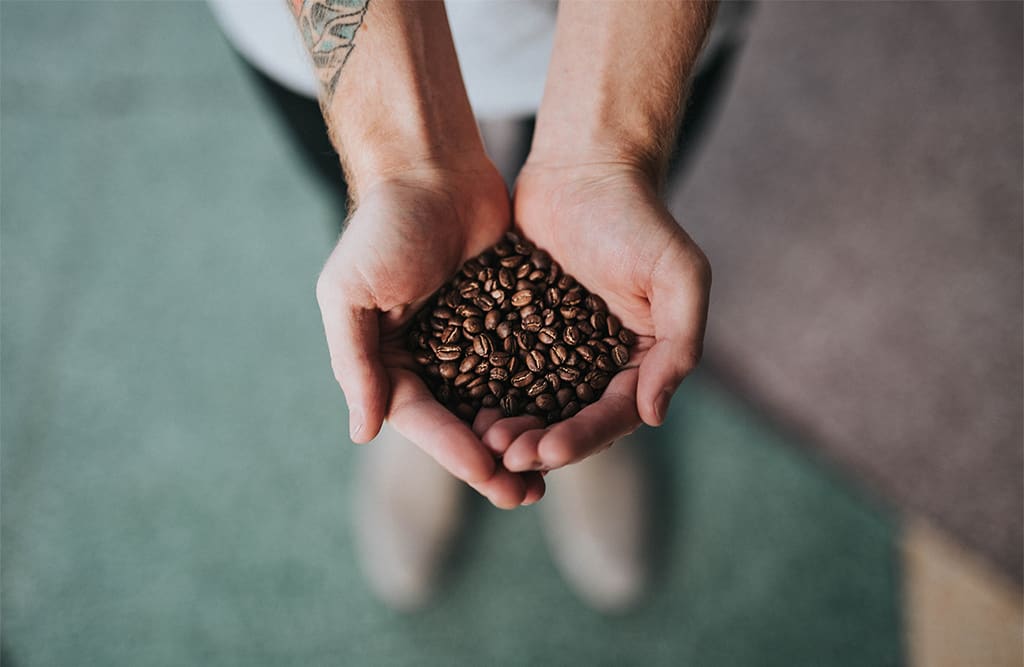
• Weather Trade of the month recommendation for either coffee, corn, soybeans, natural gas or one other market
• Detailed information on how global weather may affect commodity prices
• Email Jim Roemer (one question a month) about your market position
• Encompassed crop analysis and special weather maps from around the world
• CLIMATE PREDICT long-range weather forecasts used by major hedge funds and commodity traders
• Grain, Soft and Energy Commodities—Know before the crowd where the weather extremes will be
Table Title
Subtitle goes Here- This feature is included
- This feature is included
- This feature is included
- This feature is included
- This feature is not included
- This feature is not included
Table Title
Subtitle goes Here- This feature is included
- This feature is included
- This feature is included
- This feature is included
- This feature is not included
- This feature is not included
2 week free trial
• Weekly global commodity weather and crop outlooks
• Weather Trade of the month recommendation for either coffee, corn, soybeans, natural gas or one other market
• Detailed information on how global weather may affect commodity prices
• Email Jim Roemer (one question a month) about your market position
• Encompassed crop analysis and special weather maps from around the world
• CLIMATE PREDICT long-range weather forecasts used by major hedge funds and commodity traders
• Grain, Soft and Energy Commodities—Know before the crowd where the weather extremes will be
Read More
Sample Reports
GRAINS COMMODITIES
SOFT COMMODITIES
International Weather/Special Climate Reports
CLIMATE PREDICT–Historical Snow Cover and Hurricane Maps