You can receive my monthly newsletter CLIMATELLIGENCE and find out my longer term view about grain, natural gas and soft commodity updates with the most detailed long-range weather forecasts available.
Will corn go to $7.00 next summer and wheat over $8.00? CLICK ON CLIMATELLIGNCE LINK BELOW


The bullish USDA crop report is old news, but I review it anyway, below. Its pretty incredible that the Iowa Drecho last summer and some late season dryness in Wisconsin and Michigan were part of the reason USDA continues to lower the US corn crop. This bull move is such good news for farmers, finally, who have suffered from the Trade War and lower grain prices the last few years.
My report also discusses early spring and summer weather and the growing Midwest and Plains dryness for the US grain belt This is based on La Nina and a very negative AO index . The negative AO/Nao index is resulting in a cold winter in Europe and Asia and may soon for the U.S., as well. Snow cover needs to deepen to see extreme US cold, but the weather pattern is changing.
WHEAT:
The outlook for 2020/21 U.S. wheat this month is for stable supplies, higher domestic use, unchanged exports, and lower ending stocks.
The 2020/21 global wheat outlook is for smaller supplies, increased consumption, higher exports, and reduced stocks. Supplies are lowered 1.6 million tons to 1,072.7 million on reduced production in China and Argentina more than offsetting an increase for Russia.
China’s production is reduced 1.8 million tons to 134.3 million on the National Bureau of Statistics estimate. Russia’s production is raised 1.3 million tons to a new record of 85.3 million, based on estimates from Russia’s statistical agency, surpassing the 2017/18 crop. Argentina’s production is reduced 0.5 million tons to 17.5 million on updated harvest results to date and this would be Argentina’s smallest crop in five years. World 2020/21 consumption is increased 1.8 million tons to 759.5 million, mostly on higher feed and residual use for China and the United States and greater food, seed, and industrial (FSI) use for Russia.
COARSE GRAINS:
This month’s 2020/21 U.S. corn outlook is for lower production, reduced corn used for ethanol, smaller feed and residual use and exports, and decreased ending stocks. Corn production is estimated at 14.182 billion bushels, down 324 million on a lower yield and slight reduction in harvested area.
Global coarse grain production for 2020/21 is forecast down 9.3 million tons to 1,438.5 million. This month’s foreign coarse grain outlook is for lower production and consumption, and smaller ending stocks. Foreign corn production is reduced with declines for Argentina and Brazil more than offsetting increases for China and India. For Argentina, dryness during December reduces yield prospects for early-planted corn in key central growing areas. Brazil is lowered reflecting reduced yield expectations for first-crop corn in southern Brazil.
OILSEEDS:
U.S. oilseed production for 2020/21 is estimated at 122.4 million tons, down 1.25 million from the previous report. Smaller soybean, peanut, and cottonseed crops are partly offset by an increase for canola and sunflower seed. Soybean production is estimated at 4.135 billion bushels, down 35 million led by reductions for Minnesota, Iowa, and Kansas. Harvested area is estimated at 82.3 million acres, up slightly from the previous report. Yield is estimated at 50.2 bushels per acre, down 0.5 bushels. With higher imports and slightly higher beginning stocks, soybean supplies are down 14 million bushels from last month.
The soybean crush forecast is raised 5 million bushels to 2.2 billion, reflecting improved prospects for soybean meal exports with a lower export forecast for Argentina. The soybean export forecast is raised 30 million to a record 2.23 billion bushels. With lower supplies and increased use, ending stocks are projected at 140 million bushels, down 35 million from the previous forecast.
Soybean production was lowered 2 million tons to 48 million for Argentina and 0.2 million to 2.2 million for Uruguay, reflecting dry weather conditions in December and early January. Mostly offsetting lower South American soybean production is a 2.1-million-ton increase to 19.6 million for China on recent government data. Global soybean stocks are lowered 1.3 million tons to 84.3 million, with lower stocks for Argentina and the United States that are partly offset by higher stocks for China.
I am not sure whether increases rainfall for Argentina may be an excuse for a sell off at some point in soybeans given such strong global demand. Seasonally soybean prices top out during La Nina by later January or February for a couple months.
LIVESTOCK, POULTRY, AND DAIRY:
The 2020 total red meat and poultry production estimate is reduced from last month. The beef production estimate is reduced on lower cattle slaughter. The pork production estimate is reduced as the slower pace of slaughter in late 2020 more than offset heavier carcass weights. The broiler production estimate is reduced on recent hatchery and slaughter data, while the turkey production estimate is lowered or recent production data. The egg production estimate is unchanged.
For 2021, the total red meat and poultry production forecast is lowered from the previous month as lower expected beef, broiler, and turkey production more than offsets higher pork production. Lower expected placements in late 2020 will impact fed cattle supplies in mid 2021. .
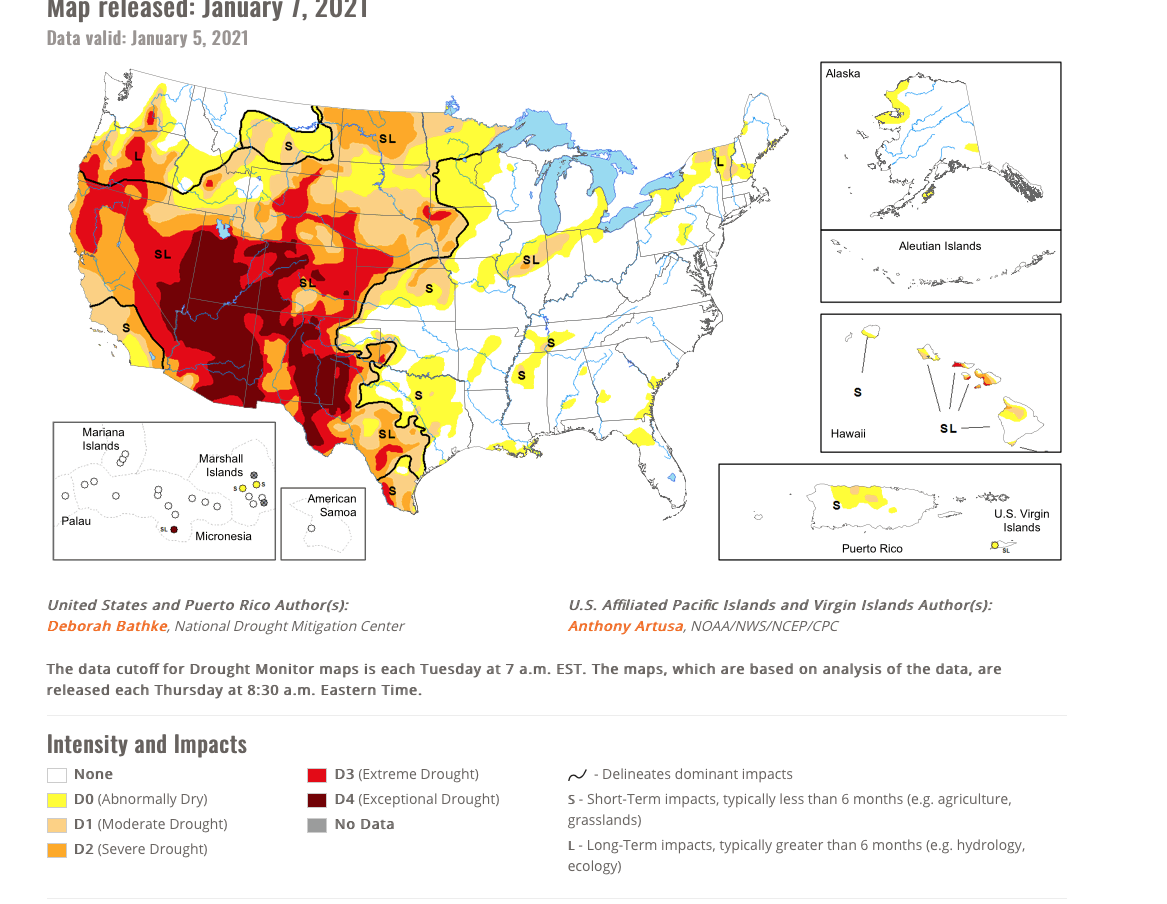
US DROUGHT EXPANDING: S. PLAINS WHEAT, CATTLE AND WESTERN CORN BELT REGION.
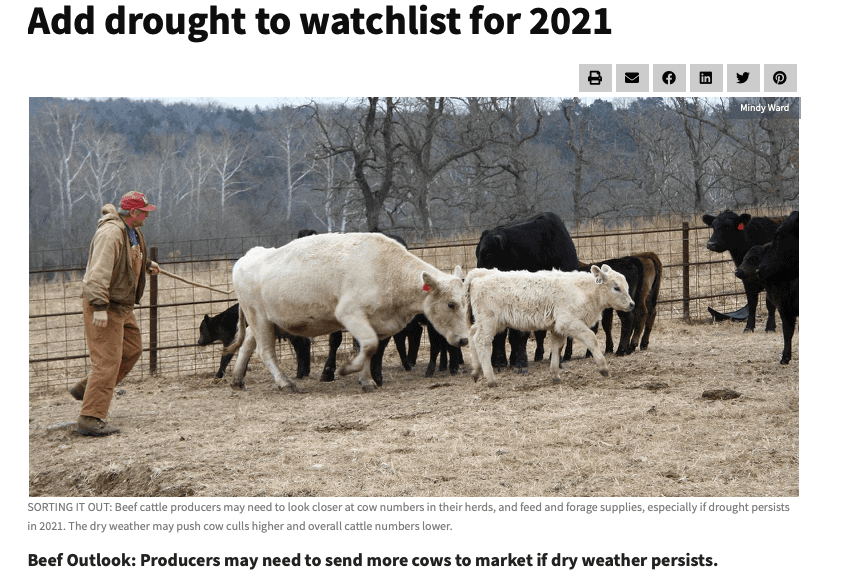
As if there was not already enough uncertainty facing cattle and beef markets, worsening drought conditions have affected many important cow-calf production areas and could play a major role for the national industry as we move into 2021.
Dry Plains weather can sometimes cause herd liquidation and continue to be bullish wheat, longer term
The U.S. Drought Monitor, produced by the National Drought Mitigation Center at the University of Nebraska-Lincoln, provides a weekly numerical assessment of drought severity. In recent months, it has reported rapidly deteriorating conditions.
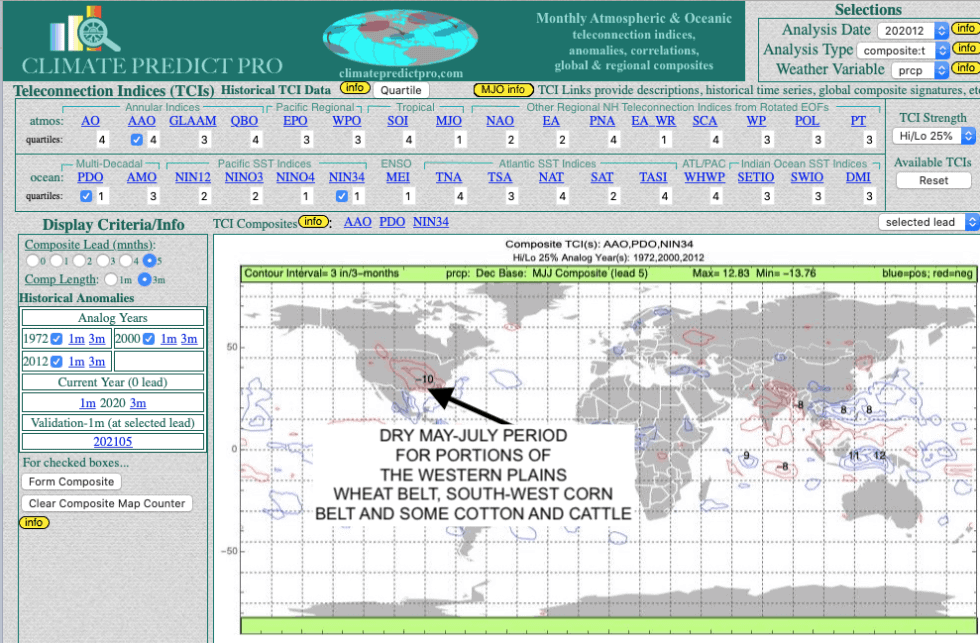
LA NINA AND A NEGATIVE AO INDEX: IMPLICATIONS FOR SPRING AND EARLY SUMMER WEATHER FOR US GRAINS
I have talked about La Nina and the Ao index separately but how about when you combine both a very negative NAO/AO index in January and La Nina?
Looks like at least part of the Plains wheat areas and corn belt will have a dry spring. This could remain a bullish longer term feature for grains, though it appears as if Argentina’s drought may improve a bit for some regions, especially in the north.
My in house long range weather forecast software is used by farmers, traders and agribusinesses throughout the world. Will things change in the coming months? You will want to find out before the crowd in order to make proper hedging or investing decisions in grains, etc. in the months ahead.