
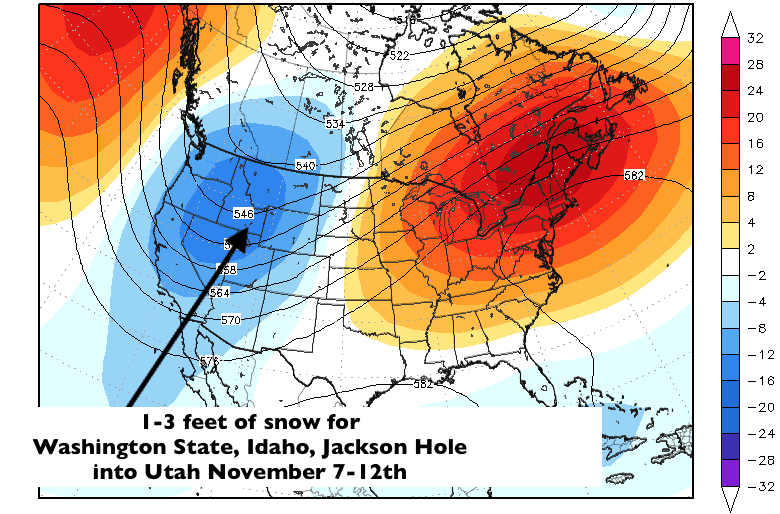
Big snows coming to the West, finally in early to mid November
La Nina events often bring good winter snows to the Pacific Northwest into British Colombia and heading into November, a major change in the weather pattern will bring early season snows from Whistler to Mt. Baker, Crystal Mountain, Jackson Hole, and in Places like Snowbird. Many of these areas have seen record late summer and early fall heat with historical fires destroying millions of acres of land in California to the Pacific Northwest.
Download A Free Issue Of Climatelligence and Subscribe for just $29.99 A Month to receive the best long range forecasts for the ski industry
If you are an avid skier, ski area manager, or anyone in the snow sports industry, you can download a recent sample of my new monthly newsletter called Climatelligence, below. The November and December issues will have a unique insight into my long-range weather forecasting techniques, which I have done for major ski areas for over 25 years.
CLICK BELOW FOR YOUR FREE ISSUE

Find out the best way to plan a ski trip and how the weather will affect your business with the most in-depth all-weather newsletter available. Receive a free copy, here.
Looking at two ski seasons following an active hurricane season
Each La Nina winter is different, but generally, it is the Pacific Northwest and much of British Colombia and Alberta who benefit the most with above-normal snowfall. Eastern US winters tend to be very variable with extreme temperature fluctuations. For example, heading into early to mid-November, near-record warmth will aggravate snowmaking conditions.
One can look at where snowfall was above or below normal for the last two La Nina winters, which also happened to have an active hurricane season. These were the active hurricane winters of 2017-2018 and the infamous 2005 hurricane season.
I will have much more detail, plus interesting long-range weather forecasts and other goodies in my newsletter in the coming months.
2017-18 Ski Season Summary
Source: Bestsnow.net
2017-18 favored the north over the southern regions to an extreme degree with only a narrow region in between near average, ranging from Mt. Hood to the Tetons. Many areas in Washington, Montana, and farther north were over 120% of normal while most from central Oregon, Utah, Colorado, and farther south were under 80%, with the Southwest suffering worst at 60% or less. For more detail on snow incidence by month and region, see 2017-18 Ski Season Analysis.
| 2017-18 SKI SEASON SNOWFALL SUMMARY | |||||||
| RECORD HIGH (10 Years Minimum) | 6+ Powder | RECORD HIGH (10 Years Minimum) | 6+ Powder | ||||
| Waterville Valley, N. H. 3,000 | 214 | 11% | |||||
| Castle Mt., Alb. 5,700 | 461 | 19% | |||||
| HIGH SNOWFALL | HIGH | ||||||
| Lake Louise, Alb. 6,700 | 250 | 9% | Lookout Pass, Idaho/Mont. 5,600 | 586 | Dec.-Mar | 33% | |
| Sunshine Village, Alb. 7,028 | 317 | 11% | Silver Mt., Idaho 6,200 | 409 | Dec.-Mar | 23% | |
| Big White, B. C. 6,200 | 361 | 15% | |||||
| Big Sky, Mont. 8,920 | 376 | 13% | |||||
| Sun Peaks, B. C. 6,100 | 266 | 11% | |||||
| Whitefish, Mont. 6,700 | 427 | 19% | |||||
| Whitewater, B. C. 5,500 | 498 | 18% | |||||
| Schweitzer, Idaho 4,700 | 429 | 18% | |||||
| Revelstoke, B.C. 6,429 | 432 | 17% | |||||
| ABOVE AVERAGE SNOWFALL | ABOVE AVERAGE | ||||||
| Mt. Washington, N. H. 6,262 | 344 | 13% | Red Mt. 2, B. C. 6,650 | 217 | Dec.-Mar | 12% | |
| Mt. Rainier Paradise, Wash. 5,420 | 688 | 27% | |||||
| Snoqualmie Pass, Wash. 3,000 | 442 | 18% | |||||
| Sugarloaf, Maine 3,695 | 174 | 9% | |||||
| Jackson Hole, Wyo. 8,250 | 391 | 13% | |||||
| Cannon Mt., N. H. 1,800 | 189 | 9% | |||||
| Grand Targhee, Wyo. 8,200 | 506 | 17% | |||||
| Whistler Roundhouse, B. C. 6,000 | 478 | 17% | |||||
| Snowshoe, W. V. 4,848 | 179 | 9% | |||||
| Fernie, B. C. 5,400 | 459 | 18% | |||||
| Mt. Baker, Wash. 4,300 | 759 | 31% | |||||
| Okemo, Vt. 3,300 | 182 | 9% | |||||
| Keystone, Colo. 11,641 | 240 | 9% | |||||
| Bridger Bowl, Mont. 7,100 | 341 | 13% | |||||
| Crystal Mtn 2, Wash. 6,100 | 480 | 21% | |||||
| Whiteface (Lake Placid), N. Y. 3,660 | 224 | 10% | |||||
| BELOW AVERAGES SNOWFALL | BELOW AVERAGE | ||||||
| Killington, Vt. 4,142 | 230 | 11% | |||||
| Central Sierra Snow Lab – Boreal, Cal. 7,200 | 263 | 12% | |||||
| Mammoth Mtn, Calif. 9,600 or 8,900 | 250 | 11% | |||||
| Mt. Fidelity (Selkirks), B. C. 6,150 | 479 | 18% | |||||
| Alpine Meadows, Calif. 7,000 | 313 | 15% | |||||
| Mt. Bachelor, Ore. 6,350 | 304 | 11% | |||||
| Berthoud Pass, Colo. 11,315 | 297 | 12% | |||||
| Kirkwood (Carson Pass), Calif. 8,526 | 318 | 15% | |||||
| Mary Jane at Winter Park, Colo. 10,800 | 301 | 12% | |||||
| Alyeska, Alaska 2,750 | 499 | 21% | |||||
| Loveland, Colo. 11,200 | 283 | 10% | |||||
| Jay Peak, Vt. 3,000 | 322 | 14% | |||||
| Arapahoe Basin, Colo. 10,820 | 254 | 9% | |||||
| Brundage, Idaho 6,000 | 236 | 10% | |||||
| Stratton, Vt. 3,875 | 185 | 10% | |||||
| Mt. Hood Meadows, Ore. 5,400 | 443 | 16% | |||||
| Squaw Valley, Calif. 6,200 | 236 | 12% | |||||
| Smuggler’s Notch, Vt. 1,600 | 317 | 15% | |||||
| Stevens Pass, Wash. 4,061 | 467 | 18% | |||||
| Sun Valley, Idaho 8,800 | 186 | 8% | |||||
| Snow Basin, Utah 7,700 | 226 | 10% | |||||
| Squaw Valley, Calif. 8,000 | 397 | 18% | |||||
| Stowe, Vt. 3,041 | 274 | 12% | |||||
| Sugar Bowl, Calif. 7,000 | 315 | 14% | |||||
| Northstar, Calif. 7,800 | 260 | 12% | |||||
| Heavenly Valley, Calif. 10,000 | 282 | 13% | |||||
| Le Massif, Que. 2,600 | 172 | 8% | |||||
| Sierra at Tahoe, Calif. 7,746 | 279 | 13% | |||||
| June Mtn, Calif. 8,700 | 219 | 11% | |||||
| LOW | LOW | ||||||
| Crater Lake (Mt. Bailey), Ore. 6,800 | 304 | 11% | |||||
| Gothic, Colo. 9,400 | 170 | 6% | |||||
| Southern California Composite 7,000 – 8,000 | 39 | 2% | |||||
| Park City 2, Utah 9,300 | 196 | 9% | |||||
| Snowbird Tram Base, Utah 8,100 | 259 | 12% | |||||
| Alta, Utah 9.600 | 381 | 16% | |||||
| Steamboat, Colo. 9,200 | 262 | 10% | |||||
| Alyeska, Alaska 1,500 | 257 | 12% | |||||
| Sugarbush, Vt. 3,000 | 190 | 8% | |||||
| Jupiter Bowl, Utah 10,000 | 219 | 10% | |||||
| Snowbird Mid-Gad, Utah 9,640 | 321 | 14% | |||||
| Arizona Snowbowl 2, Ariz. 10,800 | 99 | 5% | |||||
| Brian Head, Utah 9,770 | 180 | 9% | |||||
| Breckenridge 2, Colo. 12,000 | 277 | 10% | |||||
| Vail, Colo. 11,250 | 216 | 8% | |||||
| Copper Mtn, Colo. 11,000 | 217 | 8% | |||||
| Wolf Creek, Colo. 10,642 | 226 | 10% | |||||
| Aspen Highlands, Colo. 11,100 | 173 | 7% | |||||
| Beaver Creek, Colo. 11,200 | 223 | 9% | |||||
| Brighton, Utah 9,502 | 346 | 15% | |||||
| Snowmass, Colo. 11,000 | 227 | 9% | |||||
| Aspen Mtn, Colo. 11,190 | 174 | 6% | |||||
| Crested Butte, Colo. 10,150 | 170 | 7% | |||||
| Telluride, Colo. 11,170 | 186 | 8% | |||||
| Purgatory, Colo. 10,000 | 126 | 6% | |||||
| Red Mt. Pass, Colo. 11,090 | 192 | 9% | |||||
| Monarch, Colo. | 208 | 8% | |||||
| Solitude 2, Utah 9,400 | 223 | 10% | |||||
| RECORD LOW (10 Years Minimum) | RECORD LOW (10 Years Minimum) | ||||||
| Taos, N. Mex. 11,200 | 92 | 4% |
2005-06 Ski Season Summary
The following major weather patterns affected the ski season.
November: Several storms began in the Northwest but were most consistent in Montana, Wyoming, and Northern Colorado. North of this track Canada had average snow but south of it Utah, California, and the Southwest were very dry.
Early and mid-December: Montana, Wyoming, and Northern Colorado continued to get heavy snow and had excellent conditions throughout the month. These storms extended into Utah, catching up those areas by Christmas. Adjoining regions (California and Canada) were below average and the Southwest was in severe drought.
Christmas through January: This was one of the most widespread snowy months in recent years. Everyone from Canada to the Sierra, Utah, and Colorado had abundant snow, with only SoCal, Arizona and New Mexico missing out.
February: Snowfall was average early and late but the middle 2 weeks were much drier than normal.
March and early April: Storms consistently pounded the Sierra, with above-average snow in the Northwest and Utah also. These storms finally broke the extreme Southwest drought. The northern areas favored in the early season had below-average snow.
Late spring: While winter lasted deep into April in the Sierra and Utah, there wasn’t much spring. Temperatures warmed rapidly to summer levels, and only Mammoth remained open until July.
| 2005-06 SKI SEASON SNOWFALL SUMMARY | |||||
| RECORD HIGH SNOWFALL | RECORD HIGH (10 Years Minimum) | ||||
| Mammoth Mtn, Calif. 9,600 or 8,900 | 659 | ||||
| Sun Valley, Idaho 8,800 | 352 | ||||
| HIGH | HIGH | ||||
| Jackson Hole, Wyo. 8,250 | 452 | ||||
| Alta, Utah 8,650 | 631 | ||||
| Alpine Meadows, Calif. 7,000 | 494 | ||||
| Sunshine Village, Alb. 7,028 | 290 | ||||
| Mt. Bachelor, Ore. 6,350 | 482 | ||||
| Kirkwood (Carson Pass), Calif. 8,526 | 624 | ||||
| Steamboat, Colo. 9,200 | 440 | ||||
| Heavenly Valley, Calif. 8,400 | 375 | ||||
| Copper Mtn, Colo. 11,000 | 363 | ||||
| Aspen Highlands, Colo. 11,100 | 308 | ||||
| Whiteface (Lake Placid), N. Y. 3,660 | 202 | ||||
| ABOVE AVERAGE | ABOVE AVERAGE | ||||
| Central Sierra Snow Lab – Boreal, Cal. 7,200 | 422 | Big Mountain, Mont. 6,700 | 302 | Dec.-Mar. | |
| Mt. Rainier Paradise, Wash. 5,420 | 729 | Telluride, Colo. 11,170 | 212 | Dec.-Mar. | |
| Crater Lake (Mt. Bailey), Ore. 6,800 | 505 | Schweitzer, Idaho | 249 | Dec.-Mar. | |
| Mt. Washington, N. H. 6,262 | 330 | Whitewater, B. C. 5,500 | 325 | Dec.-Mar. | |
| Stowe, Vt. 3,950 | 243 | ||||
| Brighton, Utah 8,740 | 410 | ||||
| Snowbird, Utah 10,000 | 491 | ||||
| Bridger Bowl, Mont. 7,100 | 336 | ||||
| Mary Jane at Winter Park, Colo. 10,800 | 366 | ||||
| Grand Targhee, Wyo. 8,200 | 531 | ||||
| Gothic, Colo. 9,400 | 372 | ||||
| Squaw Valley, Calif. 8,000 | 583 | ||||
| Whistler Roundhouse, B. C. 6,000 | 466 | ||||
| Big White, B. C. 6,200 | 317 | ||||
| Snowshoe, W. V. 4,848 | 167 | ||||
| Squaw Valley, Calif. 6,200 | 321 | ||||
| Red Mt. Pass, Colo. 11,090 | 291 | ||||
| Mt. Baker, Wash. 4,300 | 781 | ||||
| Vail, Colo. 11,250 | 398 | ||||
| Monarch, Colo. | 312 | ||||
| Breckenridge, Colo. 11,100 | 336 | ||||
| Keystone, Colo. 11,641 | 252 | ||||
| Northstar, Calif. 7,800 | 332 | ||||
| Beaver Creek, Colo. 11,200 | 299 | ||||
| Crested Butte, Colo. 10,150 | 254 | ||||
| Snowmass, Colo. 11,000 | 317 | ||||
| Aspen Mtn, Colo. 11,190 | 260 | ||||
| BELOW AVERAGE | BELOW AVERAGE | ||||
| Sugarloaf, Maine 3,695 | 173 | ||||
| Mt. Fidelity (Selkirks), B. C. 6,150 | 407 | ||||
| Lake Louise, Alb. 6,700 | 146 | ||||
| Whistler Base, B. C. 2,200 | 171 | ||||
| Berthoud Pass, Colo. 11,315 | 306 | ||||
| Southern California Composite 7,000 – 8,000 | 89 | ||||
| Loveland, Colo. 11,200 | 333 | ||||
| Jay Peak, Vt. 3,000 | 328 | ||||
| Alyeska, Alaska 1,400 | 499 | ||||
| Arapahoe Basin, Colo. 10,820 | 321 | ||||
| Purgatory, Colo. 10,000 | 210 | ||||
| Sugarbush, Vt. 3,000 | 208 | ||||
| Fernie Snow Valley, B. C. 5,400 | 367 | ||||
| Mt. Hood Meadows, Ore. 5,400 | 423 | ||||
| Okemo, Vt. 3,300 | 127 | ||||
| Brian Head, Utah 9,770 | 287 | ||||
| Smuggler’s Notch, Vt. 1,600 | 312 | ||||
| Wolf Creek, Colo. 10,642 | 342 | ||||
| Tod Mt. (Sun Peaks), B. C. 6,100 | 162 | ||||
| LOW | LOW | ||||
| Killington, Vt. 4,142 | 191 | ||||
| Taos, N. Mex. 11,200 | 152 | ||||
| Stratton, Vt. 3,875 | 127 | ||||
| Arizona Snowbowl 2, Ariz. 10,800 | 143 | ||||
| Arizona Snowbowl 1, Ariz. 9,500 | 86 | ||||
| RECORD LOW (10 Years Minimum) | RECORD LOW (10 Years Minimum) | ||||
| Waterville Valley, N. H. 3,000 | 78 |


