

One of the big commodity moves this year, of course, has been in precious metals. For the experienced investor, the ratio between gold and silver is, perhaps, one of the significant indicators used to determine the optimum timing in buying and selling precious metals.
Granted, low interest rates, global economic uncertainty, and inflation fears due to the central bank stimulus packages also are all contributing to the rising prices in gold, silver, platinum, palladium, etc.
THE RELATIONSHIP BETWEEN THE GOLD PRICE AND SILVER PRICE
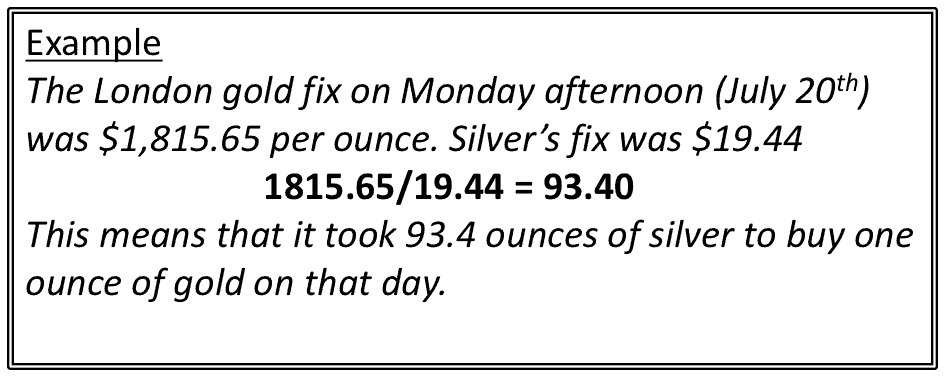
For many investors, the gold-to-silver ratio (“GSR”) remains a vague and elusive mystery. Basically, the GSR is the relative value of the two metals expressed in any given weight unit. Dividing the price of gold (in Troy ounces) by the silver price, in the same weight unit, yields the ratio.
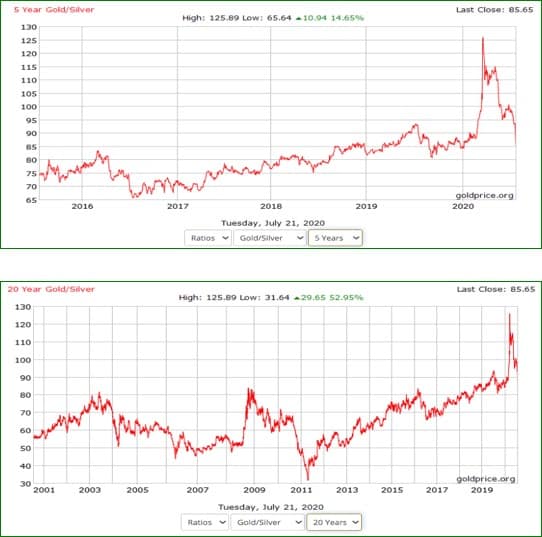
When the ratio is high, the general consensus is that silver is favored for purchasing. This is because investors infer from the ratio that silver is relatively cheap, compared to gold. Conversely, a low GSR tends to imply that it may be a good time to buy the yellow metal. High volume, sophisticated and experienced investors toggle between silver and gold as the ratio swings either way. The ratio’s behavior since 1991 is shown in the three charts below:

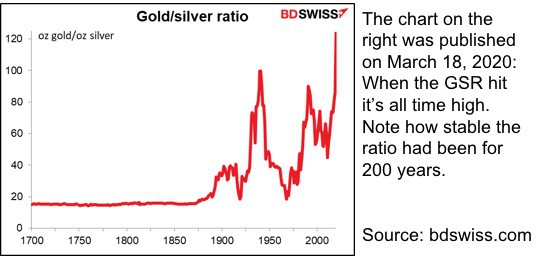
15:1 was the lowest level for the ratio in U.S. history, as it had been legislated into the Mint Act of 1792. The concept is as old as the hills. The Roman Empire had declared a 12:1 relationship for the pair. Three millennia earlier, during the reign of Pharaoh Menes (the first king of Egypt), it was written that 2.5 to 1 was the divine mandated relationship. According to Marshall Gittler, head of investment research for BDSwiss Group, the gold/silver ratio is “…perhaps the longest-running price series in financial history…”
Indeed, the GSR is one of several valuable tools used to determine the optimum time to buy gold or silver bullion. Believe it or not, the Indian Monsoon and Indian demand in the months ahead could also affect gold’s price.
INDIA’S CONSUMER DEMAND FOR GOLD AND THE MONSOON’S INFLUENCE ON PRICES
India is one of the largest consumers of gold. The country has an annual demand equivalent to about 25 percent of the total physical demand worldwide. Traditionally, jewelry demand surges during the festive and wedding seasons, leading to a rally in gold prices. While the demand for gold has a role to play in its price, there are, of course, several other factors.
Everyone knows that when inflation rises, the value of a currency goes down. Therefore, people tend to hold money in the form of gold. When inflation remains high over a longer period, gold becomes a tool to hedge against inflationary conditions. This pushes gold prices higher during this economic phase. Right now, there is a “global psychological fear” that financial stimulus packages and low interest rates will become inflationary.
Monsoons and Gold
Let’s get back to the “Indian equation” and the price of gold. Demand for gold in India is interwoven into their culture and tradition. India’s economic engine is driven greatly by the Indian monsoon and how much rainfall there is during the summer. A poor monsoon (such as 1983 and 2009) can cut purchases of gold by Indian consumers by hundreds of billions of dollars (in Indian rupees, of course).
Rural demand plays an important role in gold demand in the country that depends primarily on monsoons. India annually consumes 800-850 metric tons of gold and rural India accounts for 60 percent of the country’s gold consumption. Therefore, the monsoon plays a big part in gold consumption. If the crop is good, then farmers buy gold from their earnings to create assets.
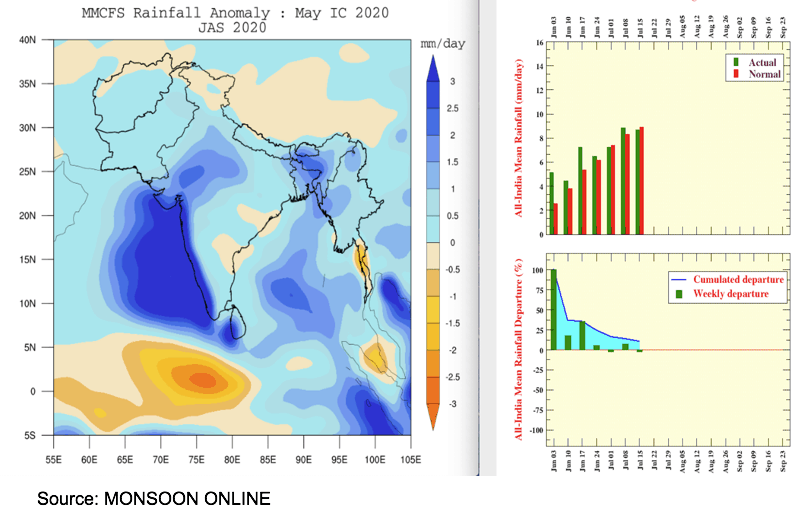
The above map shows that the Indian monsoon has been healthy across most of the country this summer. During El Niño events, we have seen times when a weak monsoon has developed. That can have somewhat of a negative effect on gold demand heading into Q4 and ahead of the holidays. However, El Niño is not present this summer.
A healthy monsoon prevails presently. The map to the left shows the forecast for generally above normal rainfall (blue) throughout India into the late summer and fall. While this may add to the bearish spin in many agricultural commodities (good crops both in the US and India), a good monsoon means that gold demand in India may stay strong this year. Of course, the Indian monsoon is just one of many factors that affect gold demand, as discussed above.

Coffee Prices Soar: Is there really a frost scare for Brazil?
A month ago, in my Weather Wealth newsletter, I began advising customers about my concerns with respect to Robusta (cheap, low quality) coffee crops and supplies originating from Vietnam and Indonesia. It was too dry last winter and spring in Vietnam. Some reduction in the 2021 crop is now coming to fruition. In addition, the heavy rains in Indonesia are possibly delaying their harvest.
There has been a large short position in this market. Hence, a perfect opportunity if there is some major fundamental reason for the “shorts” to run for cover. Yes, the tighter supply situation in Vietnam and Indonesia may be a partial reason for the coffee market. However, technical considerations are probably more at play.
There has been talk of a frost scare for Brazil coffee in the next couple of weeks. I think that it is “hogwash” and just an excuse by some to explain the recent explosion in coffee prices. You can see on my map below that the extreme cold (blue) remains well south of the coffee areas and near the South Pole. Remember, in the Southern Hemisphere, cold air moves from south to north.
So, does a trader use the recent rally in coffee prices to short this market? Or, will the weather situation in Vietnam and Indonesia be enough to continue supporting lower quality Robusta coffee futures (traded in London) that is spilling over to the NY Arabica contract?
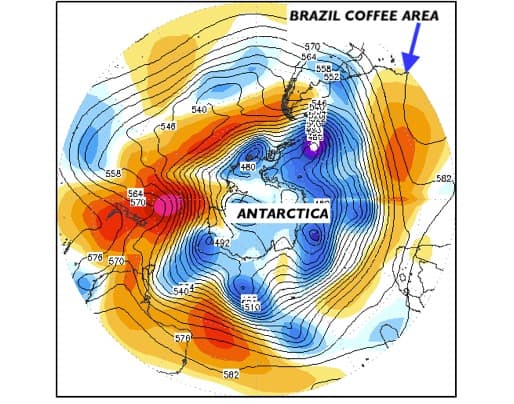
At Best Weather Inc., we offer expert short and long-rang weather forecasts and expert trading advice. I’m closing this piece with the image of Antarctica to help readers in the current heat wave zones to think cool thoughts.
Jim


