
How we use teleconnections to second guess computer models and other weather forecast firms in hurricane forecasting
*********************************************************************************************************************************************************************************************************************************************************************************************************************************
ABSTRACT: My first early look at the hurricane season addresses global teleconnections and potential tracks and intensity levels from our proprietary program – CLIMATECH® It also includes analog years that were derived from phenomena that I dubbed “Weather Wierdos”. It predicts that the Gulf and east coast could be spared major hurricane activity this summer due to the cool Atlantic and weakening La Niña. The total number of storms are still up in the air. This is due to questions about whether El Niño will form and if global warming will alter the presently cool Atlantic enough to foster more storms. On average, we expect a weaker than normal hurricane season this year.
— Jim Roemer
Factors going into hurricane forecast season
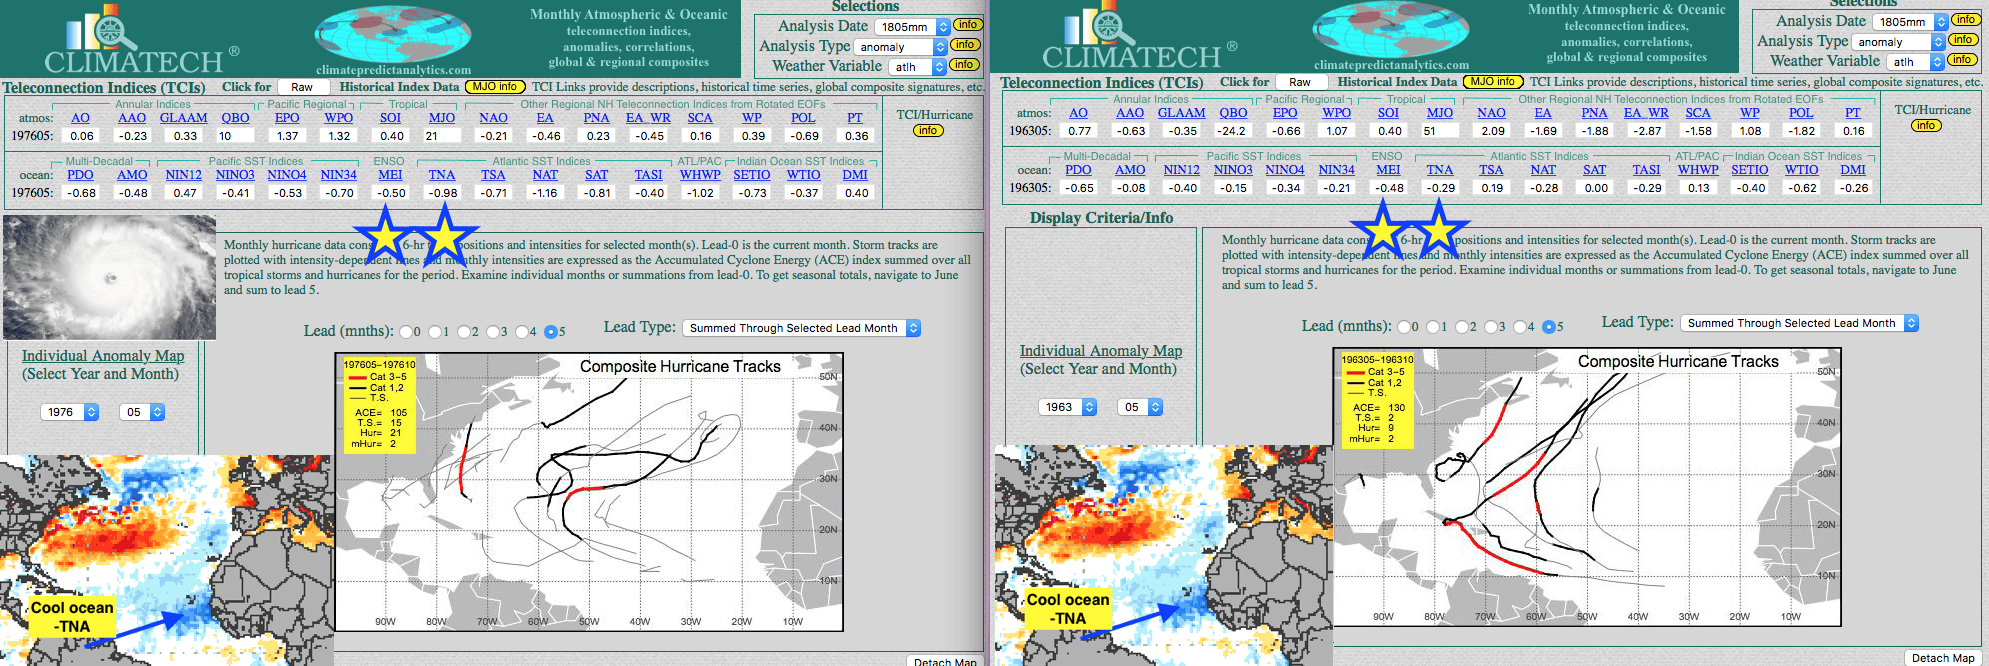
Here at BestWeather, Inc., in conjunction with Douglas Stewart, PhD, we developed CLIMATECH®. This tool is a sophisticated long-range weather forecast platform. We recently added a new feature that incorporates ocean temperatures and climatic weather patterns thousands of miles away (teleconnections). This helps to predict tracks and intensities of tropical storms and hurricanes. Based on a weakening La Niña and cool ocean temperatures off the coast of west Africa (negative TSA), the most likely scenarios for the season would be the two analog maps below. These depict 1976 and 1963. The reader should note the majority of hurricane tracks in these years were generally way offshore. The map on the left (1976) portrays extremely weak tropical activity in the Gulf that year. However, Shawn Hackett of Hackett Financial Services, pointed out to me about a developing cool ocean temperature ring in the middle of the Atlantic. This is eerily similar to 1994 when a very inactive hurricane season prevailed in the Atlantic and Gulf.
What is the main difference between 2018 and 1994? So far this year, we are measuring record warm worldwide temperatures again. Back in 1994, however, the planet was cooler than normal. In fact, two of the worst coffee freezes on record hit northern Brazil in late June and July of 1994. This is something we do not anticipate this year because of a much warmer Antarctica. Nevertheless, both our CLIMATECH® program and Shawn’s research have influenced us to lean towards the forecasting the upcoming Atlantic hurricane season to be “weaker” than normal. There is one caveat, a question still needing an answer: “Will the warmer planet help to offset the cooling Atlantic oceans (seen below) and, hence, increase tropical convection and a much stronger hurricane season than we anticipate?”
Click here for more information about Shawn’s services
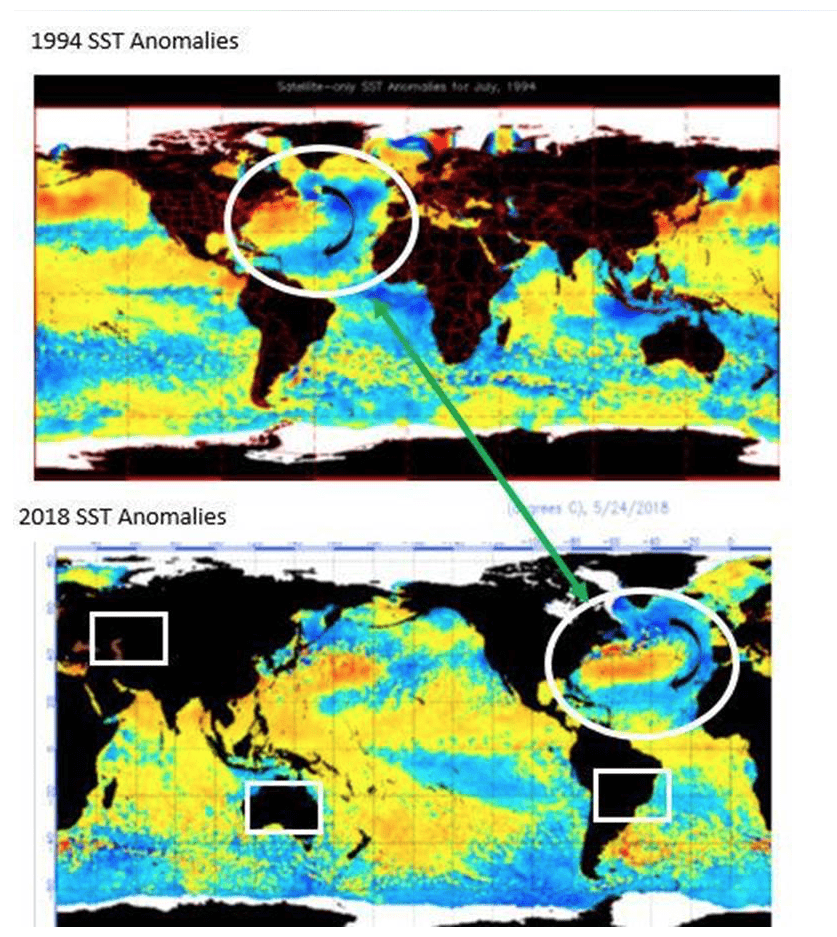
The cool ocean ring in the Atlantic could weaken this year’s hurricane season unless our warming planet heats the Atlantic Ocean quickly enough. One concern is the possibility that El Niño does not form, as some models suggest, partly due to very low solar activity.
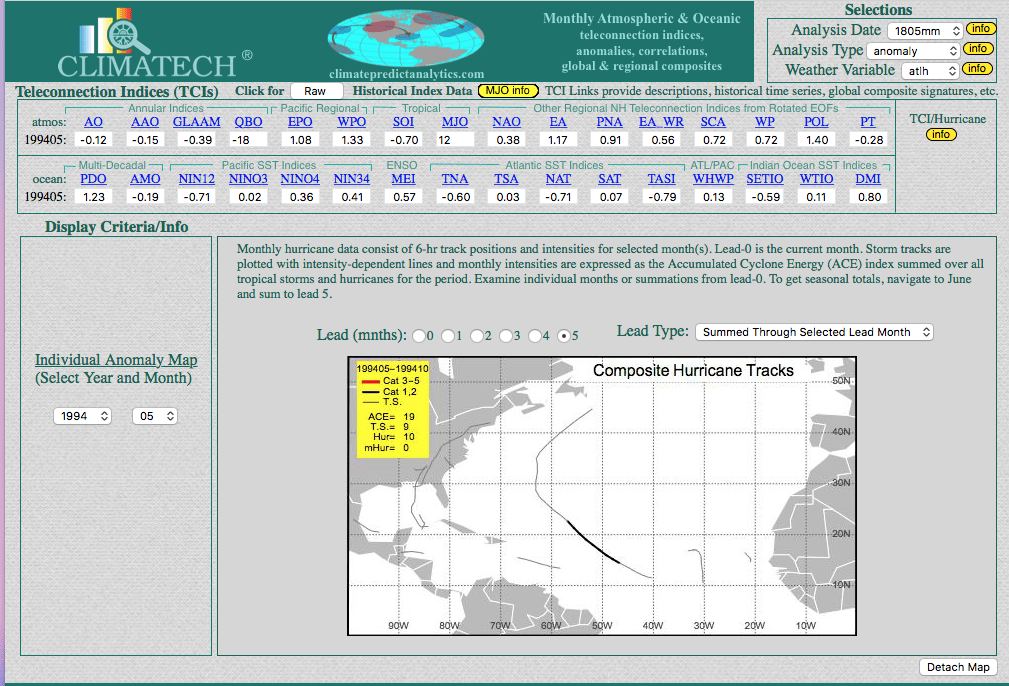
Two of our most compelling analog years for this hurricane season, are 1976 and 1963 (shown below). However, when factoring in the cool blue Atlantic Ocean ring, this seems to suggest a hurricane season closer to 1994 (shown just above), which was a very inactive season. Notice that Atlantic Cyclone Energy (ACE) for the entire 1994 hurricane season was only 19 with very few Atlantic and Gulf storms. That year seems a bit unlikely and too weak of a season, in part because of our concerns about a warming planet.
Global ocean temperatures, along with Weather Weirdos during certain extreme weather events, may display a similar foot-print (analog year) from years ago. It is my strong belief that human activities contribute to warming oceans: my inner jury is not out. This phenomenon certainly plays a significant role in altering both the intensity and the track of any given hurricane.
Bottom line? — The odds seem to favor a “weaker” hurricane season this year because of two factors. The first is a La Niña that is falling apart. The second is the cool Atlantic that may kill late season storms coming off the coast of West Africa. Our most confident early forecast is actually focused on the hurricane tracks, rather than the number of named storms. You can see below that much of the east coast and Gulf coast were spared major hurricanes during our CLIMATECH® analog years.
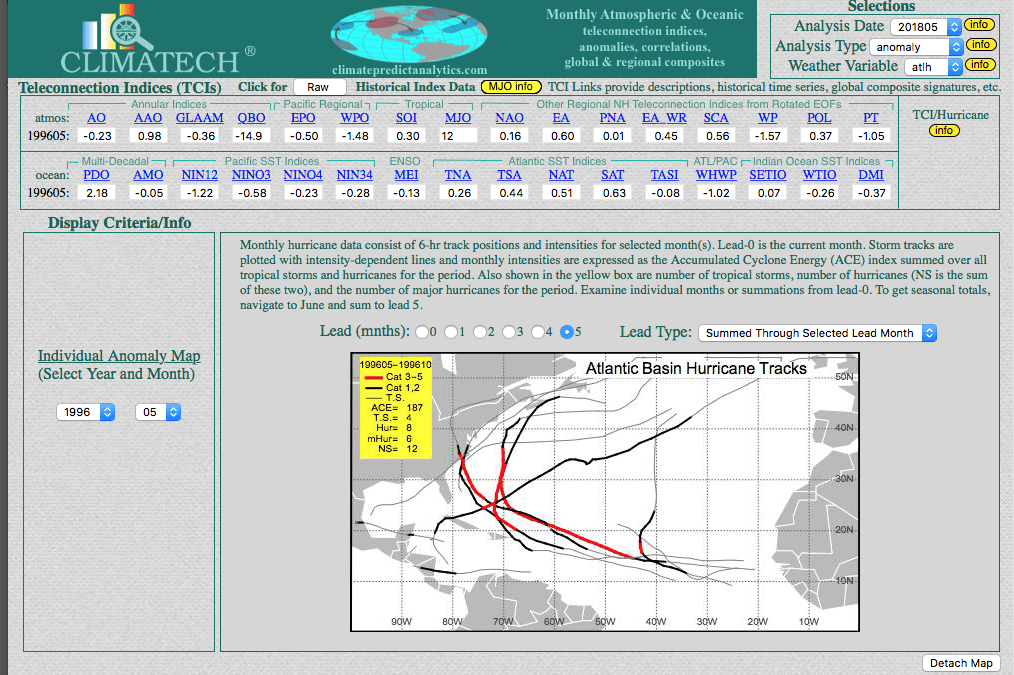
If you scroll to the top of the screen, you’ll see a 1996 map which is the “featured image” of today’s blog. Notice the statistical difference in the number of named storms for 1996 and for 1963:
1996 – 4 tropical storms and 8 hurricanes (6 which were major hurricanes)
1963 – 2 tropical storms and 9 hurricanes (2 were major hurricanes)
There were even fewer in 1994. Nevertheless, if the Atlantic stays cool and the ring remains, the odds of an active season, as per 1976, are unlikely.
1976 (left) had some teleconnections similar to today’s. There were 36 named storms, 2 of which were major hurricanes. However, we like 1963 (right) analog better due to other similar global weather patterns. 1963 had far weaker activity.
OTHER FACTORS WE CONSIDER IN HURRICANE FORECASTING
The analog years of 1994, 1963 and 1976 (shown above), not only had similar global teleconnections, but the aforementioned Weather Weirdos. Droughts, either in Argentina, the U.S. Plains and/or Australia were just some of the “weird weather” events, which occurred the last few months. If you have interest in subscribing to a newsletter that will be launched this coming fall, please contact us at:
HURRICANE OUTLOOK BY OTHER ORGANIZATIONS:
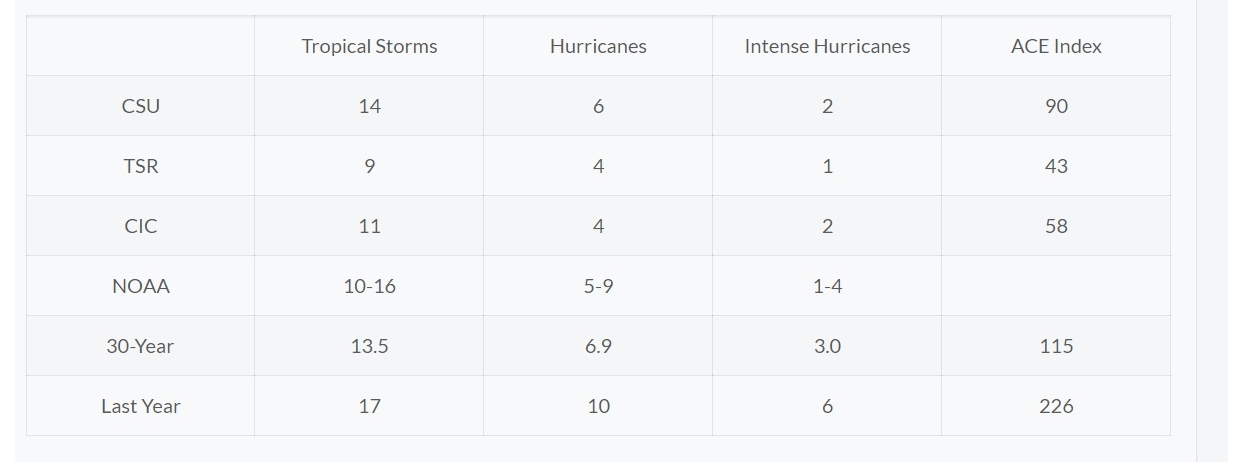
There is no shortage of entities that issue hurricane season forecasts. Government agencies, educational institutions, corporate giants and private enterprises are all players on the field. The long-term annual average for the past 68 years works out to be 11 named storms, 6 hurricanes and 3 major hurricanes with an ACE of 103. What is ACE? (It stands for Accumulated Cyclone Energy). Click here Penn State University is predicting the fewest number of named storms, while North Carolina State University appears to be predicting the most. A handful of the forecasts are summarized below. What goes into long-term hurricane forecasting? A lot has to do with whether El Niño or La Niña form and how warm or cool ocean temperatures are off the coast of Africa and in the MDR region. Here is a simple “rule of thumb”:
The less shear there is in the Atlantic and Gulf, and the warmer the ocean temperatures are, then there is a better chance for an active hurricane season.

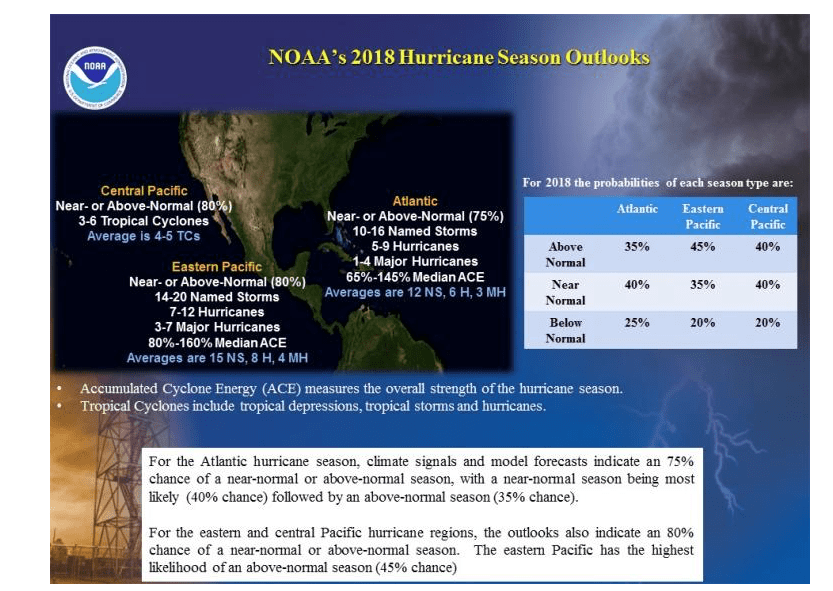
National Oceanic and Atmospheric Administration
“Residents of Hurricane Alley can anticipate a near-normal or above-normal Atlantic hurricane season in 2018,” said NOAA’s Climate Prediction Center on May 24th. In their first seasonal forecast for 2018, NOAA predicted a 40% chance for a near-normal Atlantic hurricane season, a 35% chance for an above-normal season and a 25% chance for a below-normal season. NOAA gave a 70% likelihood of 10 to 16 named storms, 5 to 9 hurricanes and 1 to 4 major hurricanes (Category 3 or higher on the Saffir-Simpson Hurricane Wind Scale).
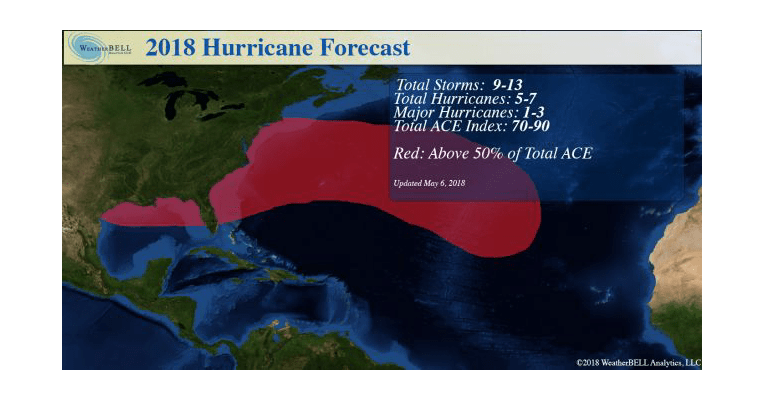
WeatherBELL
Colorado State University
“A slightly above-average Atlantic hurricane season is likely in 2018,” said the hurricane forecasting team from Colorado State University (CSU) in their latest seasonal forecast issued April 5. Led by Dr. Phil Klotzbach, with coauthor Dr. Michael Bell, the CSU team is calling for 14 named storms, 7 hurricanes, 3 intense hurricanes, and an ACE of 130. The CSU outlook also calls for a 63% chance of a major hurricane hitting the U.S. in 2018 (long term average is 52%), with a 39% chance for the East Coast and Florida Peninsula (long term average is 31%), and a 38% chance for the Gulf Coast (long term average is 30%). The Caribbean is forecast to have a 52% chance of seeing at least one major hurricane (long term average is 42%).
IBM – “The Weather Company”
The May 18 forecast from The Weather Company called for a near-average Atlantic hurricane season with 12 named storms, 5 hurricanes, and 2 major hurricanes. Their forecast noted these key influencing factors:
– Atlantic Ocean Temperature Pattern
– Transition Toward El Niño
– Increasing North Atlantic Oscillation
– The Multi-Decade Long Upward Swing in the Tropics Might Be Over
Penn State University
PSU is calling for a below active hurricane season with 10.2 named storms. This forecast comes from a statistical model by Michael E. Mann, Sonya Miller and Michael Kozar. Their prediction was made using statistics of how past hurricane seasons have behaved in response to sea surface temperatures (SSTs), the El Niño/La Niña oscillation, the North Atlantic Oscillation (NAO), and other factors. The model assumed that in 2018 the late-April +0.3°C departure of temperature from average in the Main Development Region (MDR) for hurricanes in the tropical Atlantic would persist throughout hurricane season, a weak El Niño would develop in the fall, and the NAO would be near average. If no El Niño develops, their model predicted slightly higher activity
North Carolina State University
A very active Atlantic hurricane season is predicted by NCSU: 14 -18 named storms.


