
Probably the biggest blessing from the winter weather extremes experienced coast to coast this winter, is the end of multi-year California drought. This will go a long way to replenishing California water reserves, critical to farming and many other industries.
But the extreme flip in weather, from forest fires in 2018 to incessant winter snows and flooding all along the West coast, will still come at a tremendous economic cost.
My article below sheds light on how an oscillating El Nino signal and the PNA index has created extremely volatile winter weather and what the outlook may be for April based on the PNA flipping from negative to positive.
RECORD WESTERN SNOWS BLESS SKI RESORTS, WHILE SEVERE WEATHER THREATENS THE DEEP SOUTH
Mammoth Mountain California had close to 25 feet of snow in just a few weeks. The official 24 hour snowfall record for California was set during the El Nino of 1982, with 67 inches at Echo Summit. While the most total snowfall to accumulate in one calendar year was during the La Nina year from July 1998 to June 1999 at Mt. Baker ski area in Washington. The 19.3 inches of snow in February at Pendleton, Oregon broke a record set back during the El Nino “neutral year” of 1994. The point here is that western weather extremes do not always occur just with an El Nino.
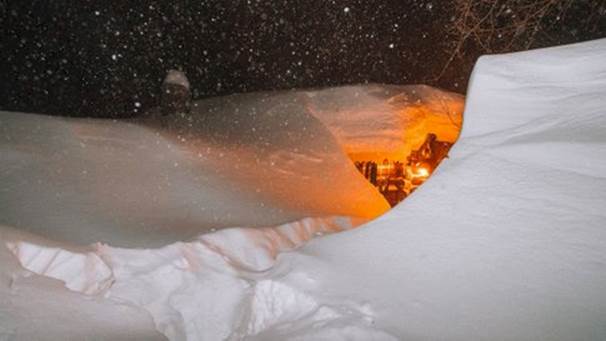
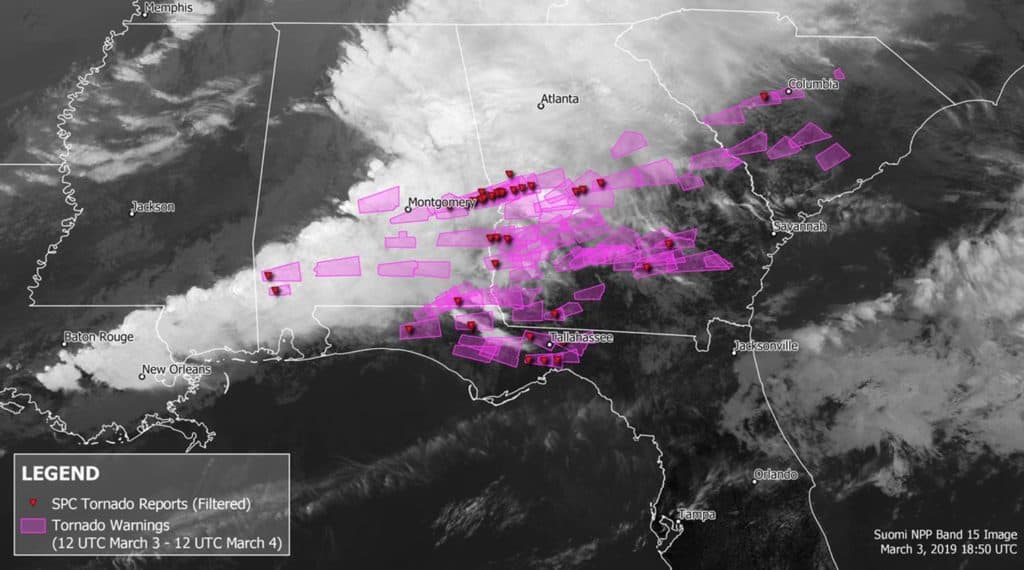
March has already started out extremely snowy out west, with blissful snowfall falling at many ski resorts like Snowbird, Utah and throughout dozen of other resorts out west. In contrast, however, an unusual outbreak of severe weather and tornadoes have dominated the southern United States. To see more about the recent outbreak of tornadoes click here
My research suggests a lot more severe weather to come in the coming weeks.
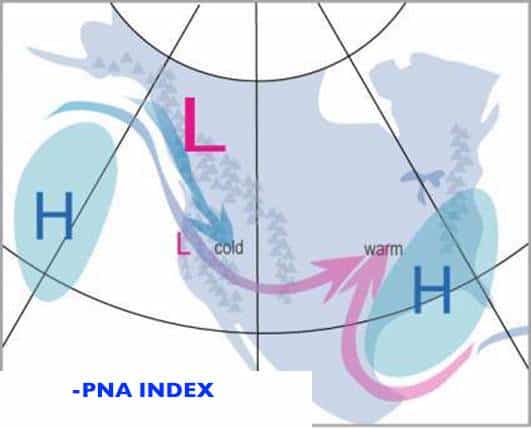
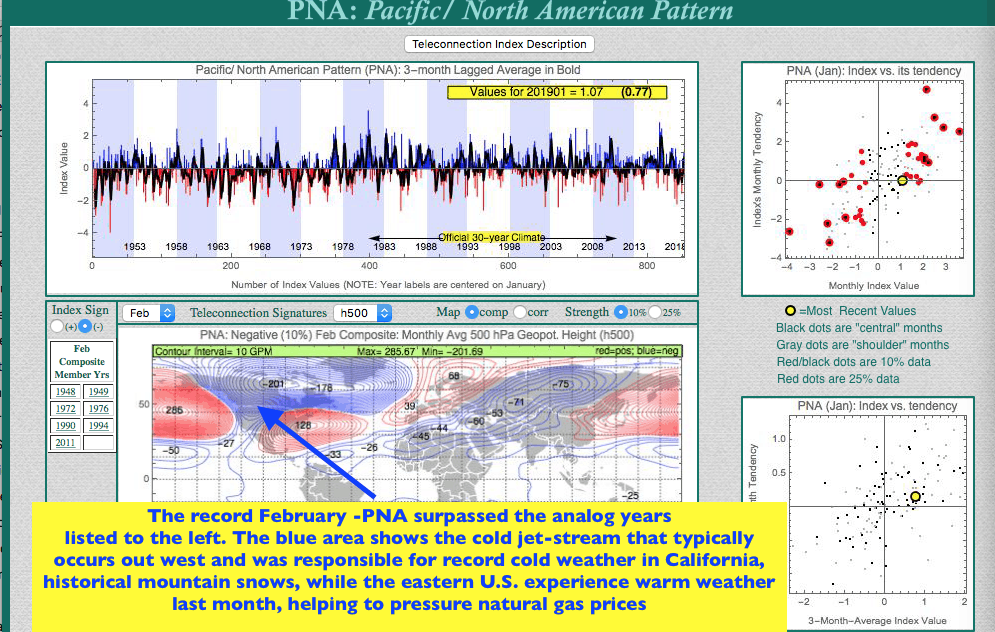
So what is causing all of this extreme weather? After all, El Nino is very weak and has ebbed and flowed all winter with no clear direct signal. Part of the reason has been a meteorological phenomenon of a negative Pacific North Atlantic Oscillation Index.
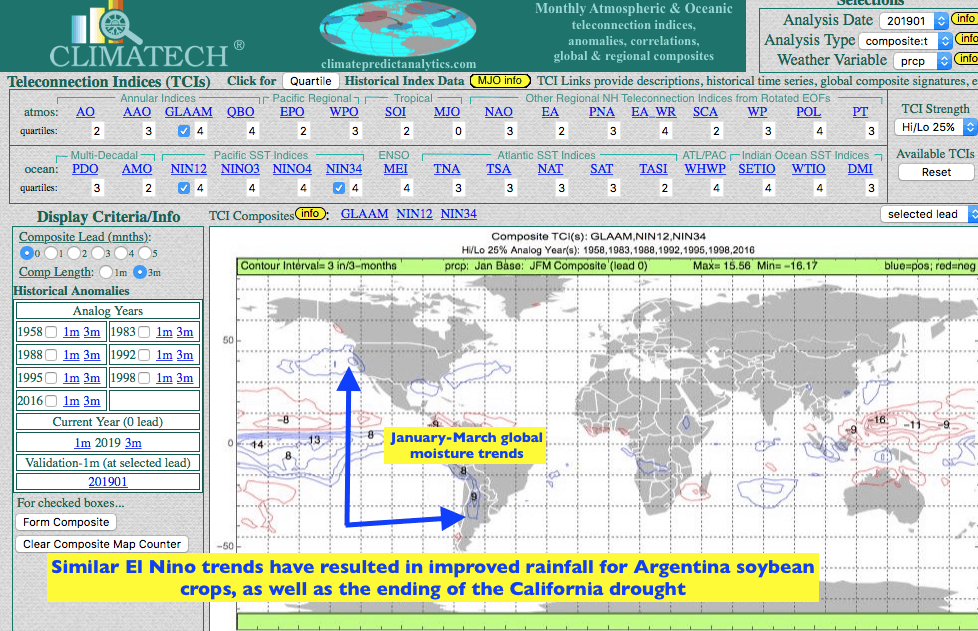
Climatech (below) illustrates how complex this winter’s weather pattern has been across the United States. Close scrutiny of analog years of both El Nino events top map) vs winters with extremely negative PNA values (2nd, bottom map), shows “no two analog years” the same. In other words, it has been extremely uncommon for the PNA index to be negative last month when an El Nino is present. This tells me that while occasional El Nino conditions have existed, globally, we really HAVE NOT had an official El Nino phenomenon.
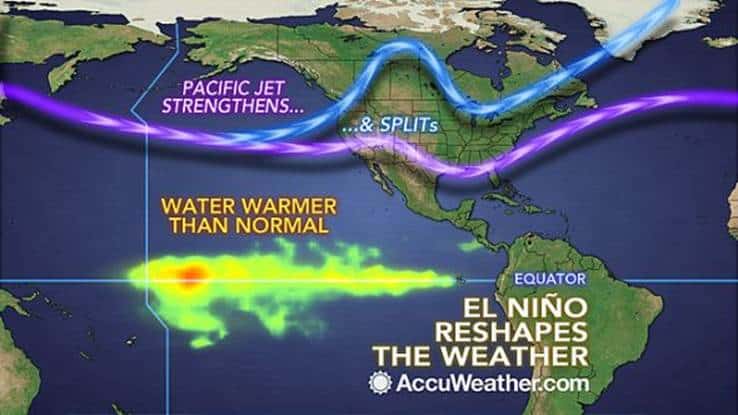
A very wet early spring is likely for much of the country and severe storm activity could really continue. While Tornado Alley (Kansas, Nebraska, Texas and Oklahoma) is most notorious for severe storms during spring, the lingering weak El Nino signal could result in more of a “split” flow in the jet-stream. This would open the door for more tornado activity in areas further east along the Mississippi, Gulf Coast and Southeast U.S. A nice graphic from Accu-Weather, reveals the typical El Nino type weather pattern during spring.
EARLY SPRING OUTLOOK BASED ON THE PNA INDEX FLIPPING.
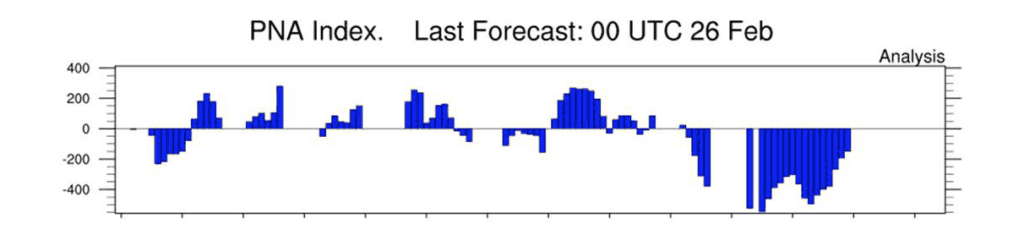
While I employ a ton of different long range weather forecast techniques, one particular teleconnection I have been looking at is the PNA index. Let’s focus in on those years which had the most historically negative February PNA values, which appears to be “flipping” to positive in March
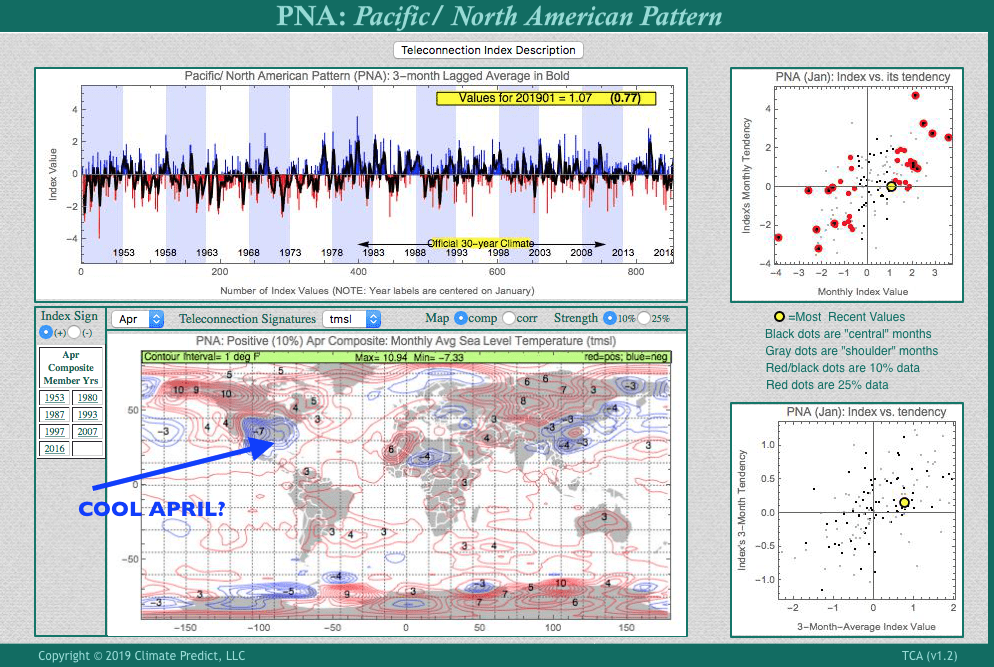
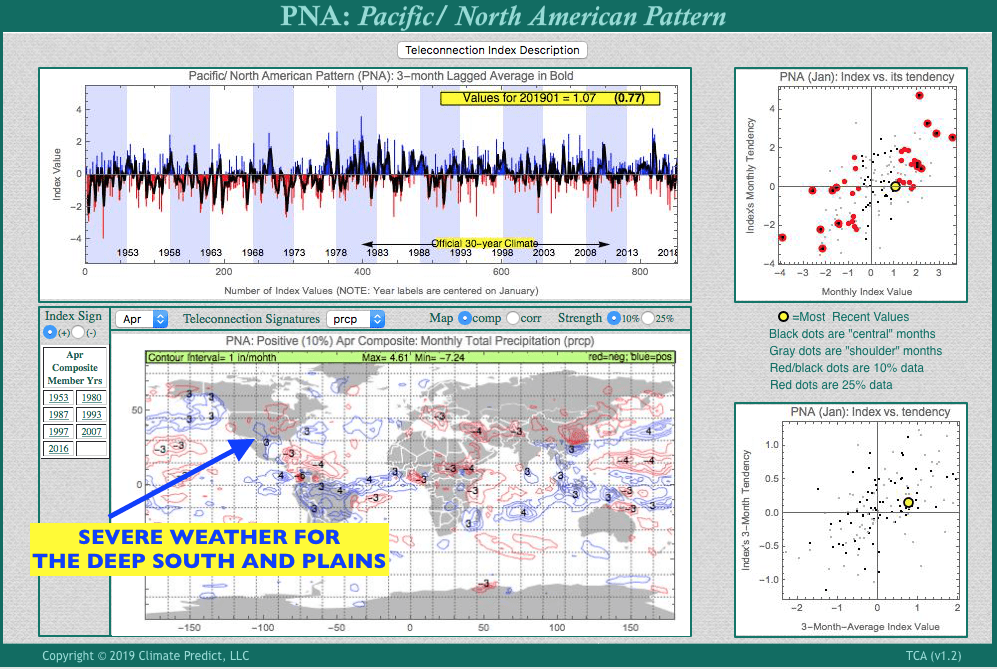
The Climatech chart above shows April rainfall trends when the PNA is positive, not negative, in April. One can see that above normal rainfall (blue) could dominate the deep south and the Plains. That portends an active severe weather season, with above normal tornadoes and potential planting delays for corn and cotton in the Deep South. In contrast, generally good spring conditions for winter wheat, in contrast to last springs drought from Kansas to Texas. In addition, Texas cotton production could make a big rebound barring any severe weather, hail damage during planting.
Roemer


