
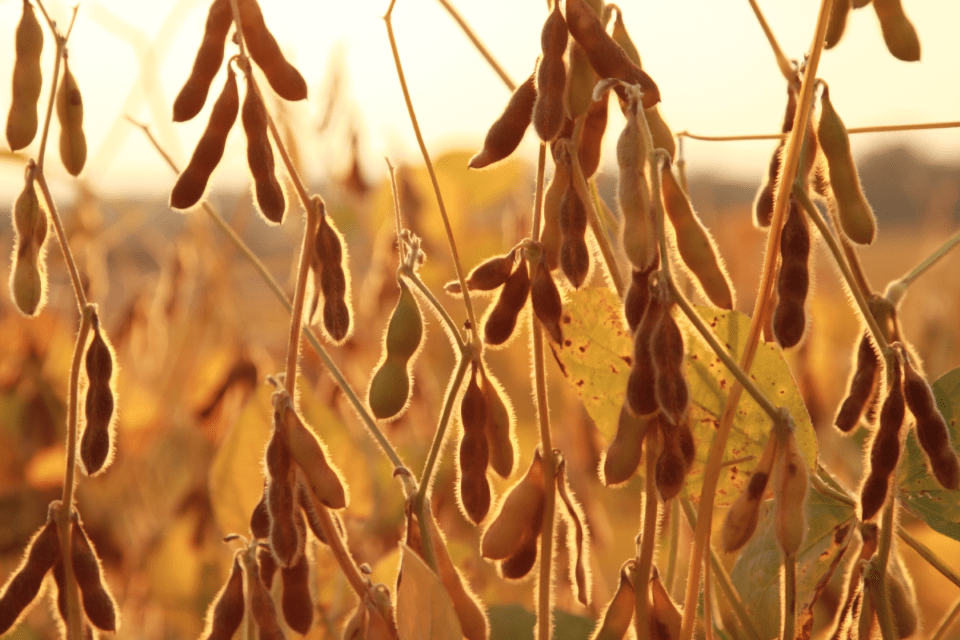
Soybeans continue to fall on the huge South American crop we predicted, months ago.
The Buenos Aires Cereal Exchange has updated last week its estimate for soybean production in Argentina with the same output number of 54.8 million metric tons. On the other hand, the report of the Exchange says that there is tendency of higher yields that, if the weather continues to be favorable, could increase this total volume of production. The fields that planted earlier tend to be in better shape and could show better than average yields.
Earlier this winter (Argentina summer), soybean prices rocketed to about $10.80 last December due to worries over flooded acreage and lower production. However, soybeans have been pressured, not only by ideal Argentina weather, but Brazil production that is higher than most other analysts suggested.
The floods in California and ideal Argentina weather are tell-tale signs that “La Nina” did not form the last few months, so the Argentina crop has recovered.
A year ago, historical flooding rains in Argentina, helped shave production by more than 15% sending exports to the United States and resulting in an unusual major spike in soybean prices during March and especially April.
As our CLIMATECH program shows below, some teleconnections such as incredible warming over the Nino 1+2 region and what we call the Quasi-Biennial Oscillation (QBO), suggest no major problems for the Argentina soybean harvest, as we head into and through April. However, with the AMO and Atlantic warmer than normal, it would not take much for harvest weather to change in April. If so, soybean prices would see a rally. Right now, we do not expect that, but traders will be paying close attention to Argentina the next 5 weeks.
Though not written in stone, Climatech (below) shows a drier trend for Argentina for the soybean harvest. This is in contrast to some other studies and will be watched closely by soybean traders in April
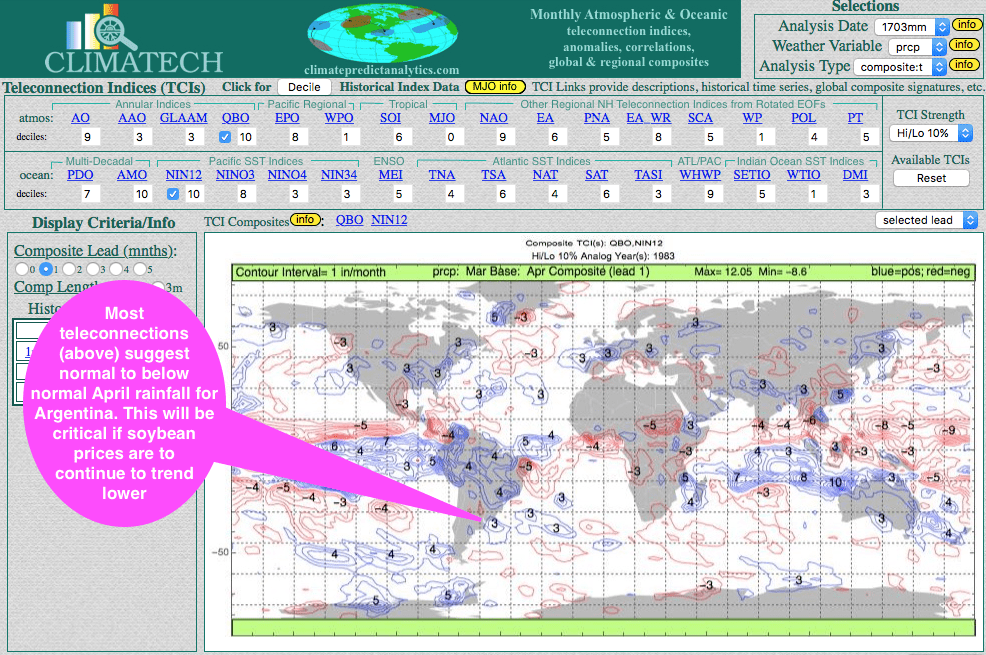
Argentina April rainfall critical for soybean prices. Blue areas show areas of projected wet regions (in inches) and red, dry regions (in inches)


