The ski season in the Northeast has been far from decent, due to a warm winter brought on by occasional El Nino conditions and many other factors. Our CLIMATEPREDICT program did suggest a mild early winter quite early.
As of early January, below we show the 2019-20 ski progress report from the site www.bestsnow.net
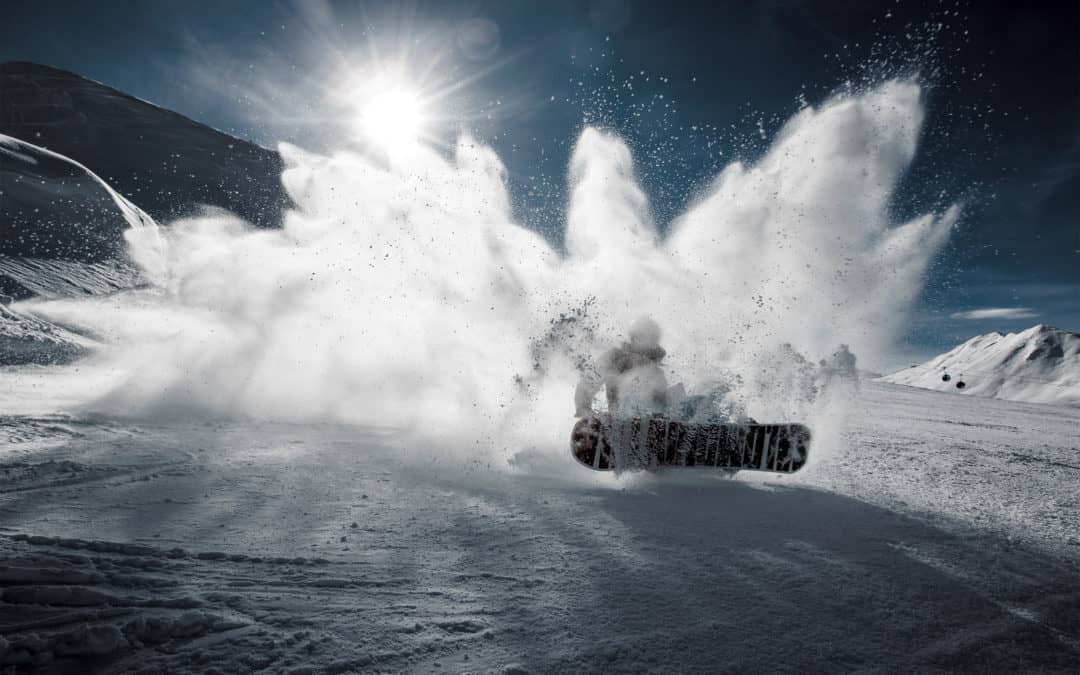
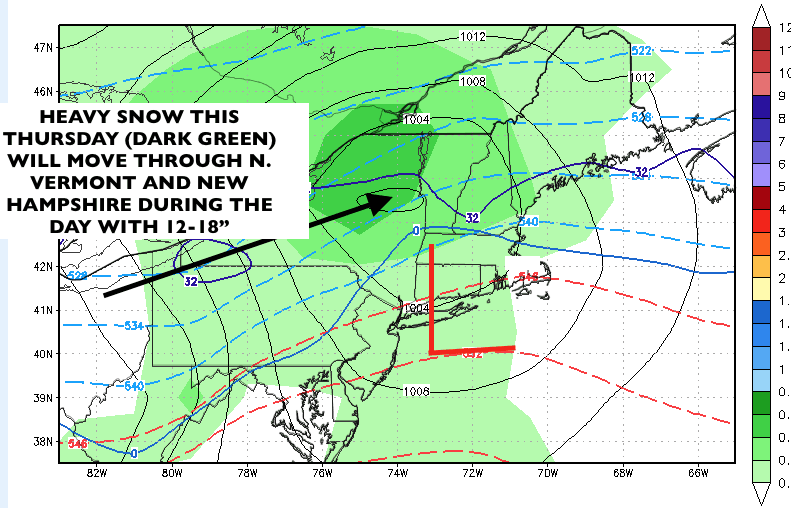
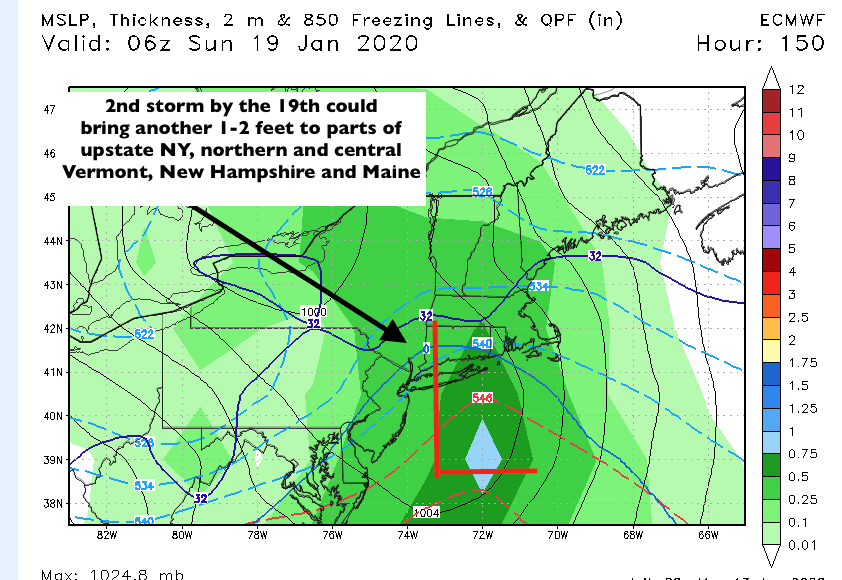
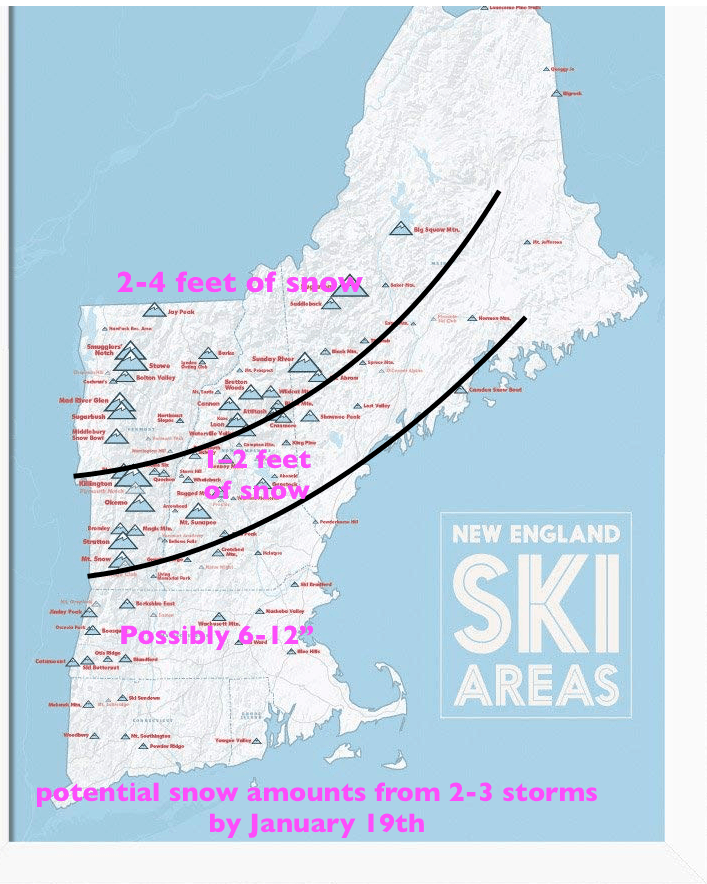
There is some hope for a return of more decent ski conditions for parts of northern New England over the next 2-3 weeks, as a series of storms promises upward of at least 2-3 feet at places like Jay Peak, Stowe, Gore Mt-NY and parts of northern and central New Hamsphire. Ski areas like Sunday River and Sugarloaf could see 1-2 feet this Thursday and a foot or more by the 19th from a second storm. Two Major New England snowstorms are possible improving New England ski conditions with a colder mid-late January outlook.
2019-20 Ski Season Progress Report as of January 1, 2020
October 2019 was exceptionally cold in the Northern Rockies of both US and Canada. There were several small storms in northern regions and particularly in Colorado. The first half of November was bone dry in the western US with no area receiving more than 3 inches snow and most getting zero. Threfore most October snow melted out and is not included in the table of snow totals below. During the third week of November a moderate 1-2 foot storm came mostly through the Southwest while a few inches fell in some northern regions. During Thanksgiving week a strong storm dumped 2-4 feet in California and 4-6 feet in Utah. During the first week of December California got another 3-4 feet and much of western Canada 2 feet with other regions averaging no more than a foot. There was scattered snow over most of the West during the second week of December with the most falling (2-3 feet) in Utah and Colorado. The Pacific Northwest and western Canada were the focus of storms during the third week of December, but the Northwest and much of the US northern Rockies were still seriously deficient in snow for the holidays. California and Utah’s Cottonwood Canyons had the most snow at Christmas. The Southwest and some of western Canada had strong storms over the holidays while other regions had lesser amounts.
California: Mt. Rose opened its beginner lift weekends starting Oct. 25 and Mammoth opened Nov. 9. The first natural Sierra snow Nov. 20 was only 2-6 inches but 2-3 feet fell over Thanksgiving with another 2-3 feet later that weekend. 3-4 feet during the first week of December brought Mammoth to full operation with the most open terrain in North America, while low elevations at Tahoe saw rain. After about 2 feet in mid-December, most terrain at Tahoe was open for Christmas with base depths of 4-6 feet. Late November snowfall was 3-4 feet in Southern California (soon degraded by rain) and 6 feet in Arizona, in full operation by early December. The post-Christmas storm dumped up to 3 feet in Southern California and Arizona but mostly missed the Sierra. See Current California Ski Conditions for more details on Southern California and Mammoth.
Area
Season Snow
Pct. of Normal
Pct. of Area Open
Squaw 8,000
150
105%
80%
Alpine Meadows
115
107%
85%
Mt. Rose
117
111%
99%
Northstar (mid estimate)
109
112%
81%
Heavenly
142
121%
94%
Kirkwood
158
113%
100%
Mammoth
126.5
116%
100%
Southern Cal
96
345%
80-100%
Arizona Snowbowl
128
182%
100%
Pacific Northwest: In October Hood Meadows had 31 inches snow and Mt. Bachelor had 13 inches but the base melted out by mid-November. Late November snow averaged 2 feet in Oregon declining to less than a foot farther north. This was the driest November on record at Whistler and in Seattle. Despite 2 feet in the first half of December and 3 feet before Christmas, this region was still far behind schedule, with Whistler having record low ~30% open terrain over the holidays. Mt. Baker opened Dec. 14 and Stevens Pass Dec. 21. More Northwest terrain opened during the second half of December, but it’s still low tide with base depths averaging 3 feet. Substantial snow is predicted for the upcoming weekend.
Area
Season Snow
Pct. of Normal
Pct. of Area Open
Whistler
79
48%
37%
Crystal Mt.
86
57%
66%
Stevens Pass
71
41%
71%
Mt. Hood
48
29%
52%
Mt. Bachelor
68
48%
42%
Canadian Rockies and Interior B.C.: October snowfall was widespread in this region but November snowfall was significant only well north of the US border. Lake Louise opened a week early on November 1, and had the most terrain open in North America in November. Most areas have received 2-3 feet in the first half of December and 3 feet the week before Christmas. Overall base depths were 4-5 feet and most terrain was open for the holidays. Silver Star and Sun Peaks reached 90+% open by Christmas. The Okanagan areas got 2+ feet of snow during the holiday week with lesser amounts farther south and east.
Area
Season Snow
Pct. of Normal
Pct. of Area Open
Big White
97
84%
88%
Lake Louise
117
175%
86%
Sunshine
132
140%
98%
Revelstoke
159
107%
95%
Kicking Horse
103
100%
95%
Whitewater
149
104%
91%
Red Mt.
51
51%
28%
Fernie
96
71%
75%
Castle Mt.
92
91%
93%
U. S. Northern Rockies: Grand Targhee had 40 inches October snowfall but postponed opening to November 29 due to the dry month. Late November snow was about 2 feet in Wyoming and Sun Valley but less than a foot elsewhere. First half of December snow was 3 feet in the Tetons and 2 feet farther north. About a foot fell during each of the last two weeks of December. Base depths are 4 feet in the Tetons but only 3 feet farther north. Big Sky is 78% open. It will take some more snow to open more advanced terrain in this region.
Area
Season Snow
Pct. of Normal
Pct. of Area Open
Grand Targhee
89
53%
100%
Jackson Hole
83
62%
75%
Whitefish
96
80%
90%
Bridger
77
74%
100%
Schweitzer
65
63%
60%
Brundage
67
62%
96%
Sun Valley
59
82%
88%
Utah: The October cold reached as far south as Utah, setting records near the end of the month. The Snowbird SNOTEL’s 40 inches of October snowfall shrunk to a 9 inch base before a few inches fell during the third week of November. The Thanksgiving week storm dumped 4-6 feet, bringing early season base depths to 3-5 feet. More terrain opened in early December once snow was stabilized plus up to a foot of new snow. 3 feet of snow the second week of December opened most terrain in the Cottonwoods on a 5-6 foot base. About two feet fell during the second half of December in the Wasatch but nearly twice as much in the south at Brian Head.
Area
Season Snow
Pct. of Normal
Pct. of Area Open
Alta
155
92%
100%
Snowbird SNOTEL
145
96%
85%
Brighton/Solitude
127
82%
93%
Park City (mid estimate)
85
88%
77%
Snowbasin
113
109%
90%
Brian Head
140
144%
100%
Northern and Central Colorado: Early openings on snowmaking were A-Basin Oct. 11, Keystone Oct. 12 and Loveland Oct. 25. Most of the 3+ feet of October snow was lost during the dry first half of November so open terrain from Thanksgiving into early December was well below average on base depths averaging a bit under 2 feet after average snowfall during the second half of November and less than a foot during early December. Three feet of snow fell Dec. 12-14. Only a foot fell during the second half of December but 3 foot base depths and open terrain were average over the holidays. A-Basin is 57% open.
Area
Season Snow
Pct. of Normal
Pct. of Area Open
Beaver Creek
72
64%
86%
Breckenridge
92
84%
77%
Copper Mt.
52.5
54%
83%
Keystone
66
84%
91%
Loveland
89
80%
60%
Steamboat
75.5
59%
97%
Vail
76
62%
97%
Winter Park
82
68%
90%
Southern and Western Colorado: The Rocky Mountain Biological Lab at Gothic (between Crested Butte and Aspen) had 20 inches October snowfall but lost its base during the dry first half of November. Wolf Creek had 22 inches October snowfall and Monarch 38 inches, so both opened by Nov. 1. The Southwest was the region most favored during the third week of November plus about 3 feet of snow during the ensuing two weeks. A mid-December storm averaged 2 feet at most areas but 4 feet at Monarch. Base depths were 3-4 feet at most areas and 5 feet at Wolf Creek and Monarch after up to one foot of snow the week before Christmas. The Southwest storm after Christmas dumped 4 feet at Wolf Creek and about 2 feet at other southern areas.
Area
Season Snow
Pct. of Normal
Pct. of Area Open
Aspen/Snowmass
98
123%
97%
Gothic Snow Lab
50
52%
N/A
Crested Butte
69
86%
57%
Monarch
125
139%
100%
Telluride
118
134%
87%
Purgatory
107
127%
100%
Wolf Creek
171
139%
100%
Taos
94
106%
89%
Northeast: The first openings were Killington Nov. 3, Mt. St. Sauveur Nov. 8 and Sunday River Nov. 9. Early November weather was favorably cold but there was mixed precipitation late in the month. Terrain expanded some in early December with 1.5 feet of new snow. Rain on Dec. 14 depressed trail counts. There was some recovery before Christmas, but a tough holiday week with some freezing rain. Conditions at New Year’s are improving with a foot of new snow. Percents open: Hunter 60%, Okemo 65%, Sunday River 73% and Sugarloaf 33%, Tremblant 87%, St. Anne 52%.
California forest fires are just another example of climate change. While a cold winter is likely in the cards, this does not change the reality of more extreme weather globally and the fact that the oceans and the entire planet have been warming. Low solar activity will probably result in a cold winter. The long-term effects of CO2 emissions and methane released by the increase in the livestock industry have, no doubt, implications humanity’s health. It has also worsened the Red Tide in Florida and poses the continuing threats of melting sea ice and rising sea levels. For a free sample of my winter outlook and how it will affect the natural gas, grain and soft commodity markets, please register here.
Windfall is a great book about the potential boom in many industries that address the climate change problem
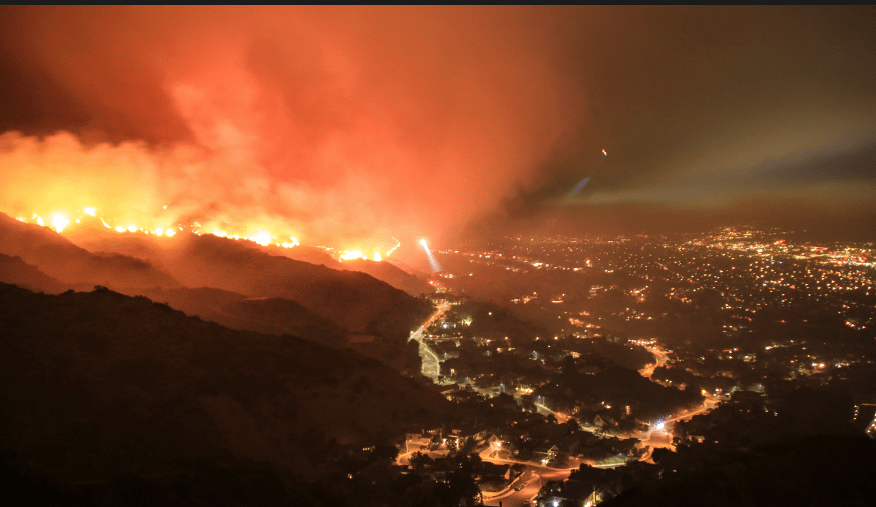
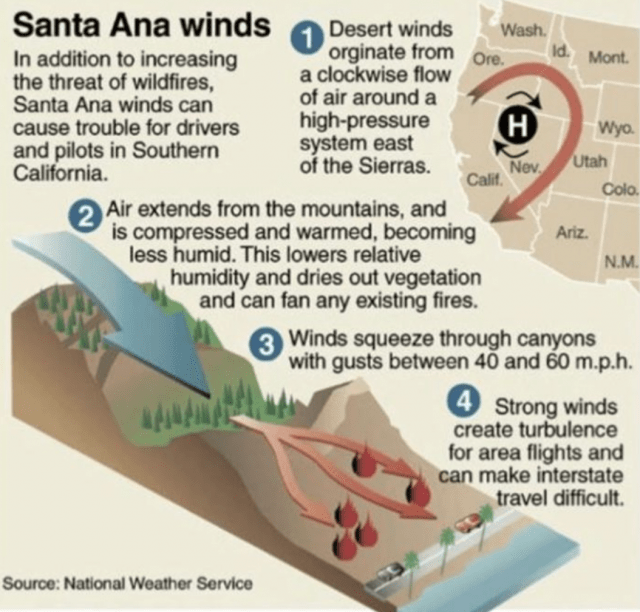
The fire season in the west picked up this month as the föhn winds (Santa Ana especially) gathered in force. It was at the end of the long dry season. Tragically, the fire was deadly. The entire town of Paradise has burned to the ground.
For a scary article describing how the homes of the famous, like Neil Young, Miley Cyrus and Robin Thicke have been destroyed… See here
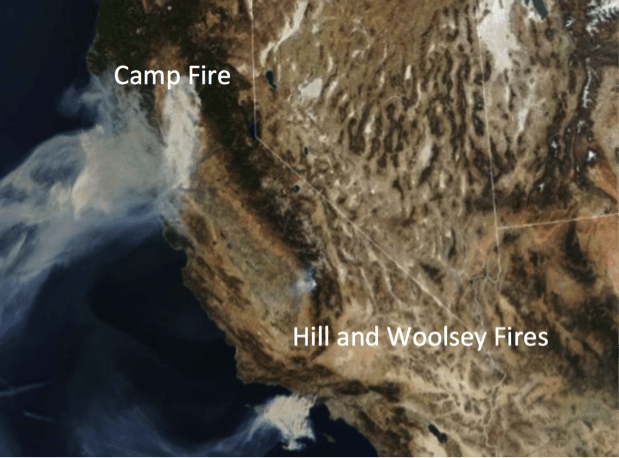
The Camp Fire burning near Chico, California is now the single most destructive fire in state history. And it’s just one of three major infernos raging in the Golden State this weekend as late-season winds pick up and spread walls of flames.
The Woolsey Fire and Hill Fire in southern California are also threatening lives and property, and poised to spread further. Already more than 250,000 people have been forced to evacuate statewide.
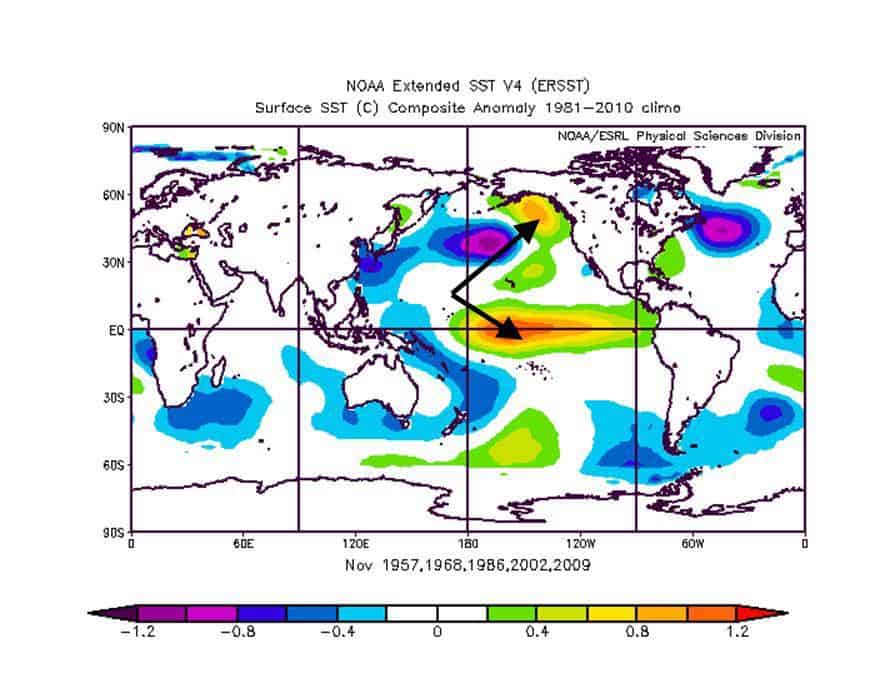
How the California fires could actually enhance a cold, snowy U.S. winter
Ocean temperatures above. The orange oval shaped area in the Gulf of Alaska represents warmer than normal ocean temperatures. This feature and the weak El Nino developing further west (El Nino Modoki) could bring lots of snow and cold to U.S. natural gas and energy areas this winter. The warming in the Gulf of Alaska could actually be enhanced by the forest fires out west and add to a cold U.S. winter as it forces cold air south.
The Camp Fire has so far torched more than 100,000 acres and thousands of buildings since igniting Thursday morning. At one point, it was growing at a rate of one football field per second. The fire has killed at least nine people and incinerated more than 6,700 structures. Paradise, home to 26,000, was almost entirely laid to waste by the fire.
“The town is devastated, everything is destroyed,” California Department of Forestry and Fire Protection (Cal Fire) spokesperson Scott Maclean told Reuters, “There’s nothing much left standing.”
A few weeks ago, we alerted clients to our personal sentiment that higher U.S. interest rates, Trade Tariffs and other factors could result in concerns about a global economic slowdown and recessionary pressures. Copper’s price behavior is often a good gauge as a precursor of the economy’s trend. The recent demise in copper prices could spell trouble ahead.
Current weather issues are not being looked at by traders and hedgers because of worries over global demand, but here is just a partial list of situations that need watching:
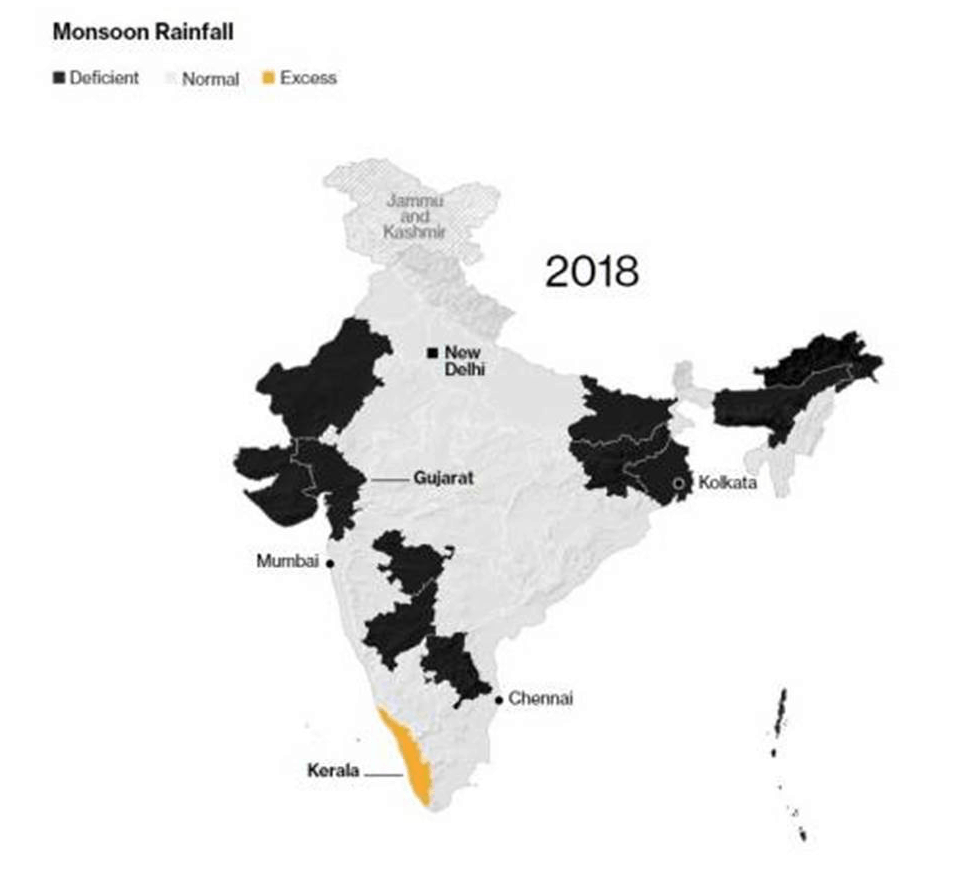
1- Potential lower cotton crop yield in U.S. (too wet Texas/Southeast) and in India (poor end to the monsoon). All eyes will be on Australia’s current lower acreage potential due to their recent drought;
2 – Lower sugar production in Brazil from switching to more ethanol production and wet weather that may impede the harvest;
3 – Dryness in Ukraine and Eastern Europe that is threatening early wheat planting;
4 – Wet weather in Texas and Kansas that has caused some early disease concerns and worries over slightly lower acreage.
The first U.S. wheat crop condition is below the 10 year average due to wet weather. If global weather concerns remain into next spring, then it is possible that a bull market could resume in wheat. Will El Nino form and be strong enough to cause weather issues for crops?Find out here
Florida orange growers have seen their production drop more than 70% the last 5-7 years due to a combination of factors. Citrus Greening has been the big culprit and hurricane Irma did not do Florida citrus growers any favors last year. However, this year, we began predicting last June that Florida citrus growers would likely be safe from any major hurricane disaster. It was certainly a close call, of course, as NW Florida saw one of the worst October hurricanes in modern history.
So why were we bearish orange juice futures several months ago and advise to our newsletter clients a likely fall in prices below the $140 area? Register for our FREE report, here
A 17% rebound this year in Florida orange production (read here)
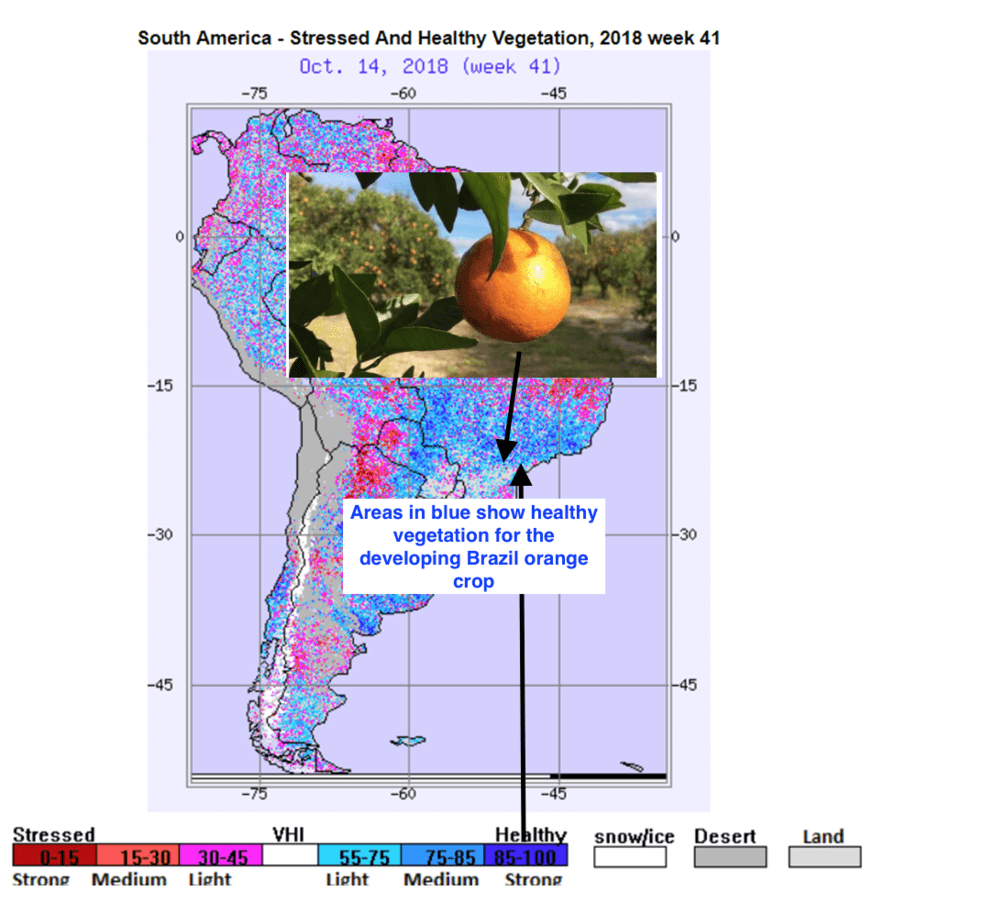
Brazil rainfall has increased during this critical time for the bloom. After a reduction in Brazil production last year, this year’s crop is getting off to a much better start. Brazil, has of course taken over as the #1 producer of Oranges over Florida, many years ago
Demand for orange juice has been falling for years, as more people drink alternative drinks like cocoanut water
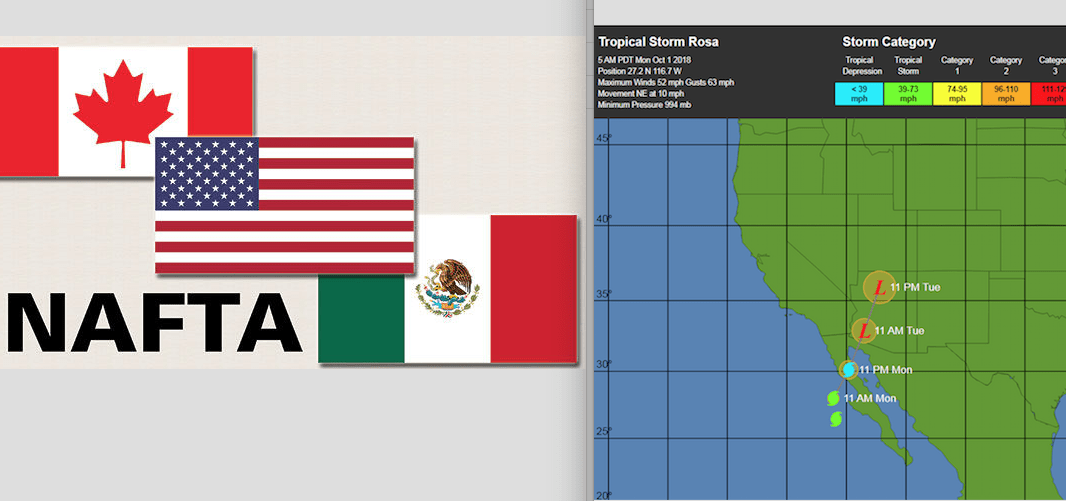
With President Trump’s Political ratings in the tank, even in the midst of a strong U.S. economy and a major rally in the stock market since he took office, it was imperative that some sort of Trade Deal be worked out. The tentative new NAFTA Agreement(article here) with Mexico and not Canada has some agricultural markets perking up early this week.
However, just as important for the corn and soybean market is how quickly the U.S. harvest advances to bring in yet another bin breaking, record crop this year. My bearish attitude in corn and soybeans since summer , on my early forecast for ideal summer weather for crops, was of course helped by the unfortunate set of circumstances surrounding the Trade War with China and other countries. However, this all changed two weeks ago due to my trade signals from our Best Weather Spider, inspired, in part with what could be one of the wettest first half of October’s for Midwest grains in years. A phenomenon called “shattering” could become a serious issue for soybeans in parts of the western and northern corn belt.
October is the key month for the U.S. corn and soybeans harvest
My BestWeather Spider, which gauges the impact of global weather, technicals and Shawn Hackett’s Smart Money indicators with respect to the commitment of traders and other algorithms, is shown below. It began becoming bullish corn and soybeans about 2 weeks ago. Subscribers to our weekly Climatelligence Report (here) will get uncanny weekly weather forecast accuracy and market advice in many commodities.
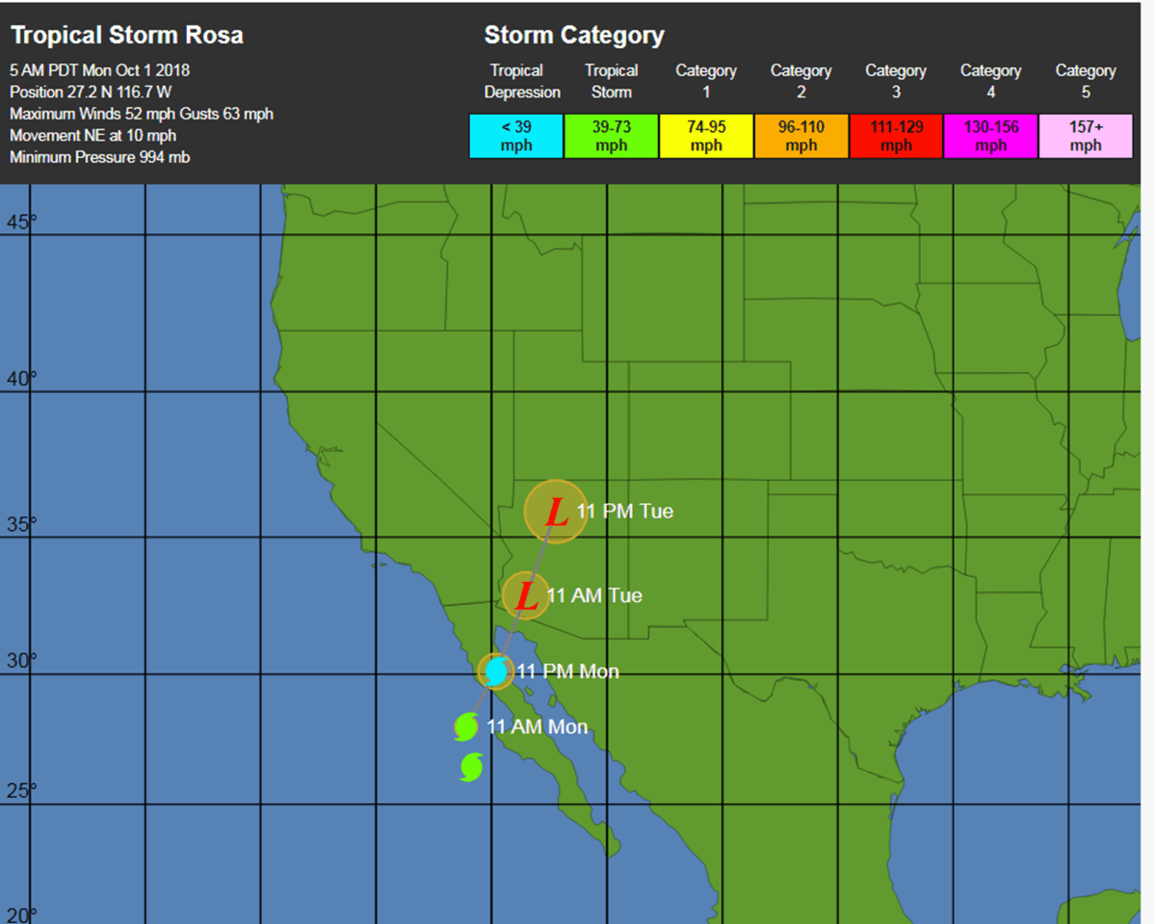
A very wet weather pattern will disrupt in the Midwest corn and soybean harvest for at least another two weeks. This is a scenario we began telling clients in mid September might occur this year. The first meaningful rainfall in months will hit much of the SW U.S. into Colorado and Utah this week. This is inspired by Tropical Storm Rosa. In fact, the season’s first snow could fly in some ski areas across the west by this weekend. While too early for ski slopes to open, of course, it could be a prelude to an early winter out west.
Besides the remains of Tropical Storm Rosa, our in house weather models and historical research point to other climatological factors that could cause upwards of 4-8″ of rain the next 2 weeks in the heart of the Midwest corn and soybean belt. We tend to be quite early and often ahead of the crowd when it comes to second guess models. Hence, you will want to stay abreast of our forecasts, because any sudden change to dry weather and improved harvesting activities for corn and beans, could send this market reeling south again. However, for the next week or two at least, we look for corn and soybeans to be well supported on this wet weather idea.
Rainfall projections in inches the next 10 days or so, is consistent with our forecast made in mid September. This will be a benefit for U.S. wheat planting as the drought in the Plains is breaking. However, it will cause potential major concerns for parts of the northern and western Midwest corn and soybean harvest.
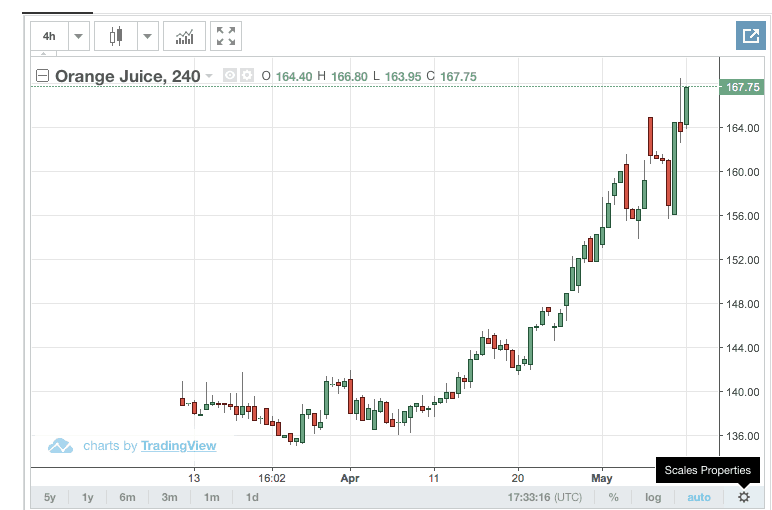
Orange juice futures are one of the most volatile commodity markets. “OJ” contracts are also quite illiquid. The chart below shows a 23% price increase since the end of March. This up move is in the face of reduced global demand for OJ, thanks to diet fads and alternative beverages (think coconut water), that have been in vogue in recent years. With demand fading, it takes a reduction in Brazilian orange production to get any semblance of a bull market underway. Citrus greening in Florida has practically destroyed the Sunshine State’s orange industry. While this has occasionally resulted in a sharp rally, I believe the current spike stems from last October’s dry weather. Despite Brazil’s record 2017 crop, production could fall sharply as new estimates flow in from the harvest’s progress.
For a recent report that likely influenced the run up in OJ futures, please click here
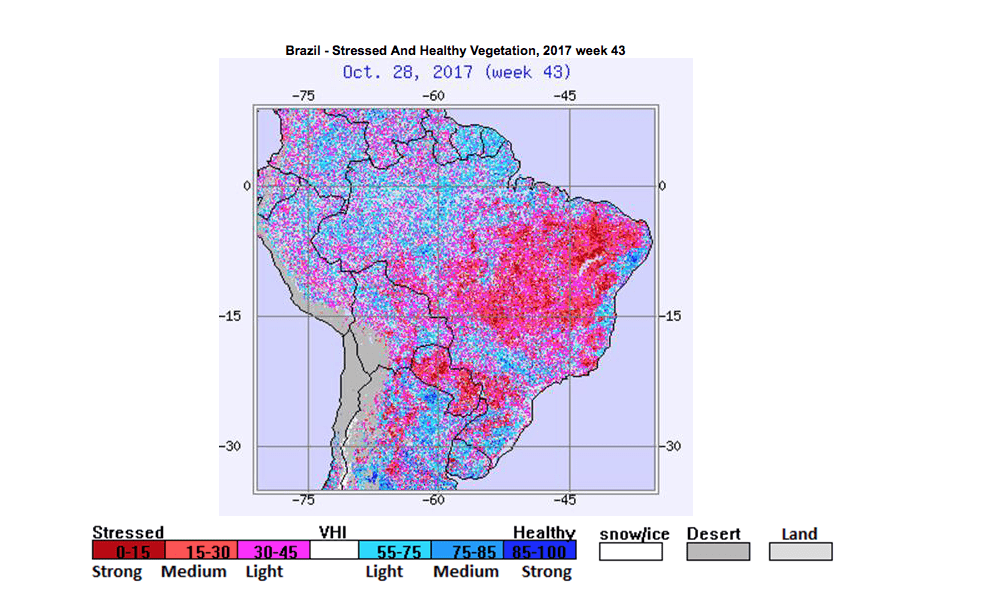
The map below shows last October’s heat and drought stress in Brazil. Certainly, coffee trees and buds have various growth cycles, thus affording them more opportunity to recover. This is not the case with oranges in years having a hot (and dry) October. Combine this with the above-mentioned citrus greening, now also affecting Brazil, and it is possible that OJ prices could rise even further. The price strength will be even more acute if Florida experiences an active hurricane season this year.
HELPING YOU MAKE THE BEST INVESTMENT DECISIONS BASED ON THE WEATHER
We use cookies to ensure that we give you the best experience on our website. If you continue to use this site we will assume that you are happy with it.OkPrivacy policy