Click on the video above to see how various climatic factors will affect winter weather and the natural gas market.
Discounts are available for small traders and farmers. Find out, how one trade alone, such as being short natural gas in early November pays for my newsletter for two years.
PAST PERFORMANCE IS NOT INDICATIVE OF FUTURE RESULTS AND THERE IS ALWAYS A RISK OF LOSS IN COMMODITY TRADING.
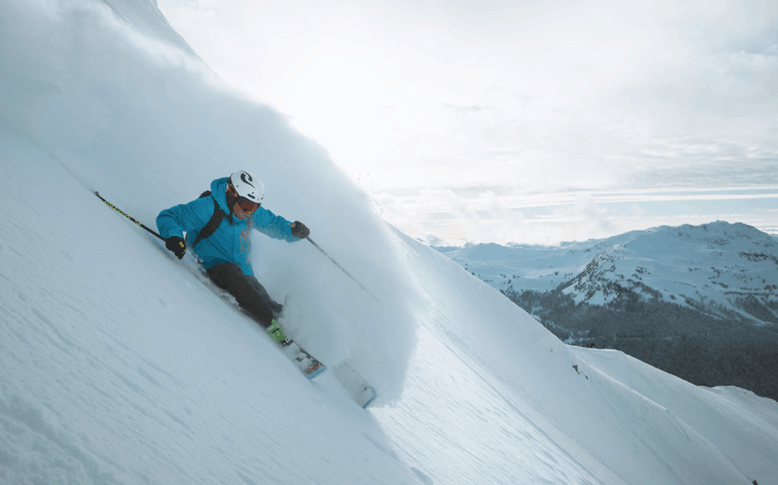
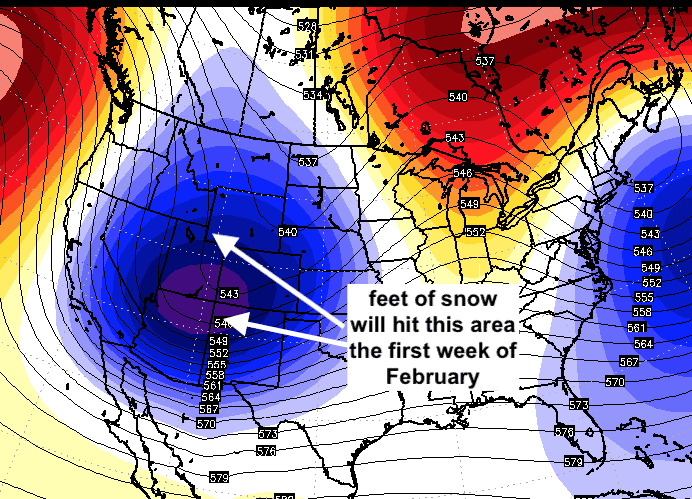
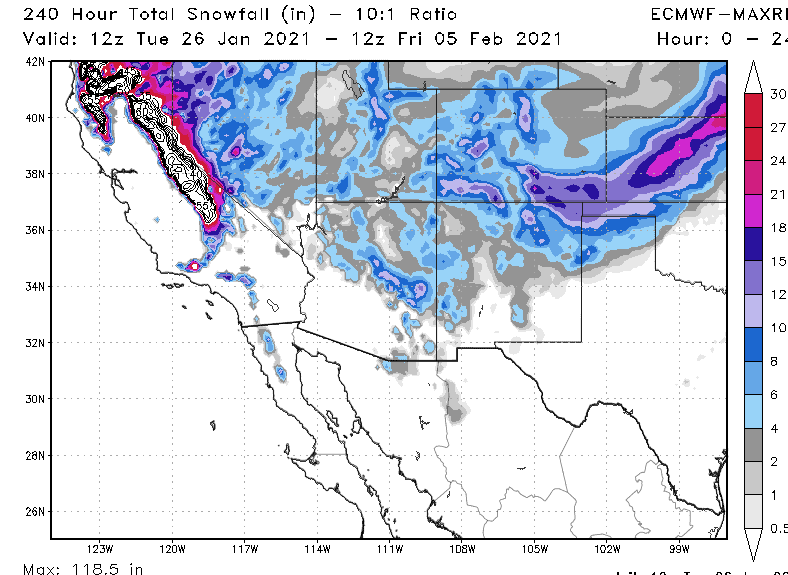
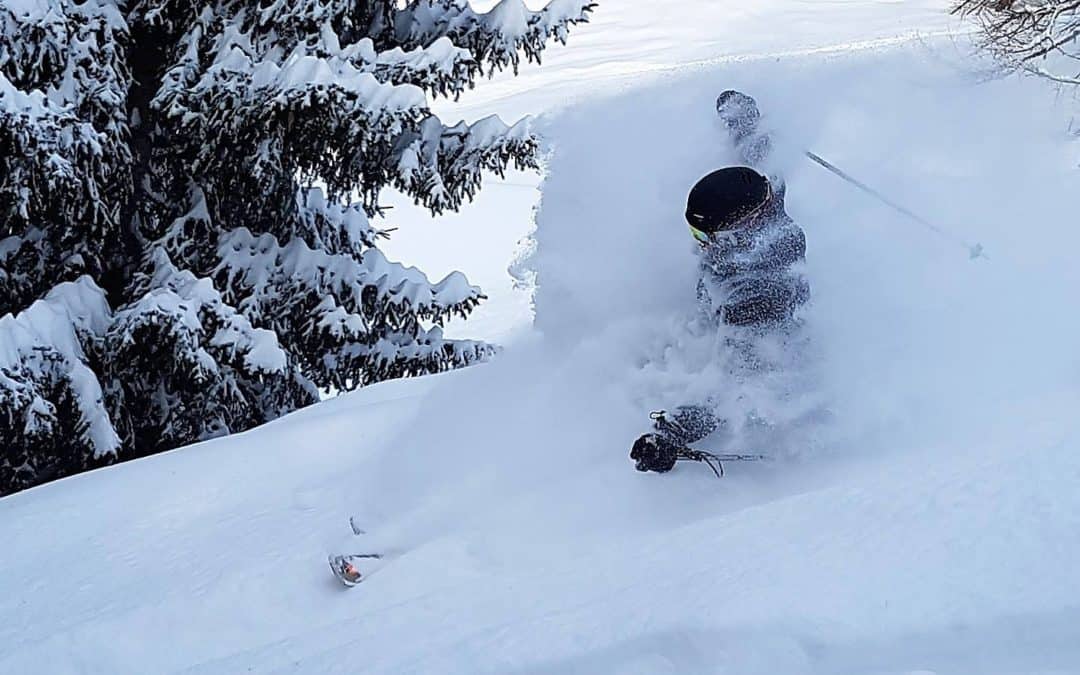
While many ski areas are only 25-50% of capacity due to COVID-19 restrictions, the upcoming two snowstorms for the western US may be one for the record books. Drought conditions have plagued many ski areas from Utah to Colorado and the Southwest but a major change in the weather pattern for the first week of February will bring feet of snow to the west.
Ski areas such as Telluride, Colorado; Taos, New Mexico, and many others in the area shaded in blue (huge storm) could see 2-4 feet of snow the first week of February greatly improving ski conditions and easing droughts in some areas.
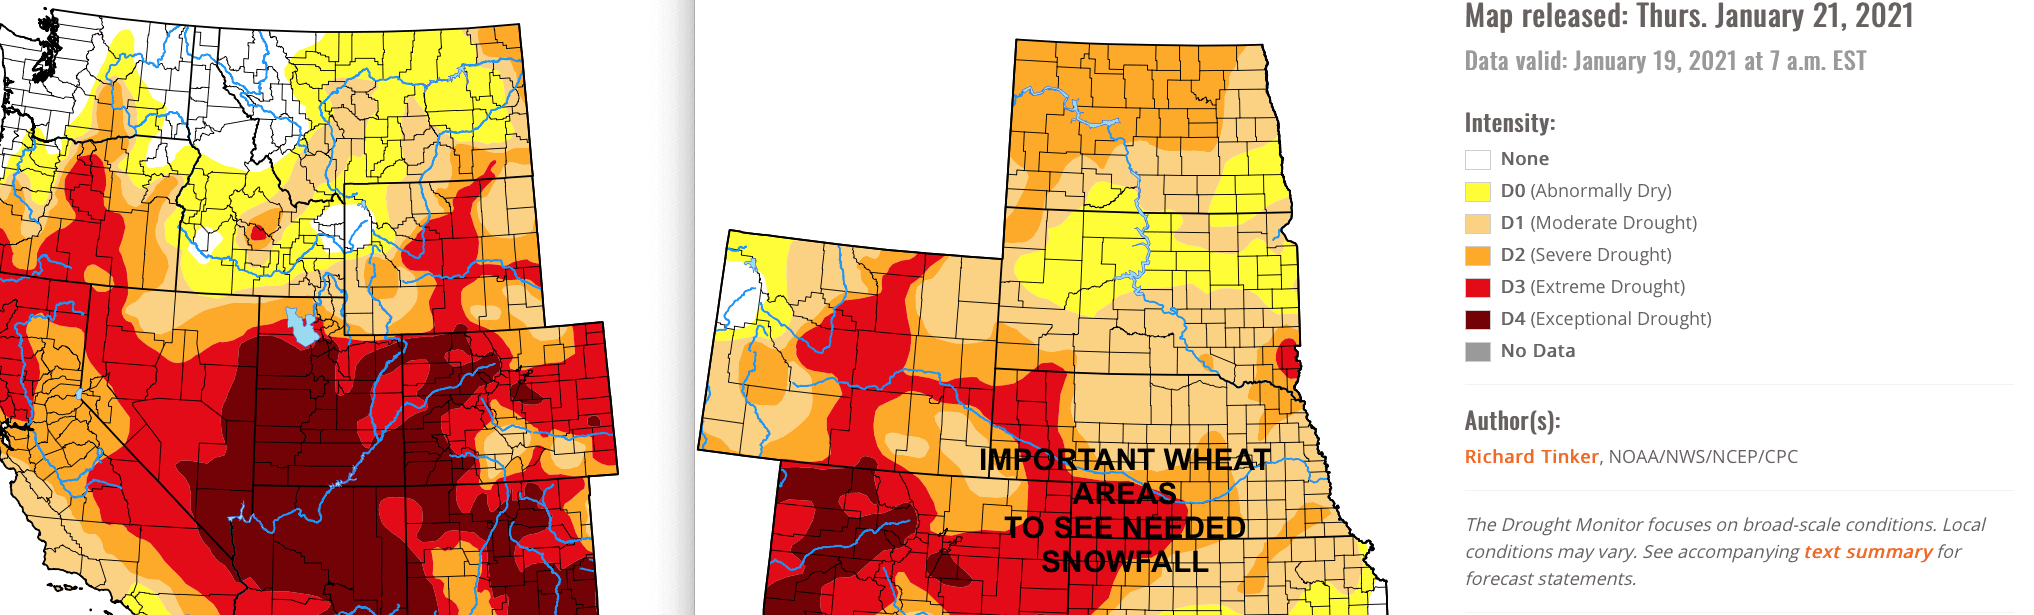
The huge storm next week will put at least a partial dent in the western drought. If this continues through spring that would be good news for farmers from Kansas to the Dakotas, Iowa, Colorado, and Nebraska which have been suffering from drought.
Some of these drought areas will see important snows well into early-mid February easing drought conditions a bit.
La Nina and How February ski area snowfall may give cluesFOR SPRING/SUMMER WEATHER PATTERNS
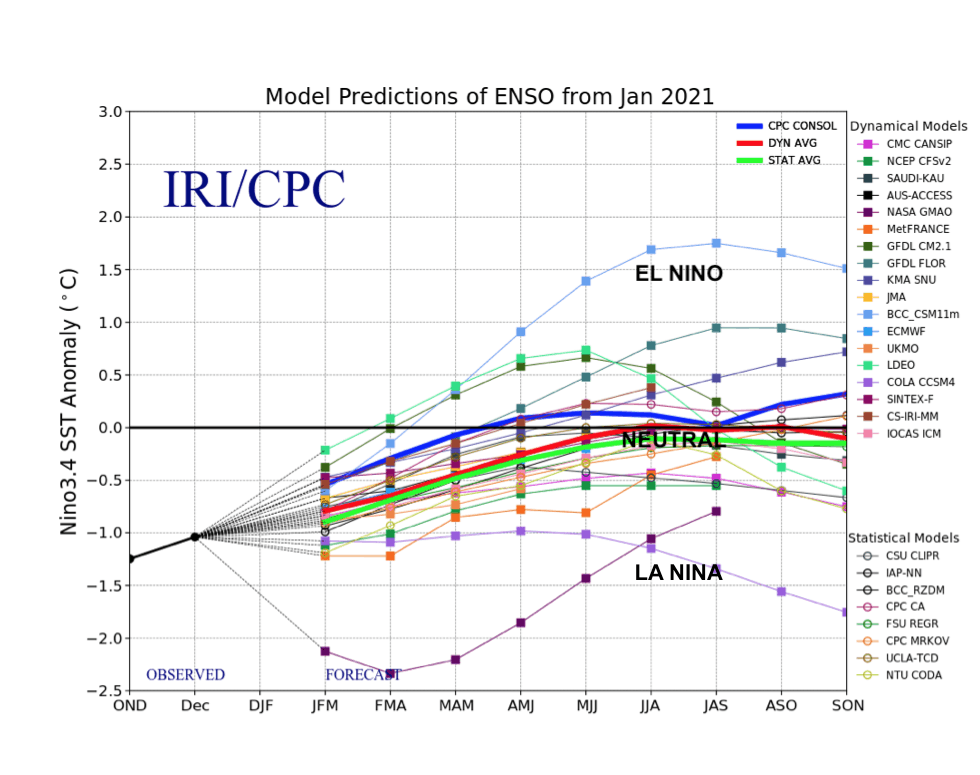
Most computer models (above) show La Nina weakening to neutral by summer. This will be very important for the grain market and other commodities, but there are one or two models that disagree and suggest La Nina continuing into spring and early summer. If this is the case, drought conditions could hit key US wheat, corn, and soybean growing areas.
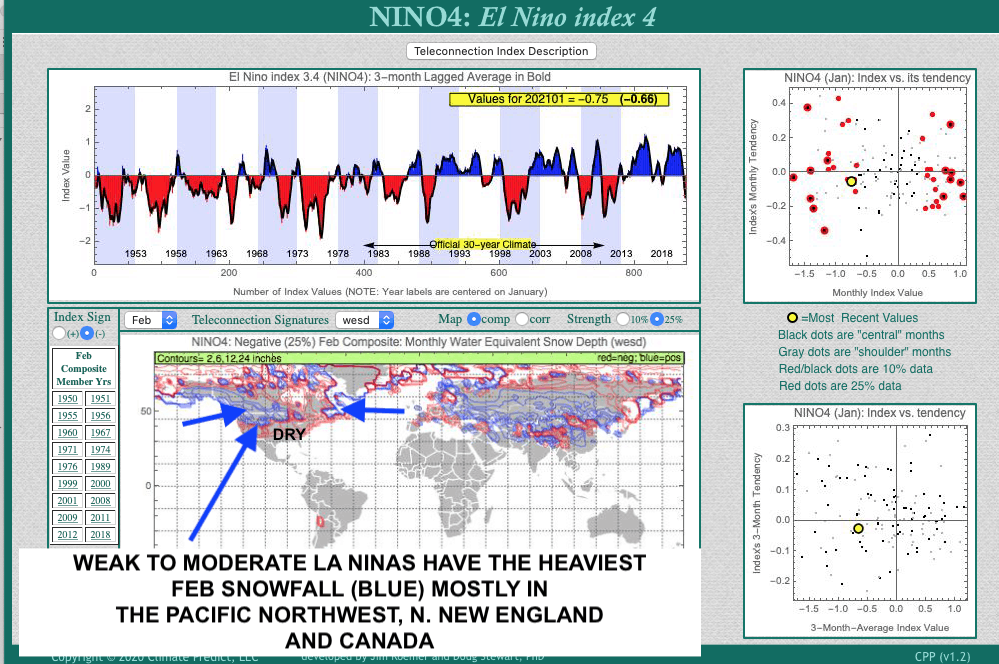
WEAK-MODERATE LA NINA AND FEBRUARY SNOWFALL
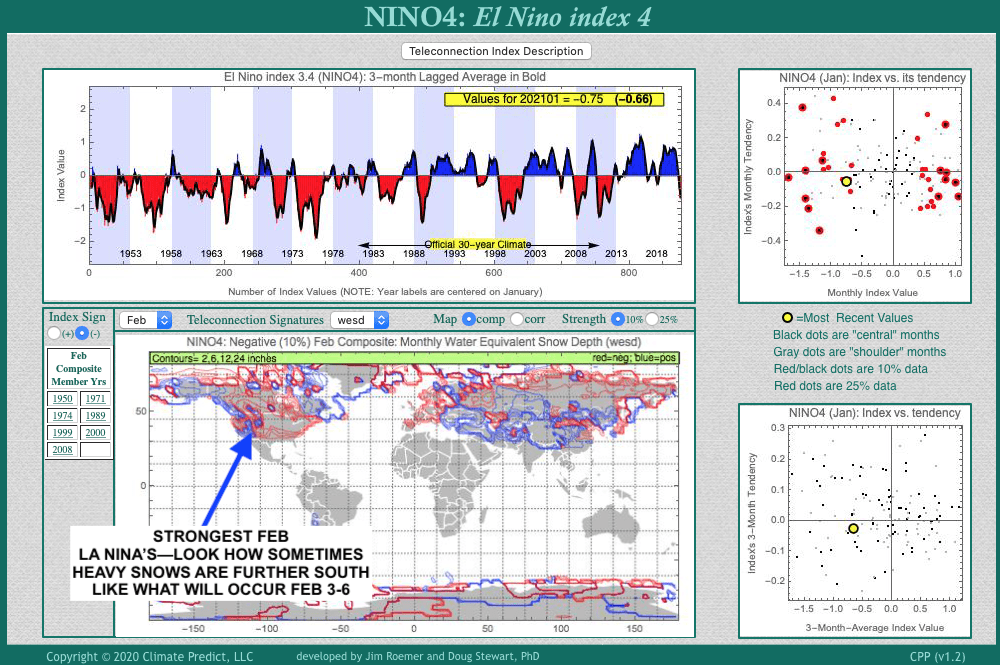
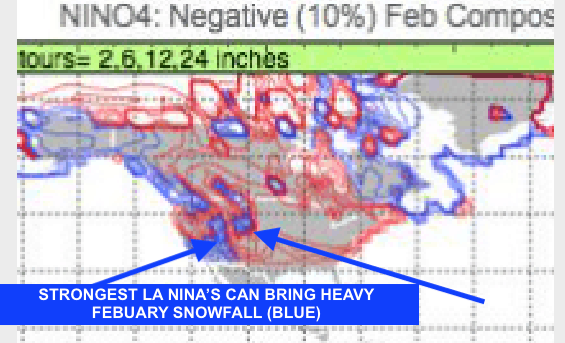
But notice what happens sometimes with strong La Nina’s; look how much further south the heaviest February snows can sometimes be.
STRONGER LA NINA OFTEN HAS HEAVIEST SNOWFALL FURTHER SOUTH INTO ARIZONA AND New Mexico IN FEBRUARY
Notice the LA NINA analog years on my in house weather forecasting software (ClimatePredict). The years here are 1950, 1971, 1974, 1989, 1999, 2000, and 2008.
Which ones will verify for this spring and summer and what is my feeling about the grain and other markets based on this? I suggest you subscribe for just $13 to my Climatelligence monthly newsletter to get a lot of interesting weather and commodity information and long-range forecasts.
Take a free look above (click on the picture)
Anyway, a closer look at my models above shows February snowfall during the strongest La Nina events
A closer zoomed-in look is very similar to what will happen next week. Hence, this may be a sign that La Nina is even stronger than forecasted. Hence, La Nina may persist longer into the spring or early summer than some forecasters feel,
The dry La Nina winter out west and how that will be changing
Models tend to under-estimate snowfall for the higher elevations of ski resorts. I have been forecasting for some of the nations’ top ski areas for nearly 20 years. The map below shows projected inches of snowfall through February 5th. Notice the important snows for Kansas wheat areas. You can see from Utah, Nebraska, most of Colorado, and even N. New Mexico, snow forecasts by the European model is anywhere from 6-18″; the heaviest snowfall forecasted appears over southern Colorado at places like Silverton, Telluride, and others.
However, I look for snowfall to be much heavier than this—possibly 2-4 feet from southern Utah to New Mexico and most of Colorado by February 5th.
Most La Nina’s bring poor ski conditions to southern Colorado, California, parts of Utah, and the Deep South, such as Taos, Nee Mexico, and more. Look how many ski areas have seen below-normal snowfall so far this winter. The Pacific Northwest and British Colombia have seen above-normal snowfall, which is typical for La Nina.
Area
Season Snow
Pct. of Normal
Pct. of Area Open
Squaw 8,000
102
71%
71%
Alpine Meadows
80.5
65%
58%
Mt. Rose
73
69%
79%
Heavenly
68
50%
70%
Kirkwood
80
50%
94%
Mammoth
57.5
46%
64%
Southern Cal
32
91%
0-76%
Arizona Snowbowl
31
37%
44%
Pacific Northwest: Crystal, Mt. Hood and Mt. Bachelor reported minimal snow through the first week of November. But it dumped heavily the rest of November. The first week of December was dry but it snowed 5-7 feet over the rest of December, yielding base depths of 10 feet at Mt. Baker and 5-7 feet elsewhere. During the first week of January it dumped 3 feet in Oregon and 5+ feet in Washington and at Whistler.
Area
Season Snow
Pct. of Normal
Pct. of Area Open
Whistler
230
127%
95%
Crystal Mt.
180
107%
100%
Stevens Pass
251
130%
97%
Mt. Hood
192
105%
100%
Mt. Bachelor
179
113%
100%
Canadian Rockies and Interior B.C.: October snowfall was significant only in this region, with gradual additions in early November but more through the rest of the month. There was 4-6 feet of consistent snowfall in December. Sun Peaks and Silver Star have been 90+% open since mid-December. Western Canada had the best holiday conditions on an average base of 5 feet. The early January Northwest storm dropped about 2 feet at most areas but only a foot around Banff.
Area
Season Snow
Pct. of Normal
Pct. of Area Open
Big White
117
91%
97%
Lake Louise
123
164%
97%
Sunshine
205
196%
92%
Revelstoke
171
103%
91%
Kicking Horse
140
123%
94%
Red Mt.
101
93%
97%
Whitewater
142
98%
100%
Fernie
167
110%
81%
Castle Mt.
167
146%
94%
U. S. Northern Rockies: Montana had October snow but mostly east of the Continental Divide, 45 inches at Red Lodge. Great Divide opened a couple of runs with snowmaking assistance Oct. 31 but lost them to warm weather the next week. Second week of November it snowed 3-4 feet in Montana and Wyoming and 2 feet in Idaho. It snowed 1-2 feet during the second half of November. December snowfall was 5 feet in the Tetons and 3-4 feet elsewhere. Holiday base depths were 4+ feet in the Tetons, but averaged 3 feet elsewhere. Bridger opened late and Big Sky was only 55% open at New Year’s, 73% now. Sun Valley is 76% open. The early January Northwest storm snowed about 2 feet in Idaho and the Tetons and one foot in Montana.
Area
Season Snow
Pct. of Normal
Pct. of Area Open
Grand Targhee
179
95%
100%
Jackson Hole
143
93%
83%
Schweitzer
113
98%
100%
Lookout Pass
146
81%
100%
Brundage
94
78%
100%
Utah: Utah was extremely dry in October but got 2+ feet over the first weekend of November and a similar amount through the second week. There was less than a foot during the second half of November and first week of December but it snowed 4-5 feet in the Cottonwoods but less than 2 feet elsewhere during the rest of December. Holiday base depths were close to 4 feet in the Cottonwoods but barely 2 feet at other Utah areas where open terrain remains severely limited after just a few inches last week.
Area
Season Snow
Pct. of Normal
Pct. of Area Open
Alta
143
93%
95%
Snowbird SNOTEL
147
87%
90%
Brighton/Solitude
110
63%
67%
Park City (mid estimate)
62
57%
33%
Snowbasin
74
64%
59%
Brian Head
50
45%
13%
Northern and Central Colorado: This was possibly the first October in over 25 years with no ski area open despite a late October storm averaging 10 inches. The dry summer may have limited water for snowmaking at A-Basin and Loveland. Keystone opened Nov. 6, A-Basin Nov. 9, Breckenridge and Loveland Nov. 13. November snowfall was below average so with social distancing requirements Copper opened Nov. 30, Steamboat Dec. 1 and Winter Park Dec. 3. December snowfall was 2-4 feet but overall only about half of terrain was open for Christmas. Advanced terrain remains very limited with base depths at many areas still under 3 feet after just a few inches last week. A-Basin is 31% open.
Area
Season Snow
Pct. of Normal
Pct. of Area Open
Beaver Creek
87
70%
79%
Breckenridge
87
70%
37%
Copper Mt.
62
58%
53%
Keystone
85
93%
77%
Loveland
84
68%
27%
Steamboat
88
62%
84%
Vail
84
62%
90%
Winter Park
120
90%
84%
Southern and Western Colorado: A late October storm dropped 13 inches at the Gothic Snow Lab and 22 inches at Monarch and Taos. Wolf Creek got 39 inches in October and with localized southwest storms reached 98% open by November 15. The rest of the region had a below average November and all had a dry early December. It snowed an average 4 feet during the rest of December but little so far in January. Wolf Creek has a 5 foot base. At most other areas base depths average 3 feet so it may be a while before most steep terrain opens. Taos is 74% open on a 42-inch base.
Area
Season Snow
Pct. of Normal
Pct. of Area Open
Aspen/Snowmass
87
70%
79%
Gothic Snow Lab
76
60%
N/A
Crested Butte
72
79%
58%
Monarch
69
68%
97%
Telluride
70
71%
72%
Purgatory
69
73%
82%
Wolf Creek
164
118%
100%
Northeast: Northern Vermont got 1+ foot at the start of November but most of the month was warm. Thus openings were delayed to Nov. 13 at Killington and Nov. 21 at Sunday River and Sugarloaf, with social distancing also being a factor. Early December progress was slow with mixed snow and rain resulting in low trail counts. The mid-December Nor’easter hit southern New England hard but did not snow much farther north. Trail counts were reduced by heavy rain over Christmas. 2016 was the only year in over 20 years with less Northeast terrain open at New Year’s. There has been some expansion during the first week of January though with no more than a foot of new snow. Percents open: Okemo 55%, Hunter 46%, Sunday River 44%, Sugarloaf 29%, Tremblant 62%, Ste. Anne 45%.
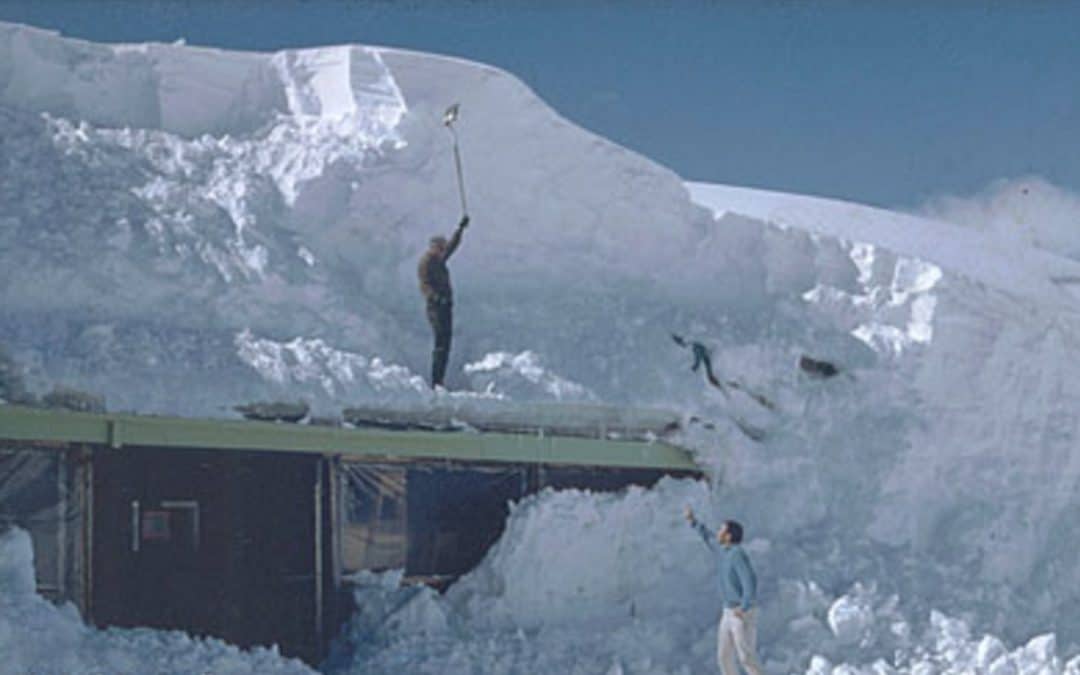
A return of very snowy conditions will be the rule for western ski areas as well as parts of the Plains and western corn belt heading into mid-April. A year ago, places like Snowbird, Utah to Jackson Hole, Wyoming had incredible, early spring ski conditions. More than 400″ to 450″ of snow fell last winter due to a combination of weak El Nino conditions and lower solar activity.
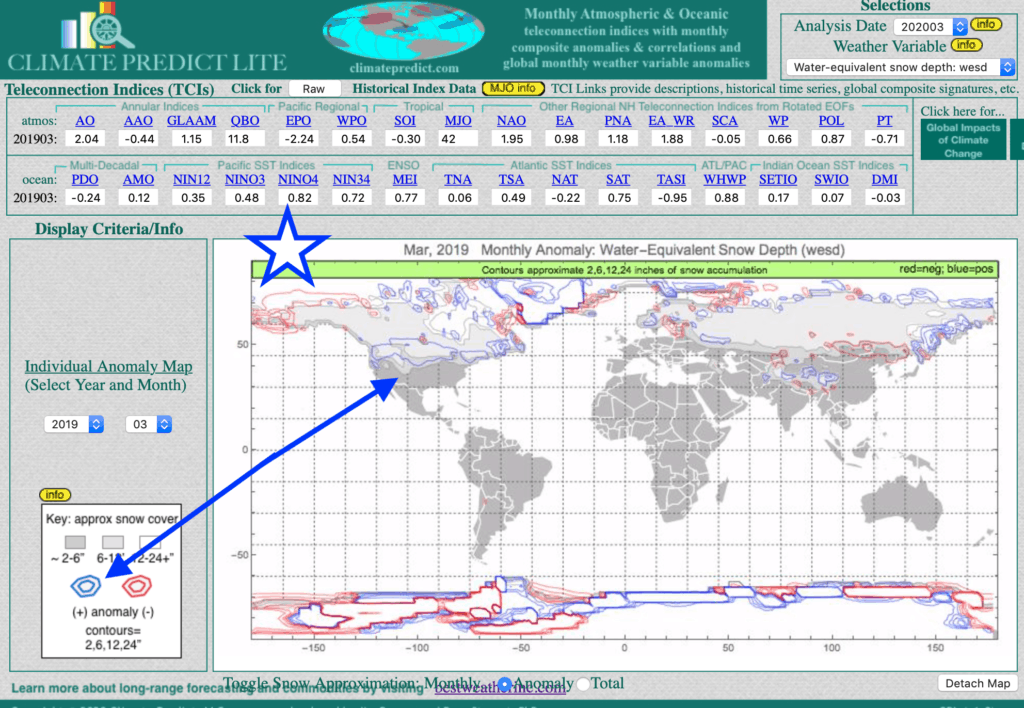
Notice the blue areas and above normal snow-pack in March, 2019 across much of the west into the Dakotas and Canada. The above normal snow-pack and spring-time rains resulted in major flooding and planting delays for corn crops from Iowa to the Dakotas and Minnesota.
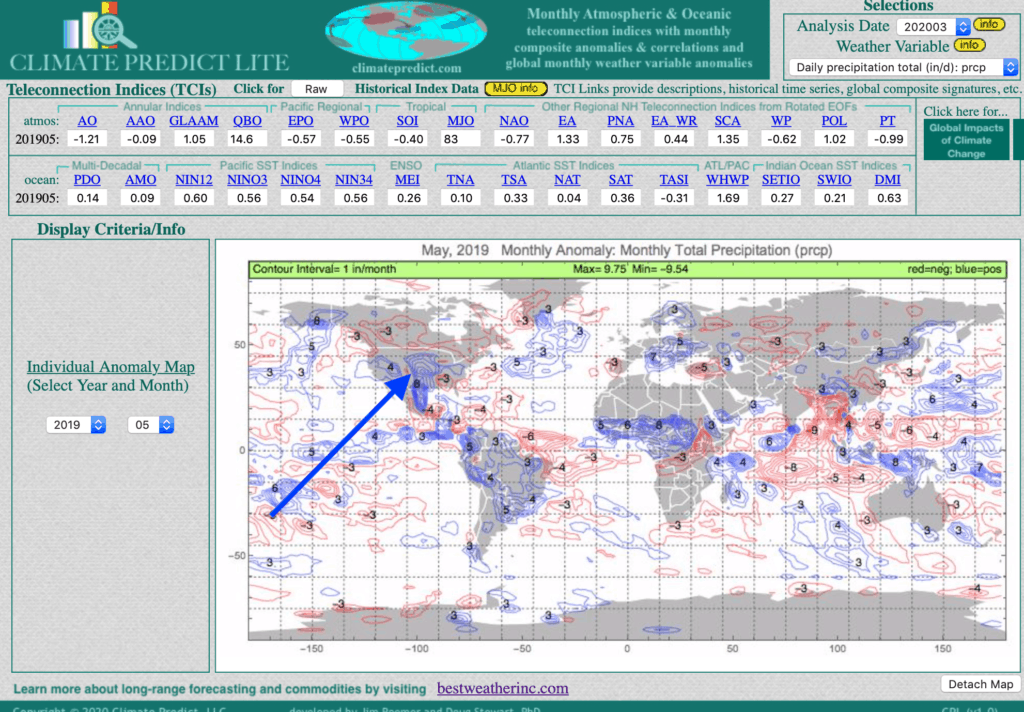
The map above illustrates that by May, 2019, near record rainfall (blue) plagued western Midwest farmers. This was a bullish aspect for the corn market into early June. Then a cooler, drier summer helped corn yields recover and corn prices fell. What will happen this spring and how does one trade the grain market? Find out here.
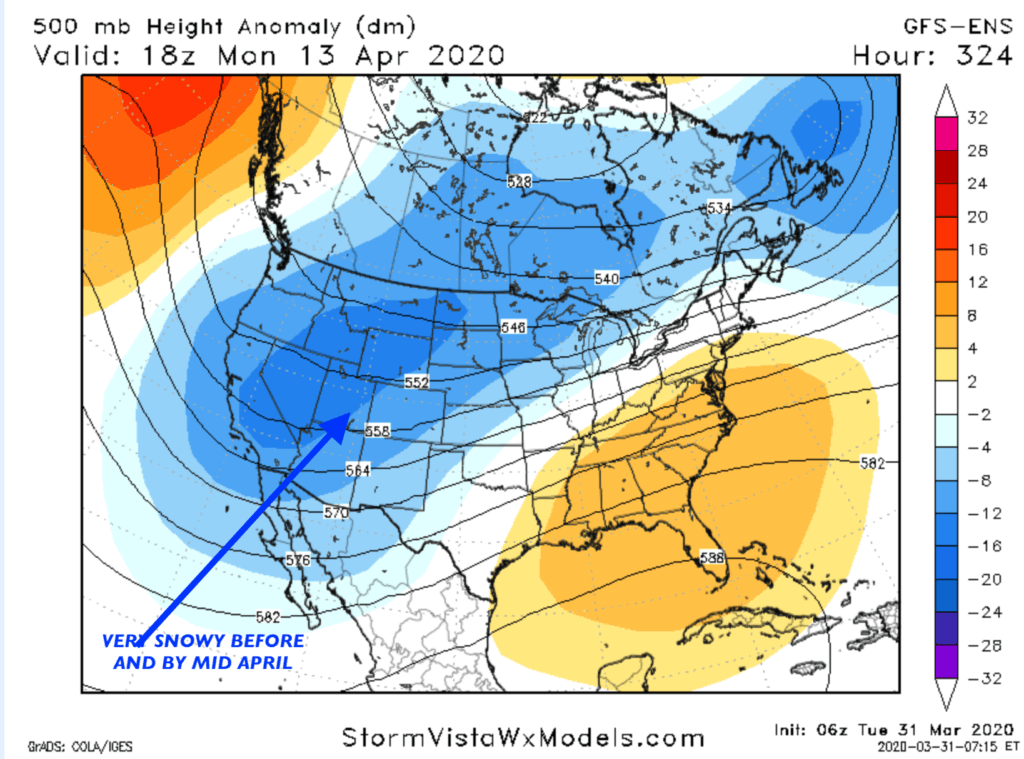
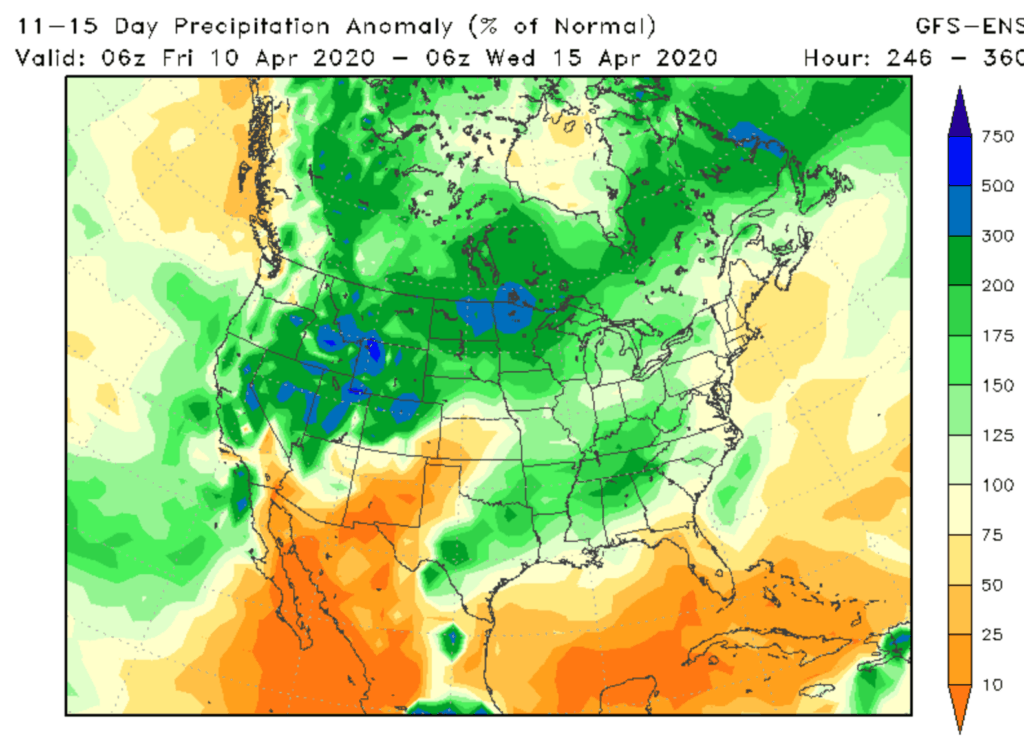
Now onto this April. We can see a major trough hitting the west in about a week or so. This will bring feet of snow to many western ski resorts, while the eastern US continues to experience a warm winter and early spring (key factors in pressuring natural gas for 4 months).
You can see the above normal rainfall over much of the West heading into mid-April. The question many farmers are asking me, ‘Will this slow corn planting again?” After all, given coronavirus and lower crude prices, which are pressuring ethanol and corn prices, it may take a wet spring to get the corn market out of the doldrums.
A very wet pattern heading into Mid-April. Notice precipitation forecasted as much as 300% or more above normal (regions shaded in green and blue)
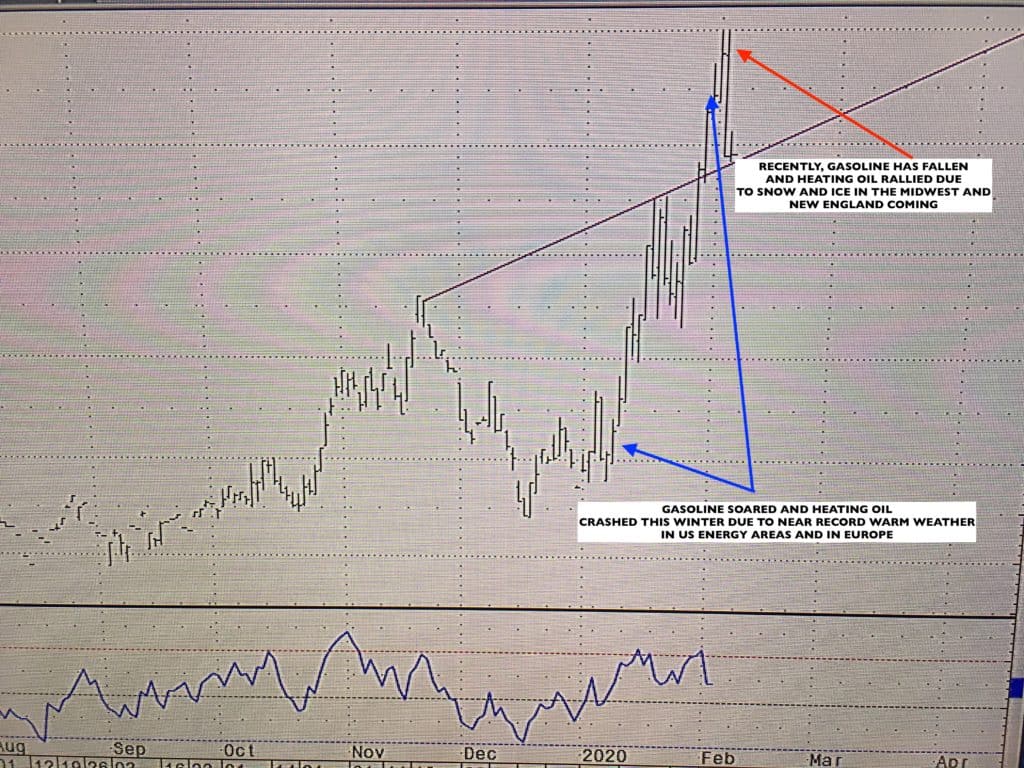
One of the biggest weather related trades in commodities this winter has been short the natural gas market (UNG). However, selling heating oil against long gasoline (for protection) had resulted in a move of over $8,000 a contract the last weeks; until the last few days.
There is sometimes a correlation with snows for Northeast ski resorts and the heating oil market rallying. When big snowstorms and cold weather limit travelers from driving, gasoline prices can sometimes fall and heating oil prices rally. This has happened the last few days. Prior to this week, record warm weather and less global demand helped heating oil prices collapse while gasoline prices soared (as the chart shows above).
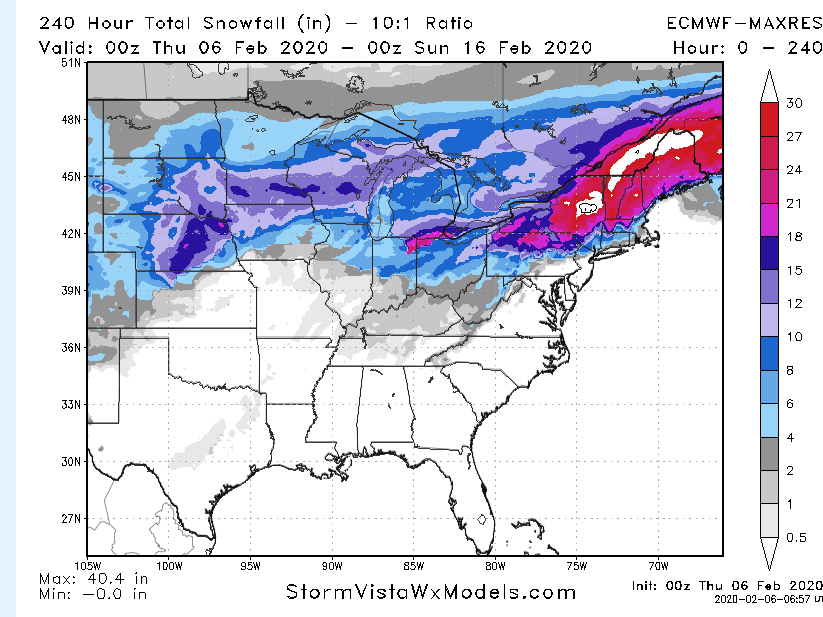
We will see up to 3-4 feet of snow from at least 2 and possibly 3 New England snowstorms over the next 2 weeks. The first big one will hit areas like Jay Peak, Stowe and Killington, Vermont with 1-2 feet as well as parts of northern New Hampshire and Quebec.
Areas in white show the potential for up to 3 feet of snow in New England the next 10 days. Even central New England will see at least a foot or two improving ski conditions.
Trading Snowfall and Other Weather Variables
There is a relatively new web site that lets a meteorologist or weather enthusiast trade their predictions of snowfall, rainfall or temperatures. It is called TradeWx.com You can find out more information at this link
This is a great way for traders to get their feet wet, first hand, trading weather. Tradewx.com will give participants $25 to fund their account for FREE.
tradewx.com
Ski Season Sub-Par in New England will get a Big Boost
The ski season so far has been sub-par in New England due to the warm winter. This is something I forecasted more than 2 months ago. But a big improvement is on the way for central and Northern New England for a week or two.
To see a full report of the New England ski season conditions so far, please see the excerpt below from www.bestsnow.org
AS OF LATE JANUARY
Northeast: The first openings were Killington Nov. 3, Mt. St. Sauveur Nov. 8 and Sunday River Nov. 9. Early November weather was favorably cold but there was mixed precipitation late in the month. Terrain expanded some in early December with 1.5 feet of new snow. Rain on Dec. 14 depressed trail counts. There was some recovery before Christmas, but a tough holiday week with some freezing rain. Conditions in early January improved with 1-2 feet of new snow, but it rained the second weekend. Conditions improved with up to 2+ feet of snow over MLK weekend. Percents open: Hunter 66%, Okemo 71%, Sunday River 91% and Sugarloaf 59%, Tremblant 86%, St. Anne 100%.
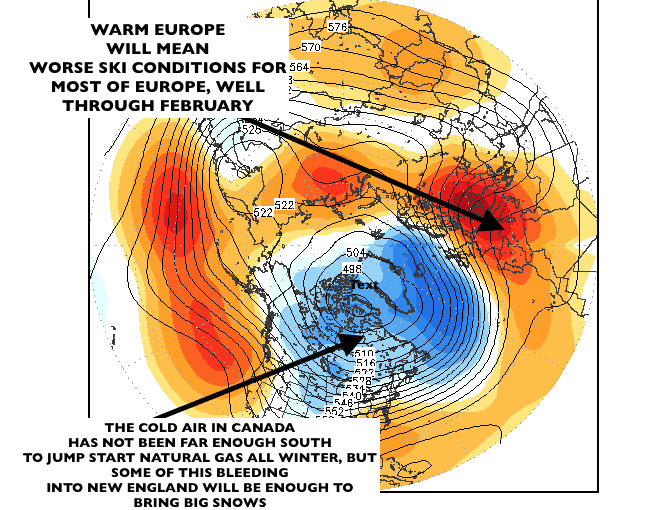
I have been discussing weeks for some energy and ski clients, why certain climatological parameters would likely bring warm weather, not only to the main US natural gas and heating oil areas, but also for much of western Europe.
Indeed, we have seen natural gas prices break some 20% over the last few weeks, while heating oil is under pressure versus the rest of the crude complex that has been pumped up by Iran-Iraq-US military tensions.
JET-STREAM FORECAST PREDICTED IN EARLY DECEMBER THROUGH MID-LATE JANUARY,2020
I still look for feet of snow for many western ski resorts the next 2 weeks or so with places like Whistler, Mt. Hood, Big Sky Montana and Jackson Hole getting into the action. The Lake Tahoe region to Utah will also get at least a couple feet of snow. Very cold temperatures will finally lower freezing levels in British Columbia, which was short changed on snowfall through most of December. The colder temperatures mean much higher snow:water equivalent ratios. Hence, some areas out west could see 3-5 feet of snow the next 2 weeks.
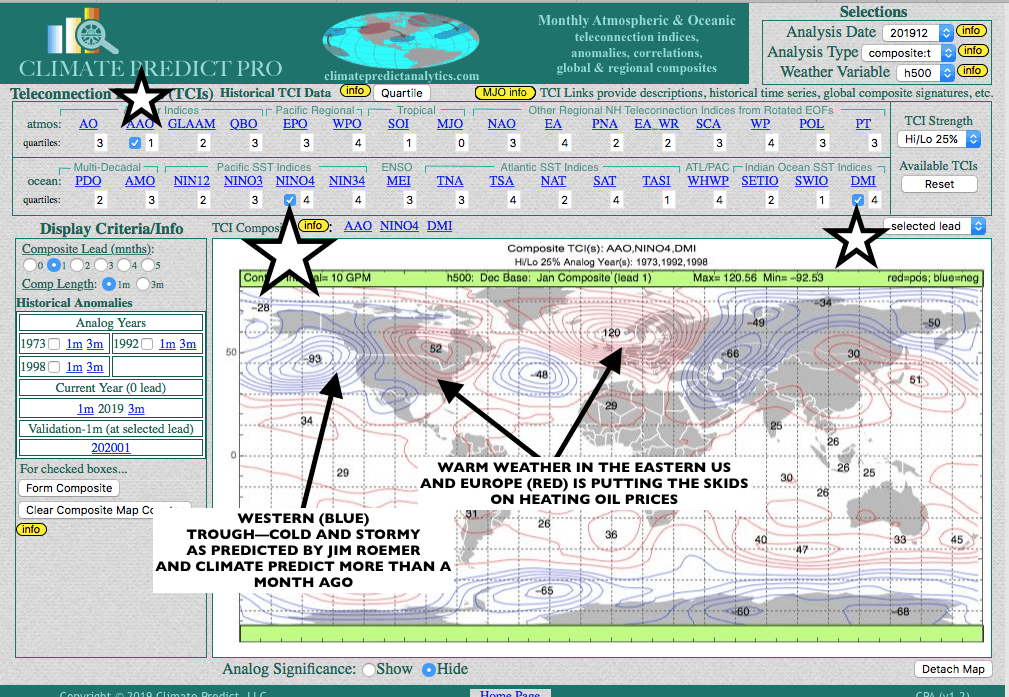
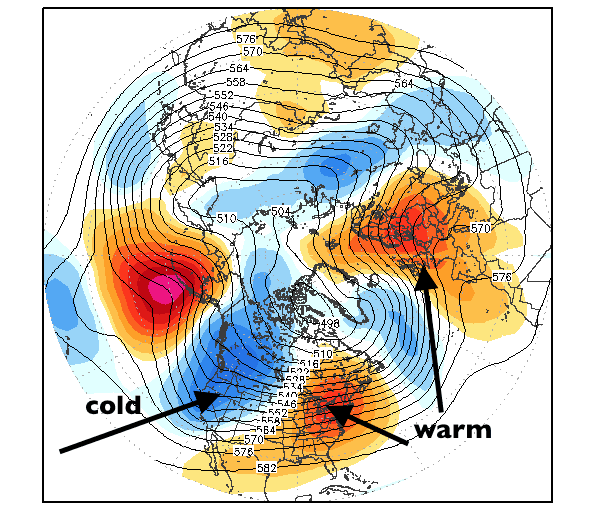
The stars and arrows on CLIMATEPREDICT (above) are the climatological variables that we used to predict the mild, early, eastern winter and cold and story out west. They are a negative AAO index, the positive Indian Dipole, responsible for the fires and extreme heat in Indonesia and particularly Australia, and also a warm NINO34, in which El Nino conditions persist in the western Pacific. While El Nino is weak, this is not something NOAA or many other firms are talking about.
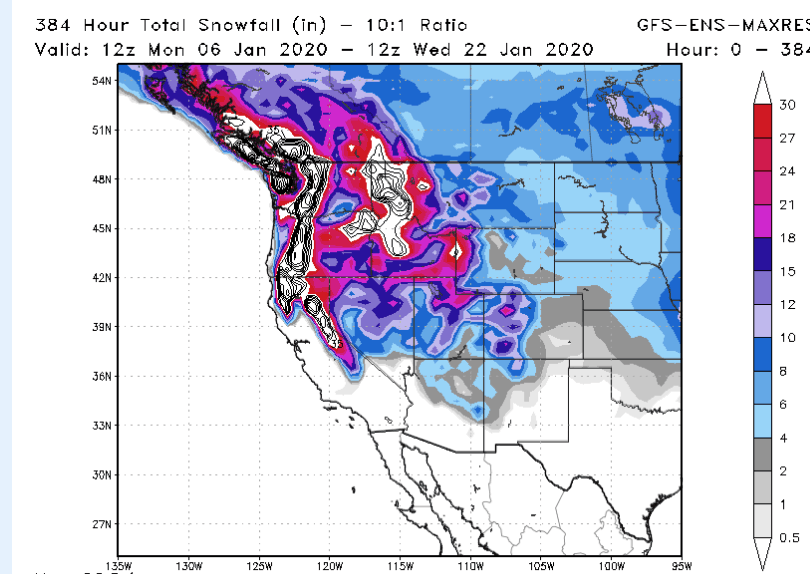
Estimates snowfall through January 22nd. The areas in red represent at least 2-3 feet of snow. However, I believe that some of these areas may see 3-5 feet or more
You can see the jet stream pattern from short term weather forecast models. Again, this is something that CLIMATEPREDICT predicted more than a month ago.
The blue region represents cold temperatures. In fact, parts of the Pacific NW and western Canada will be as much as 15-20 degrees below normal, well into Mid January. The NW flow is ideal for snow in Oregon, British Columbia, Idaho, Washington State and places like Jackson Hole; not just for Tahoe to Utah and Colorado, which saw decent December snowfall.
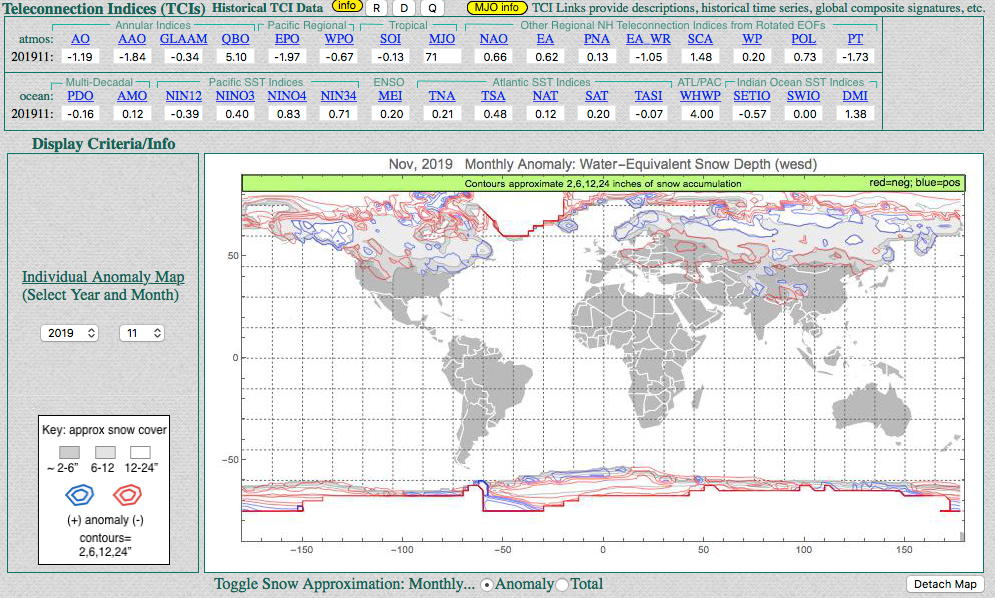
I have a new weather feature that can be accessed for FREE by amateur and professional meteorologists, ski resorts, university science professors and anyone that is a snow lover, or hater. It is called CLIMATE PREDICT (lite version) HISTORICAL SNOW MAPS.
This snow feature will allow anyone to search a 70 year data base for any month of their choice and to see how global teleconnections (such as El Nino, La Nina and ocean temperatures thousands of miles away) influence global winter snow cover. If you are interested in receiving FREE access, check back soon for details or email me at
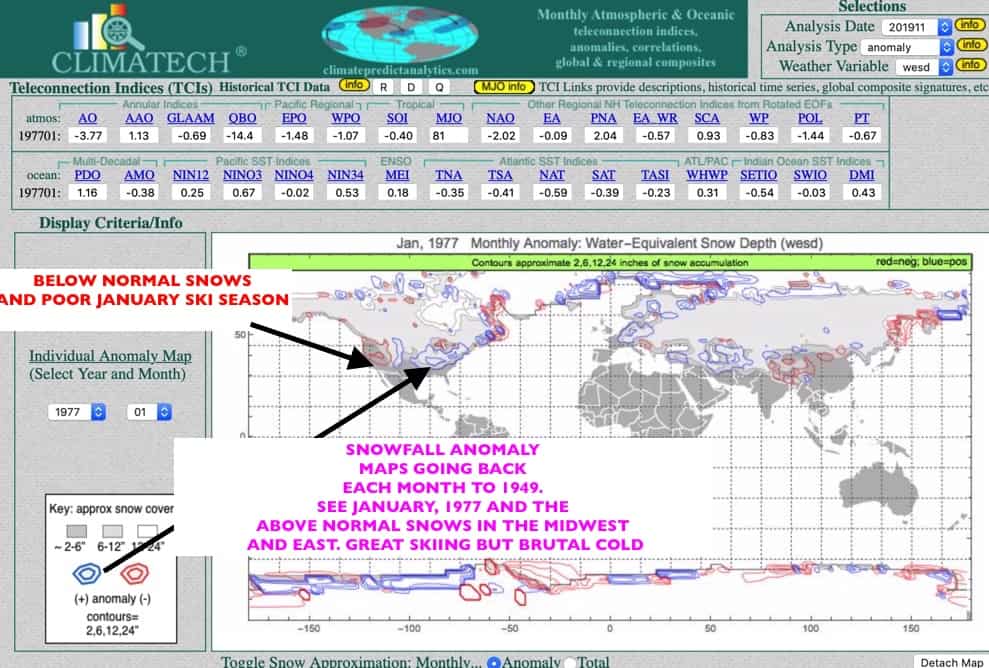
Want to look at different any winter of your choice and which teleconnections affected the snow season? Here, for example, is the frigid early 1977 winter.
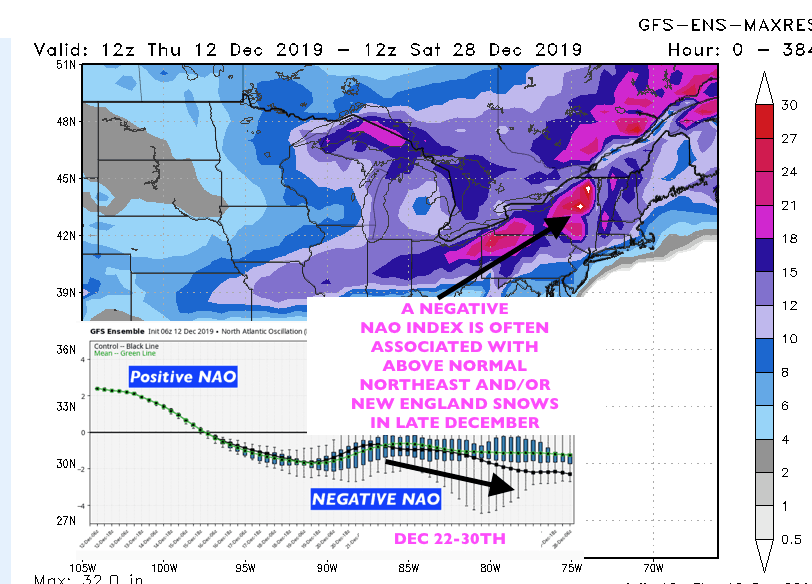
The user can look at such teleconnections as the NAO index. We can see, for example the NAO index going negative later in December. This tends to increase snowfall for the Northeast or New England
HELPING YOU MAKE THE BEST INVESTMENT DECISIONS BASED ON THE WEATHER
We use cookies to ensure that we give you the best experience on our website. If you continue to use this site we will assume that you are happy with it.OkPrivacy policy