
How to Prepare The Best Medium-Long Range Weather Forecasts For Your Clients
See video BELOW: HOW TO USE TELECONNECTIONS TO PREDICT WEATHER BETTER
For more information and a FREE TRIAL please go here

See video BELOW: HOW TO USE TELECONNECTIONS TO PREDICT WEATHER BETTER
For more information and a FREE TRIAL please go here

Click here to play the video above.
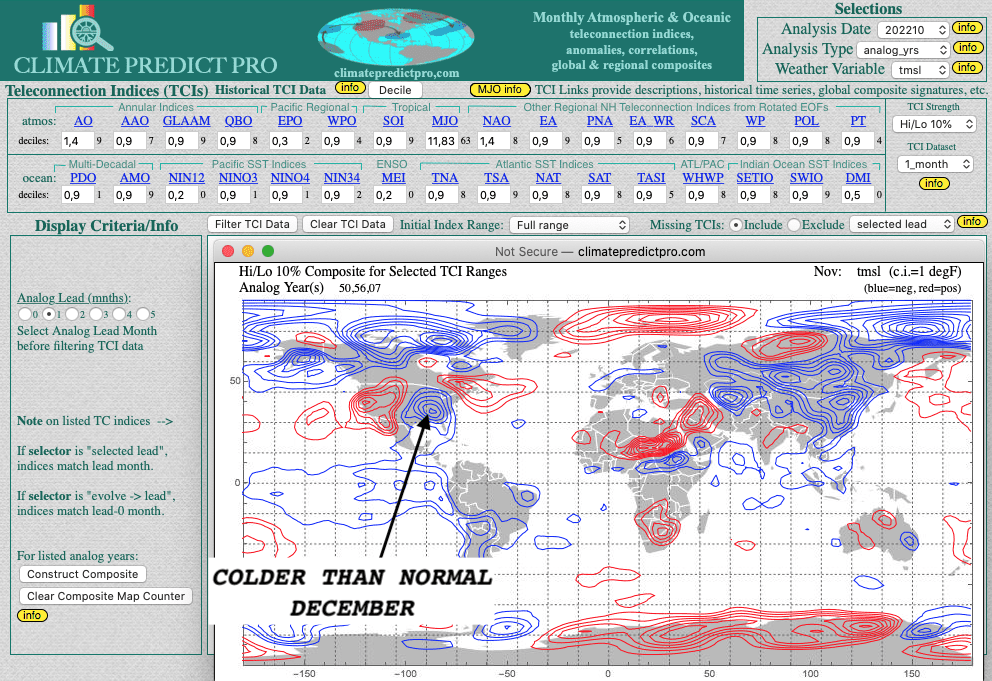
The historic volatility in natural gas continues. Last Friday, I told WeatherWealth clients about a major change in the weather pattern with a potential colder than normal late November and December. Natural gas prices proceeded to rally $1.00 from last Thursday’s lows and bearish EIA number to this Monday’s highs ($7.22) based on other firms changing their weather forecast.
This video describes both La Nina and what we call a “negative Eastern Pacific Oscillation Index. The combination of these two climatic variables working together can produce a cold, early winter. Why then did natural gas prices pretty much give everything back in one day? Incredible.
Here are the reasons I felt that natural gas (UNG) prices ran up too much, too quickly in the face of changing weather forecasts. After all, we had a near-record warm fall (globally) that has hurt natural gas demand. In addition, the main LNG export terminal in Freeport, Texas has been down for months.
1)Natural gas prices above $5-$6 this time of the year is very unusual as U.S. production continues to grow.
2) While the LNG export terminal will reopen soon, the weather forecast is warm for Europe. Hence, we need to see sustained cold weather, not just here in the U.S. but in Europe to help demand.
3) The weather last week was very warm across the United States and near-record temperatures this week. While potential colder late November and December weather could well occur, the natural gas market was anticipating another bearish EIA report this Thursday.
4) The European forecast models suggest that after just a week or so of U.S. cold, it will warm up again.
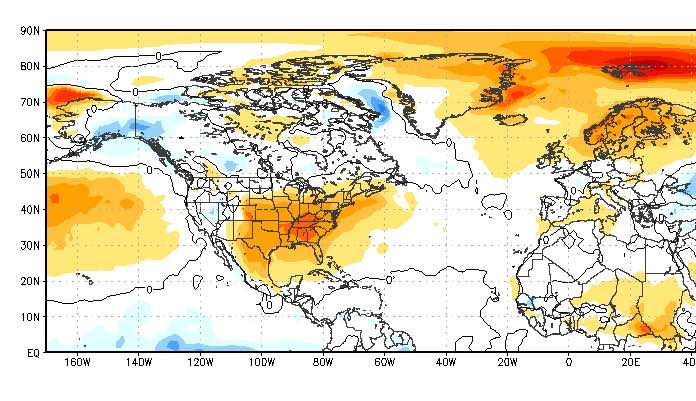
The European Model warms things up after Dec. 6 (red=warmer than normal). Source: Stormvista.com
So what to do in the natural gas market currently?
Based on extraordinary natural gas and weather volatility, using certain option positions is the way to go in this market. This is something we advised quite successfully in several commodity markets over the last few months.
Feel free to take a complimentary trial of our twice-weekly weather-commodity newsletter (Weather Wealth) and see this and many other reports. You can also learn how you can mimic our trade ideas in a new program called AutoTrade. All the information is here:
https://www.bestweatherinc.com/weather-profits/
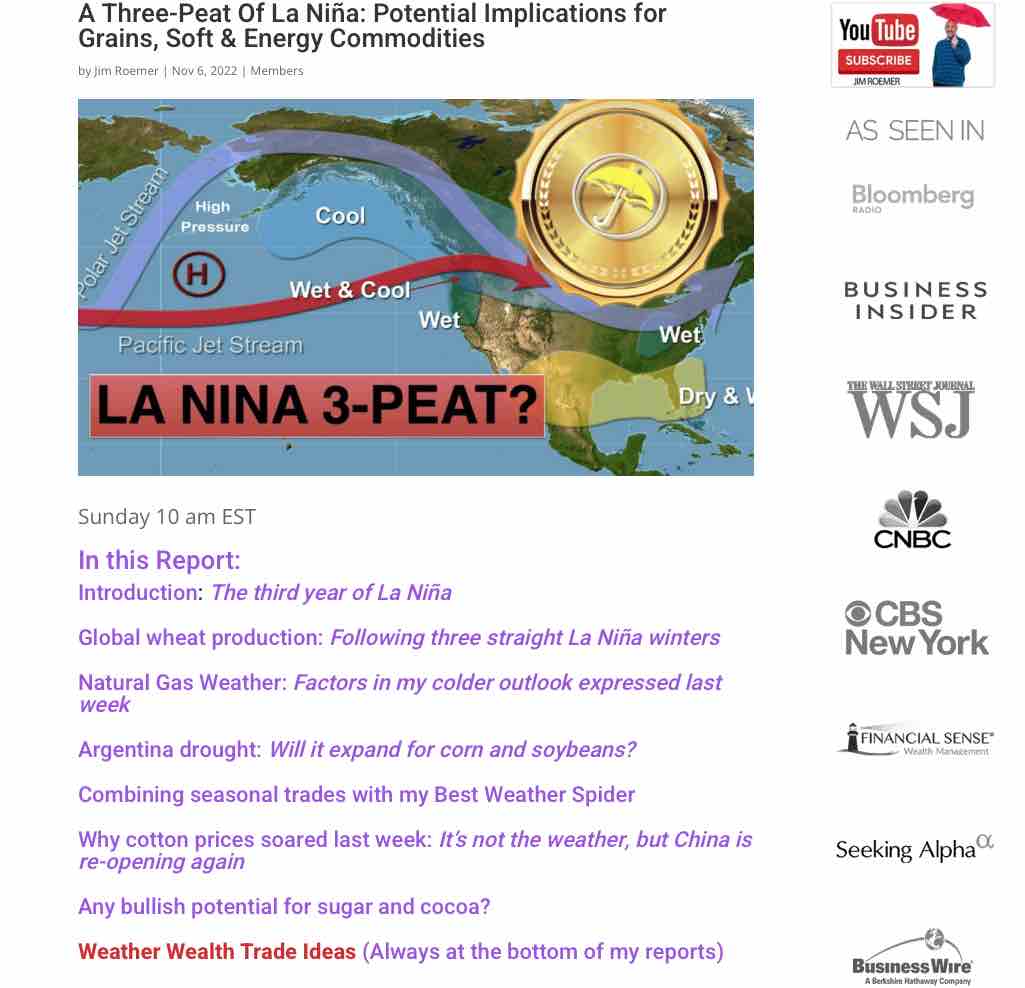
Here are the headlines from one of our recent Weather Wealth reports.
REMEMBER, THERE IS A RISK IN COMMODITY TRADING. PAST PERFORMANCE IS NOT INDICATIVE OF FUTURE RESULTS.
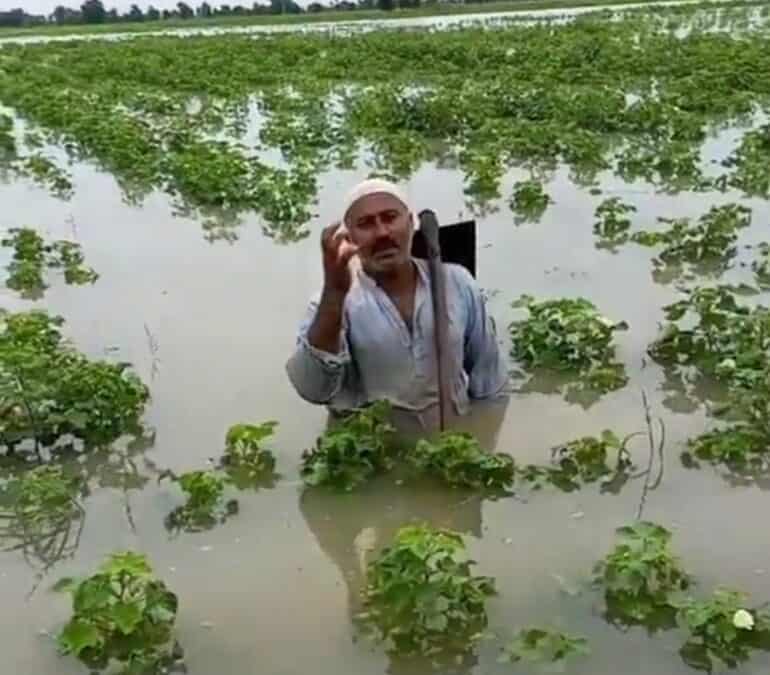
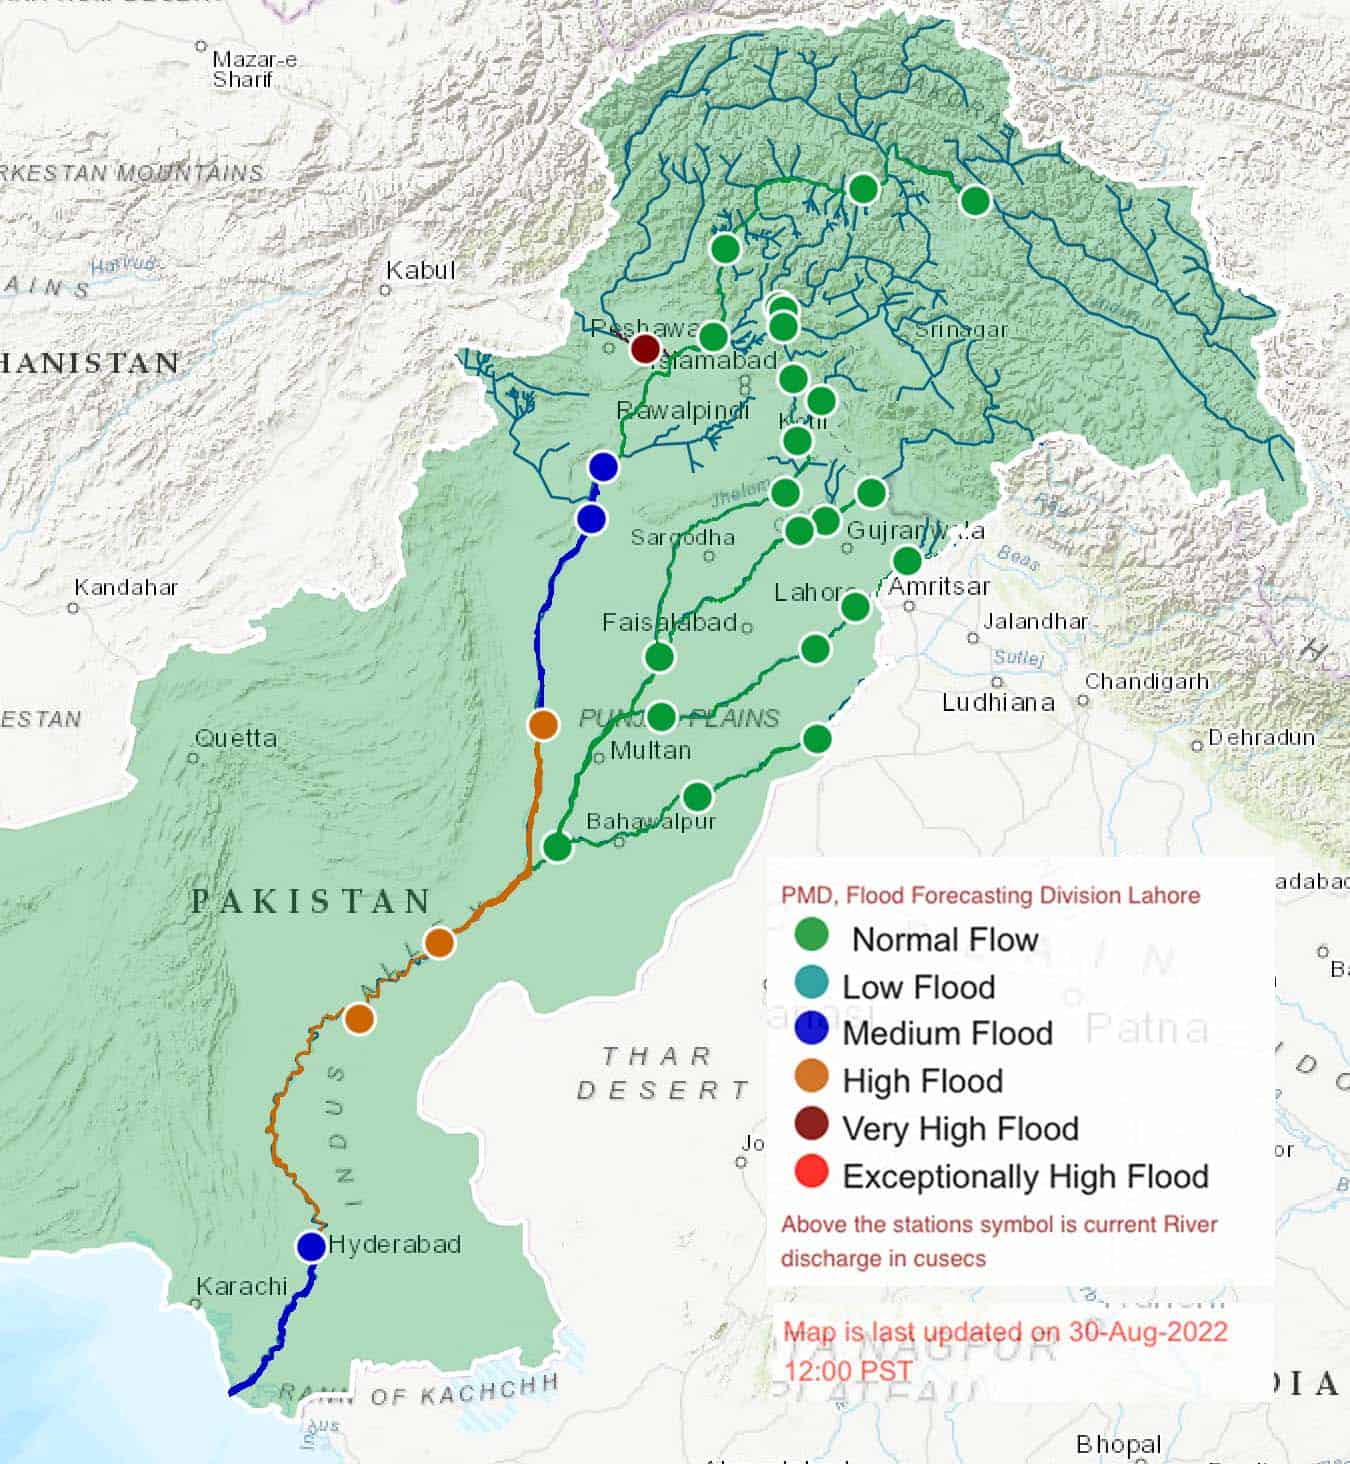
A “monsoon on steroids.” That’s how the UN Secretary-General described the weather bringing the climate-related floods to Pakistan and its crops. Most importantly for international markets, these include cotton and possibly wheat. Since June, over 1,100 people have died and one-seventh of the country’s population has been impacted by floods. The storms damaged around a million houses. Monsoon rains are over 400 per cent heavier than normal in some key agricultural provinces. The most Indus River flood damage is occurring in Sindh province, Pakistan’s second-largest producer of wheat and cotton.

Pakistan has two main growing seasons, winter and monsoon, also called kharif. Kharif crops include cotton, rice, sugarcane, and corn, as well as staples like dates, chilis, and onions. The main concern for planting this year’s kharif crops was drought, at first, as 21.6 per cent less rainfall than normal fell nationwide from January to April. High temperatures also plagued Sindh, Balochistan, south Khyber Pakhtunkhwa, and southern Punjab, which, in the main, are the areas now flooded.
Even before the catastrophic floods this monsoon season, drought impacted Sindh province’s agriculture. Sindh Agriculture Extension Department data showed 2022’s wheat production to be 17 per cent below the government’s targeted amount. The government target for cotton planting was 19 per cent higher than Sindh’s actual acreage.
Planning Minister Ahsan Iqbal told Reuters that almost half the country’s cotton crop had been destroyed. While Punjab provides the majority of Pakistan’s cotton crop, the monsoon destroyed almost all of Sindh’s crop.
By August 23rd, the outlook for cotton production in Sindh province already looked grim. “So far there is 45 per cent loss in cotton, 85 per cent loss in dates, and 31 per cent loss in rice in Sindh due to the ongoing monsoon. The standing sugarcane crop has also suffered damage up to 7 per cent due to floods, despite it being a high water-consuming crop, [which shows] the intensity of the disaster we are facing,” said Ali Nawaz Channar, technical director at Sindh’s Agriculture Extension service.
Within days, others estimated that continuing rains increased the losses. “The crop of cotton is almost 90-100 per cent damaged,” said the chair of the Sindh chapter of the Pakistan Businesses Forum. The Chief Minister of Sindh said 90 per cent of the province’s farmers had damaged or completely destroyed crops.
Around 37 per cent of Pakistan’s population works in agriculture, a sector that provides 22.4 per cent of the country’s GDP. Textile products and cotton make up around 60 per cent of the country’s exports. Cotton prices have already risen and Pakistan needs to increase imports to keep its mills spinning in the coming months.
“Now there is so much water that no future cultivation can be made. It would be impossible to grow wheat and sugarcane in Oct/Nov,” the Sindh Chamber of Agriculture President told a national newspaper. Predictions are that monsoon waters are unlikely to recede to allow timely wheat planting in October and November in many places. There also will be the need to repair irrigation systems and the more than 20 dams already breached or destroyed. Sindh province is home to the world’s largest barrage-based irrigation system.
Any decline in wheat production will only add to Pakistan’s humanitarian needs. While cotton fuels exports, it is wheat that fuels the country. Wheat makes up 70 per cent of Pakistan’s grain production and it is the country’s main food source. Even before the ravages of the COVID epidemic and the current flooding, approximately 40 per cent of Pakistanis were food insecure.
Many Pakistani commentators online blame the extent of the current crisis on the failure of the country’s government to make strategic infrastructure upgrades after 2010’s devastating flooding.
Pakistan is the 8th most affected country on the Long-Term Climate Risk Index. Increased temperatures and melting glaciers in Pakistan’s northern mountain region are the causes of the monsoon’s heavy rainfall, according to many analysts. The country has over 7,000 glaciers, more than anywhere on the planet outside the Poles. Neither increased global temperatures nor the melting glaciers are likely to end soon.
It’s not like Pakistan doesn’t have enough long-term woes. The IMF this week provided a new tranche to help the country stave off default and to address its ongoing economic crisis. And the heavy monsoon may also be seeding another problem for the country’s agriculture. FAO posits that the unexpected volume of rain may lead to increased locust breeding along both sides of the Indo-Pakistan border.
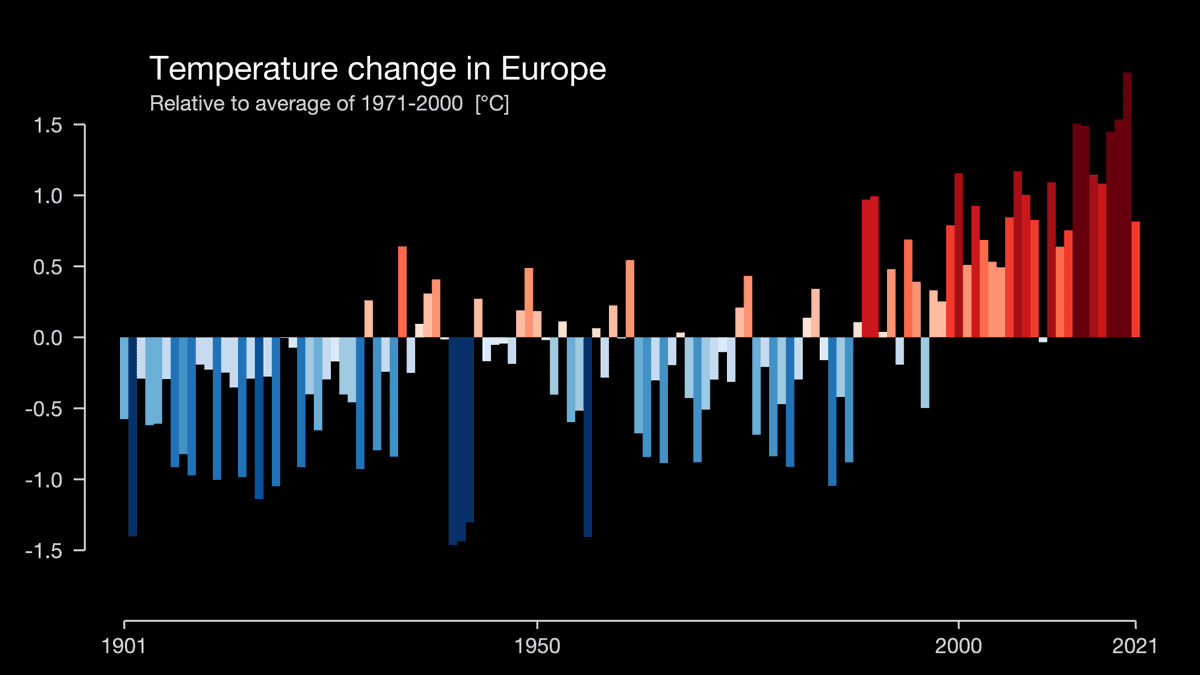
When the UK’s Met Office made a long-range forecast for British and European weather in 2020, no one foresaw that its extreme 2050 heat forecast would arrive in 2022. Tuesday, the UK recorded its highest temperature ever, 40.2 degrees Centigrade (104.4 F).
Across Europe, temperature records have been broken all week. Over 2,000 people have died in Portugal and Spain alone because of heat and wildfires rage from Turkey to Spain and north to the Arctic Circle. Agriculture is suffering, with corn yields predicted to go down by 30% in Italy and 16% in Spain.
The complete social and economic damage has yet to be calculated for this summer’s wild weather in the Northern Hemisphere but the European Environment Agency estimates that the continent has lost up to $552 billion in the last forty years from extreme weather events.
At a climate summit in Berlin this week, António Guterres, the United Nations Secretary-General, declared, “We have a choice. Collective action or collective suicide.”
WIth European temperatures reaching up to 115 Fahrenheit and London thirty Fahrenheit degrees higher than average, is it any wonder the UN Secretary-General despairs?
This is Europe’s second heatwave this year and forecasts call for more. Heat has not been the only concern for European agriculture this year, however. A record-setting cold snap in April came after higher than normal spring temperatures. Late frosts impacted almond and fruit trees in Spain and wine-growing regions in France. Impacts on grain-producing regions in Germany and other countries were small. however.
The current heat wave has led to early harvest in some soft wheat-producing areas. France’s Ministry of Agriculture forecast that 2022 soft wheat production would decline by 7.2% thanks to drought and heat. France is the largest wheat exporter in the European Union and the world’s fourth-largest.
Italy, too, has seen a decline in its soft wheat harvest this year. The Italian Association of Millers forecast this week that the soft wheat harvest would come in at 15% under 2021’s number. Durum wheat production, according to the Italian millers, could fall by 10%.
Minster of Agriculture Stefano Patuanelli announced last week that as much as 30% of Italian agriculture will be lost this year due to drought and heat. The government declared a heat and drought emergency in five provinces and Italy’s main farm lobby, Coldiretti, estimates that Italian farmers have lost up to US$3 billion.
In the Po Valley, the heartland of Italy’s rice growing area, heat and drought have decimated crops. The Po Valley includes the provinces of Lombardy, Emilia-Romagna, Friuli Venezia Giulia, and Piedmonte, some of the most productive land in the country. A farmer there estimated that up to 70% of their crops were already gone. Saline water from the sea normally reaches three miles up the Po. This year, it has intruded up to 18 miles inland, damaging crops irrigated with river water.
Yesterday, the European Commission published its report “Drought in Europe July 2022“, which found that an unprecedented 44% of land in Europe and the UK is at a drought warning stage, with 9% at the alert level. Winter-spring precipitation deficit was up to 22% more than in 2021 and this is stressing vegetation, especially in the south of the continent. Water Europe estimates that 59% of freshwater use in Europe is for agriculture, with a significant amount used to keep agriculture going in parched Southern Europe.
Water Europe also reports that annual renewable freshwater resources per inhabitant decreased across much of Europe during 1990-2017. The greatest decreases were seen in Spain (-65 %), the greenhouse for Europe, and Malta (-54 %).
In Italy, Minister Patuanelli said that the latest government research showed that Italy had lost 19% of its available water resources from 1991-2020 compared to 1921-1950. He added that the coming decades could see further decreases of up to 40%. Coldretti said that northern Italy has seen half the average rainfall for the last few years. To combat this year’s drought, water rationing has been instituted in cities across Italy.
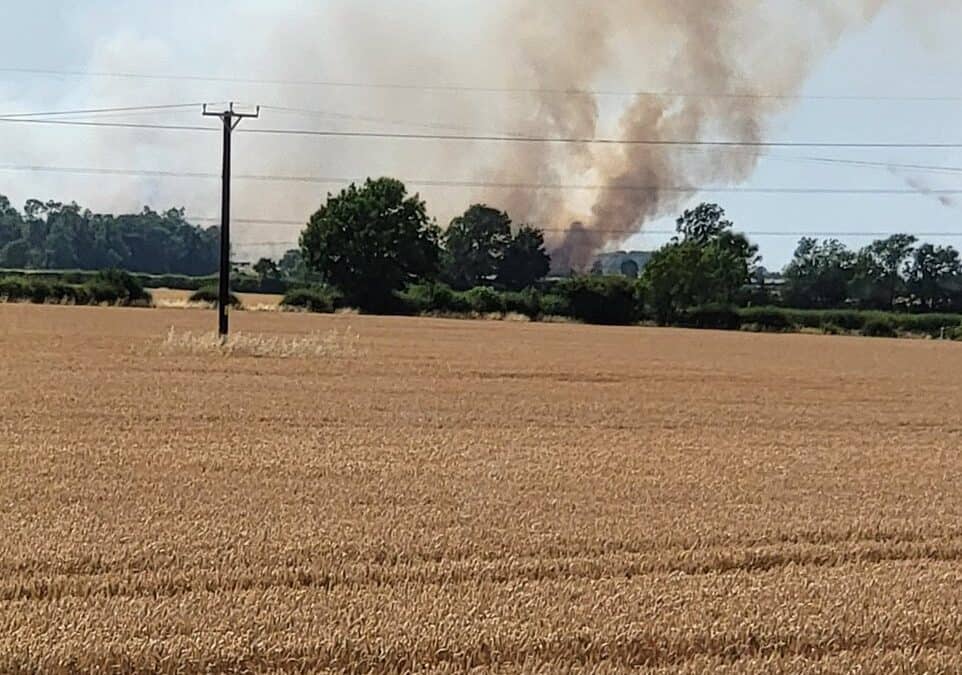
This summer’s heat waves have lead to record numbers of fires in forest and agriculture areas. The state of Brandenburg in Germany already has experienced over 260 wildfires this year. Forests in Southwest Europe have been hit unusually hard. Across Spain, over 70,000 hectares (173,000 acres) have burned, around twice the average area in a year. Meanwhile, a record number of hectares have burned in France for this time of year; the fire season has not hit its traditional height.

A recent study in Nature posited that Western Europe has been a heat wave hotspot for four decades, with heat events increasing in both frequency and intensity. The study found that there was an increased frequency of and intensity when the phenomenon of the upper atmosphere’s jet stream splitting into two occurred. Heat waves would then develop between the two flanks of the jet stream, leading to the rise in European temperatures. What caused this divide was not clear to researchers.
For most of Europe, the extreme weather impacts from climate change are already easily seen, no matter what the cause. “The moment of real climate crisis is 2022,” Rudolfo Laurenti, Deputy Director of the Bonifaca Po Delta Authority, told CNN.

Jim’s latest Market to Market interview covers grain market volatility, the possible future for currently good-looking crops, impacts of the continuing La Nina that few people besides Jim saw, and how beef cow operations are suffering.
He also touches on Brazil’s possible future weather for the rest of the year versus the Midwest’s outlook. What are the odds for an early Midwest frost and what can bring great weather for Midwest farmers next year? Why are crop yields hitting trendlines despite weather problems like 2020s Midwest derecho?
CLICK ON THE VIDEO TO PLAY
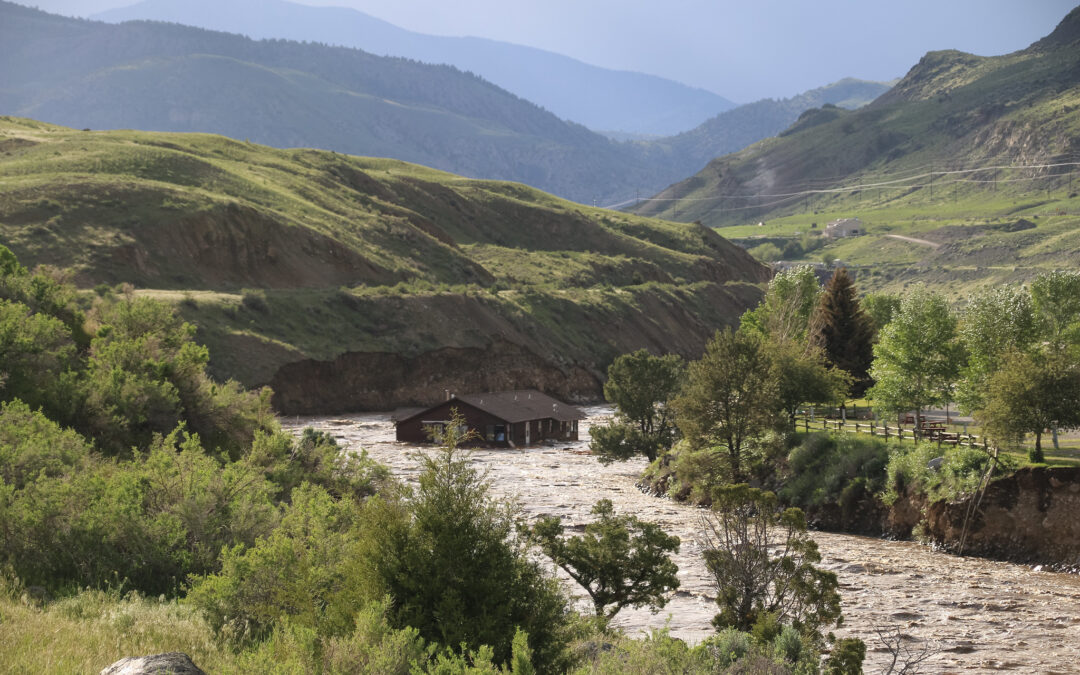
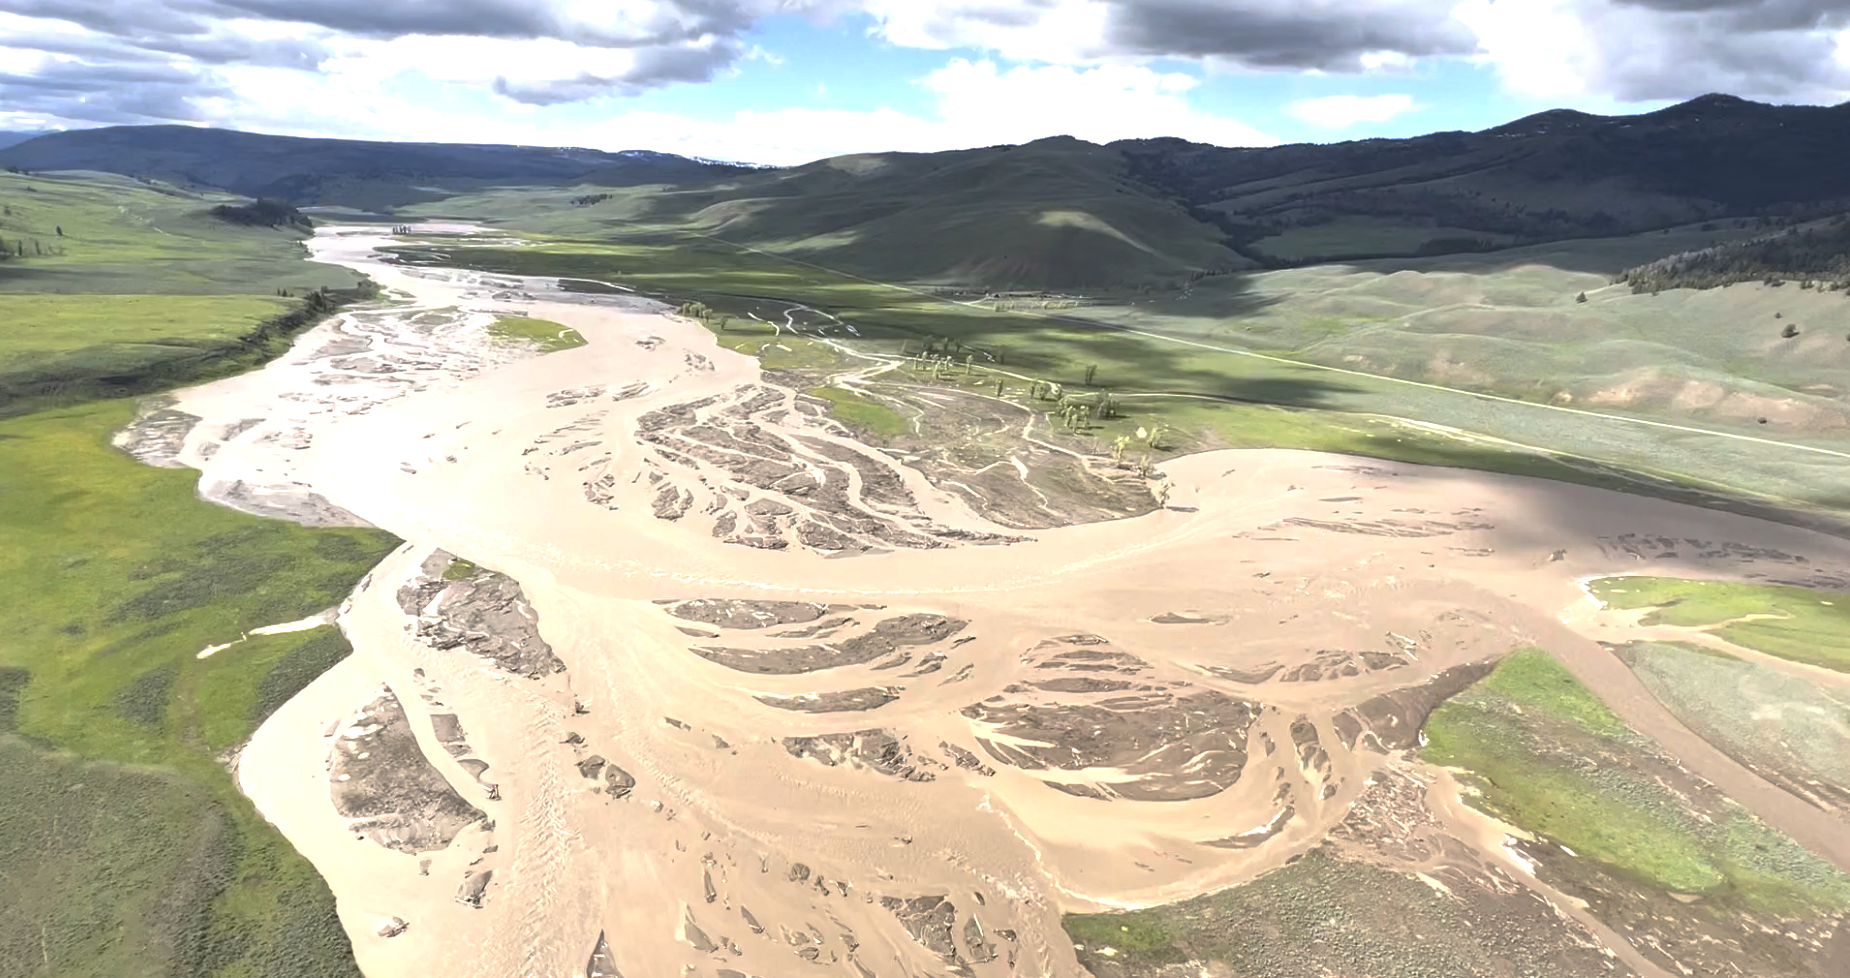
Over the course of three days this week, unprecedented rains and early snowmelt combined to close Yellowstone National Park and change its landscape forever. Rivers in Montana, Idaho, and Wyoming burst their banks.
The Park’s worst flood before those three days occurred in 1978. Experts called it a 1 in 100 years event. The US Geological Survey considered this month’s flooding to be a 1 in 500 years event.
Some forecasts see more precipitation in Yellowstone this weekend. Park administrators say they are watching the weather closely but park plans to rebuild ruined infrastructure are already underway. This time, however, they will take into account climate change.
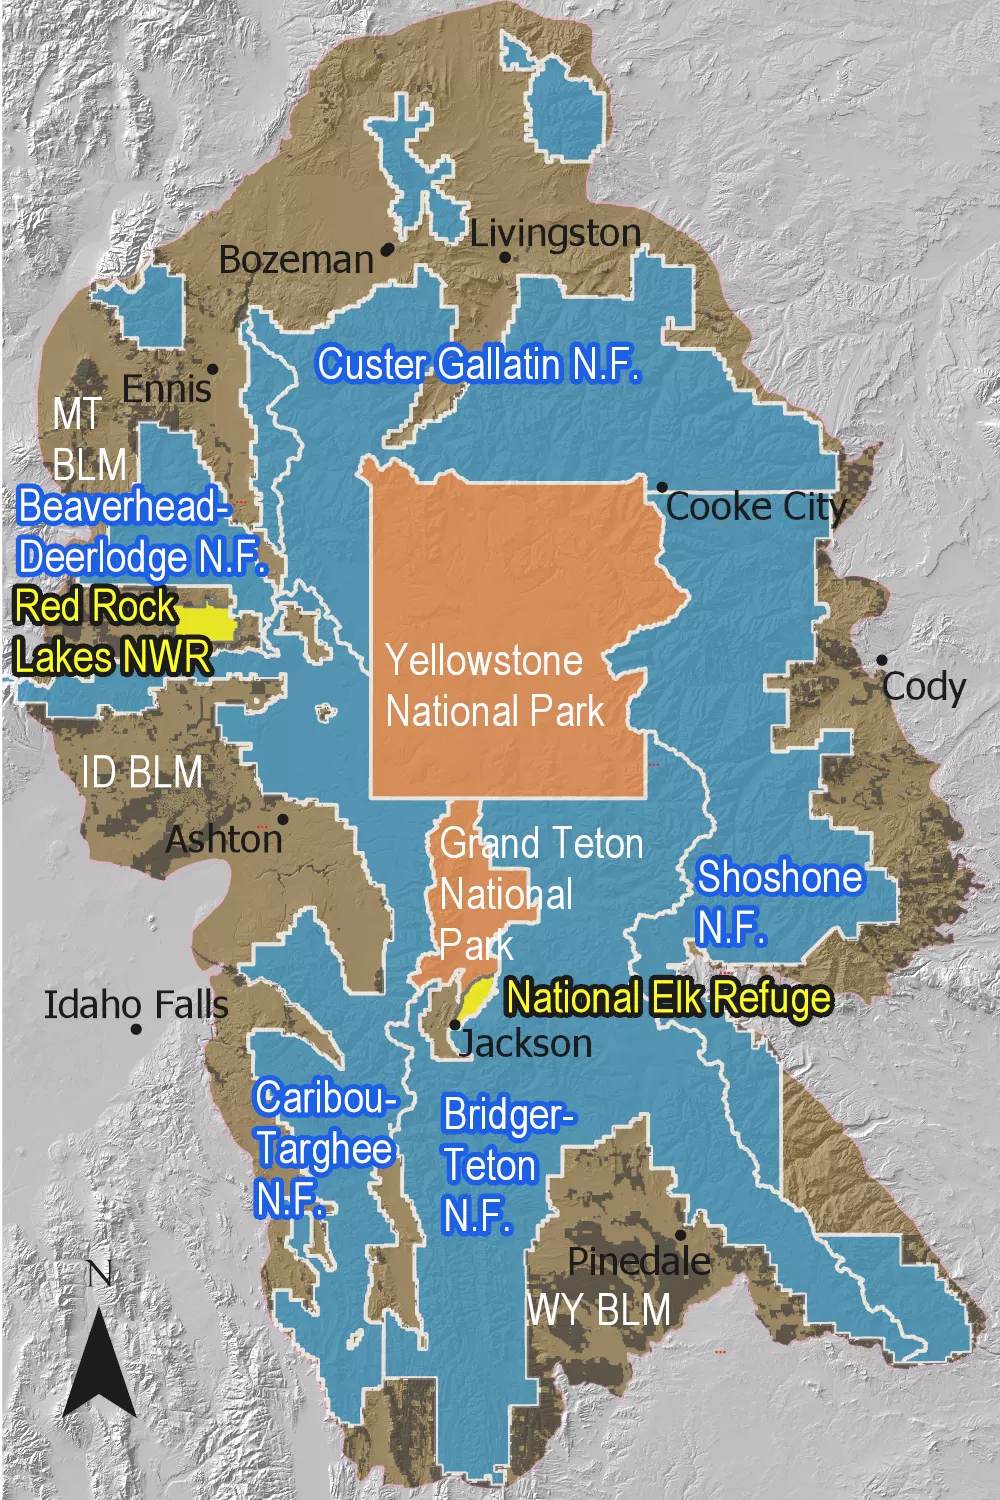
The Greater Yellowstone Area includes parts of six major rivers: the Missouri, Upper Yellowstone, Big Horn, Upper Green, Snake Headwaters, and Upper Snake. It is one of the few remaining large and nearly intact temperate ecosystems on Earth. As the 2021 Greater Yellowstone Climate Assessment (GYCA) noted, climate change impacts on the area often push the bounds of historical trends. What happens in this area also impacts agricultural areas in the Northern High Plains.
The 2021 GYCA predicted significant changes in precipitation timing and type. More spring rain and less winter snow are foreseen. Precipitation for June 2022 is already over 400% of normal in parts of the Yellowstone area.
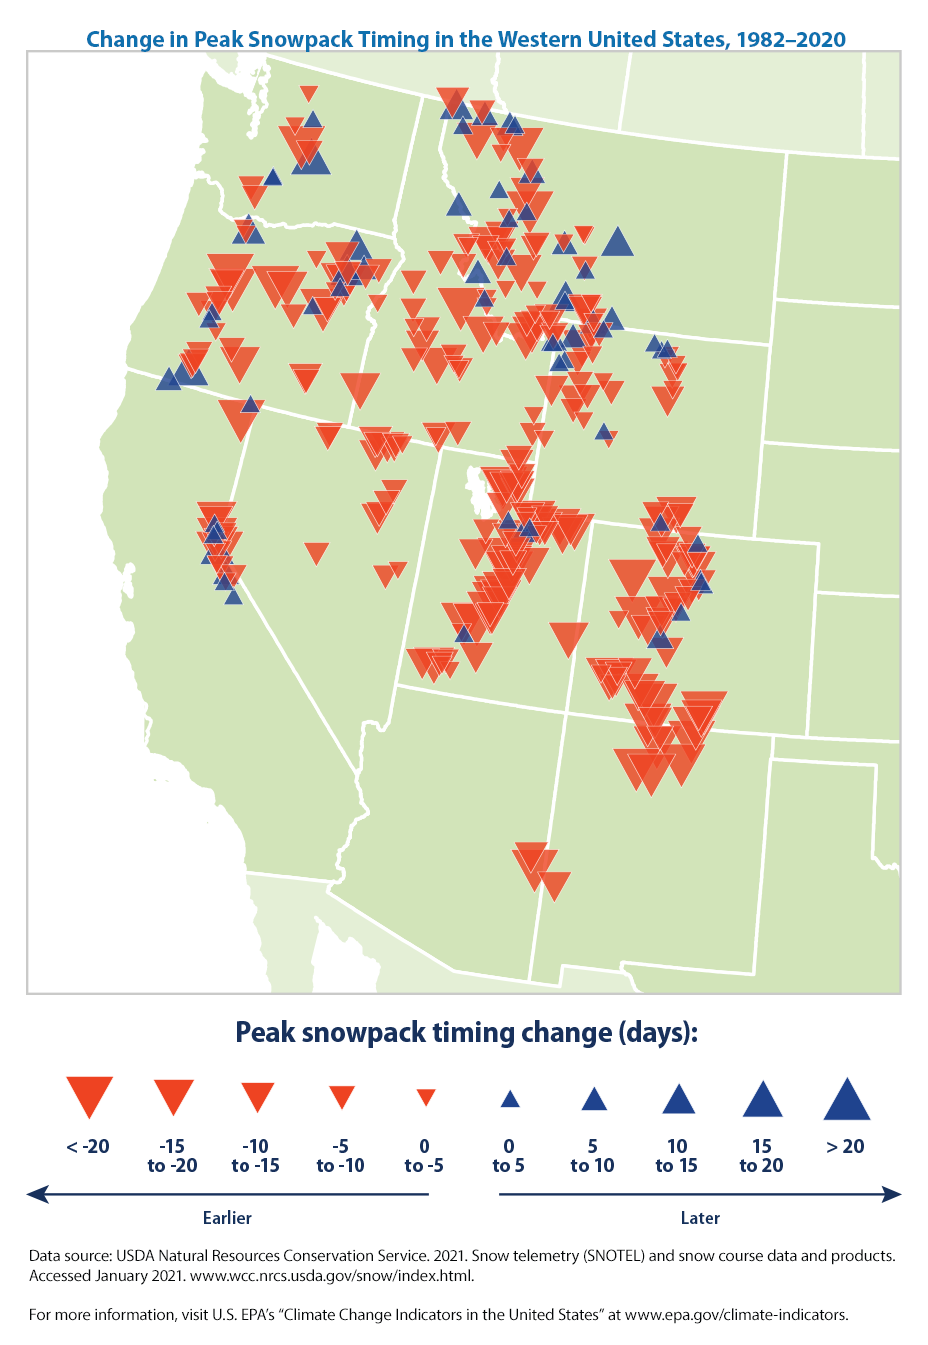
The timing of peak streamflows have already changed. Water amounts have not changed significantly in most of the area but there have been increases in the Yellowstone, Gallatin, and Madison rivers. All are tributaries of the Missouri River.
The GYCA showed peak flows have shifted 1 to 15 days earlier, lengthening the hot season when water is limited. In some areas, spring flows have increased by 30 to 80 percent. For other areas, minimum flows have declined by 10 to 40 percent in the summer and winter.
In the Greater Yellowstone Area, potential evapotranspiration is less than precipitation on an annual basis. At lower elevations in summer, the reverse is true. This brings an increasing seasonal water deficit.
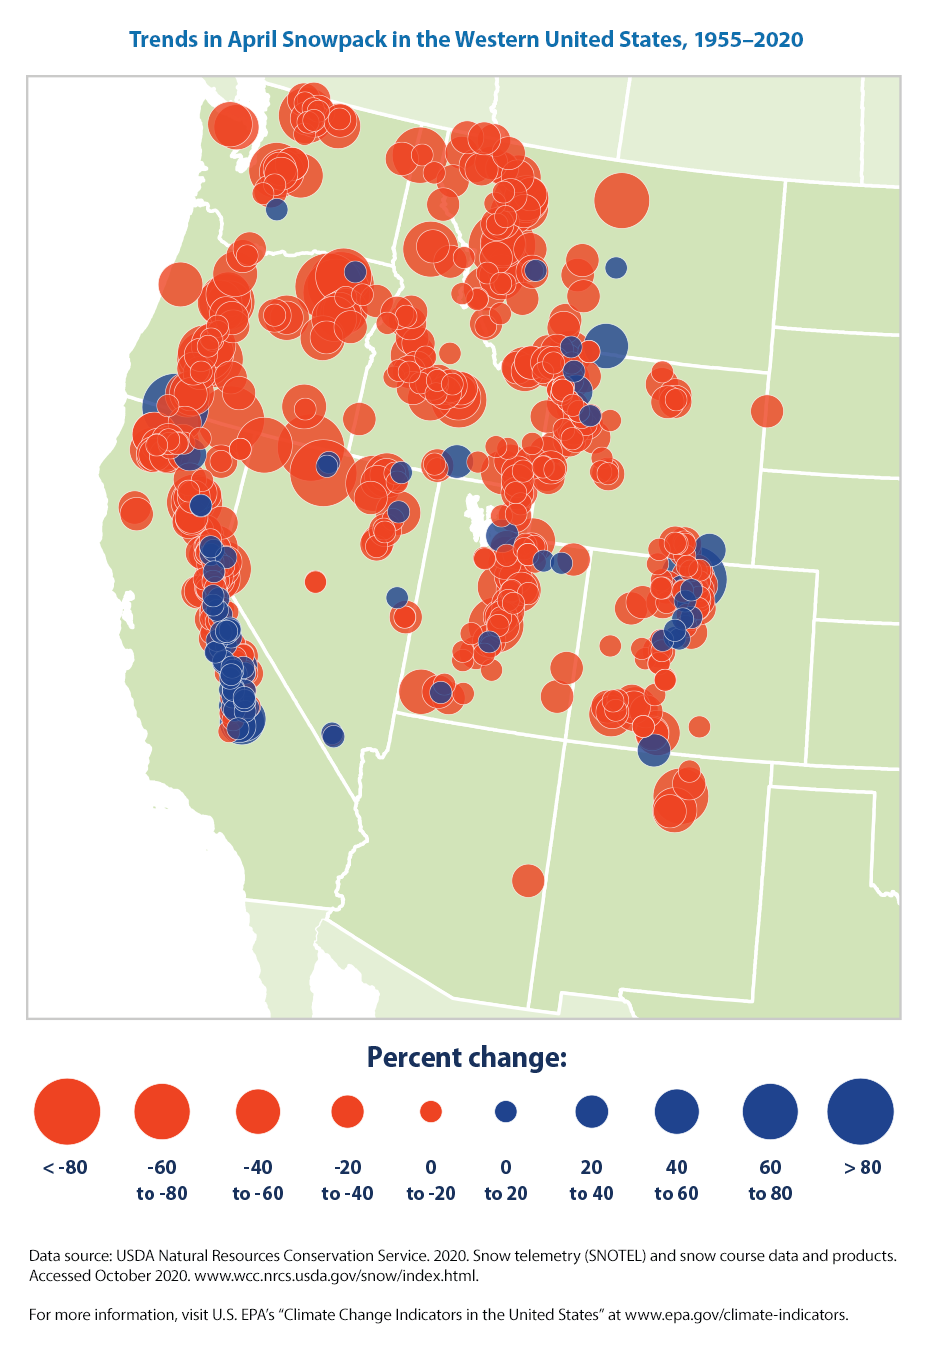
Warming winters are bringing earlier snowmelt and a loss of snowpack across the West, including in Yellowstone. Warmer winters bring a longer growing season because of longer summers but reduce water availability. They also increase fire risks. Both snowpack and soil moisture impact stream flow. The amount of annual streamflow can vary by up to 300 percent between years because of all these factors.
Yellowstone area climate change impacts the Missouri River headwaters and its tributaries. Some studies indicate that rainfall and water access are already changing in the Northern Great Plains and Central Midwest due to agricultural intensification. Models in the Fourth National Climate Assessment saw annual decreases of 30 days or more in the number of days with temperatures under 28 degrees by 2050. This would have serious implications for the region’s snowpack, streamflow, and water use.
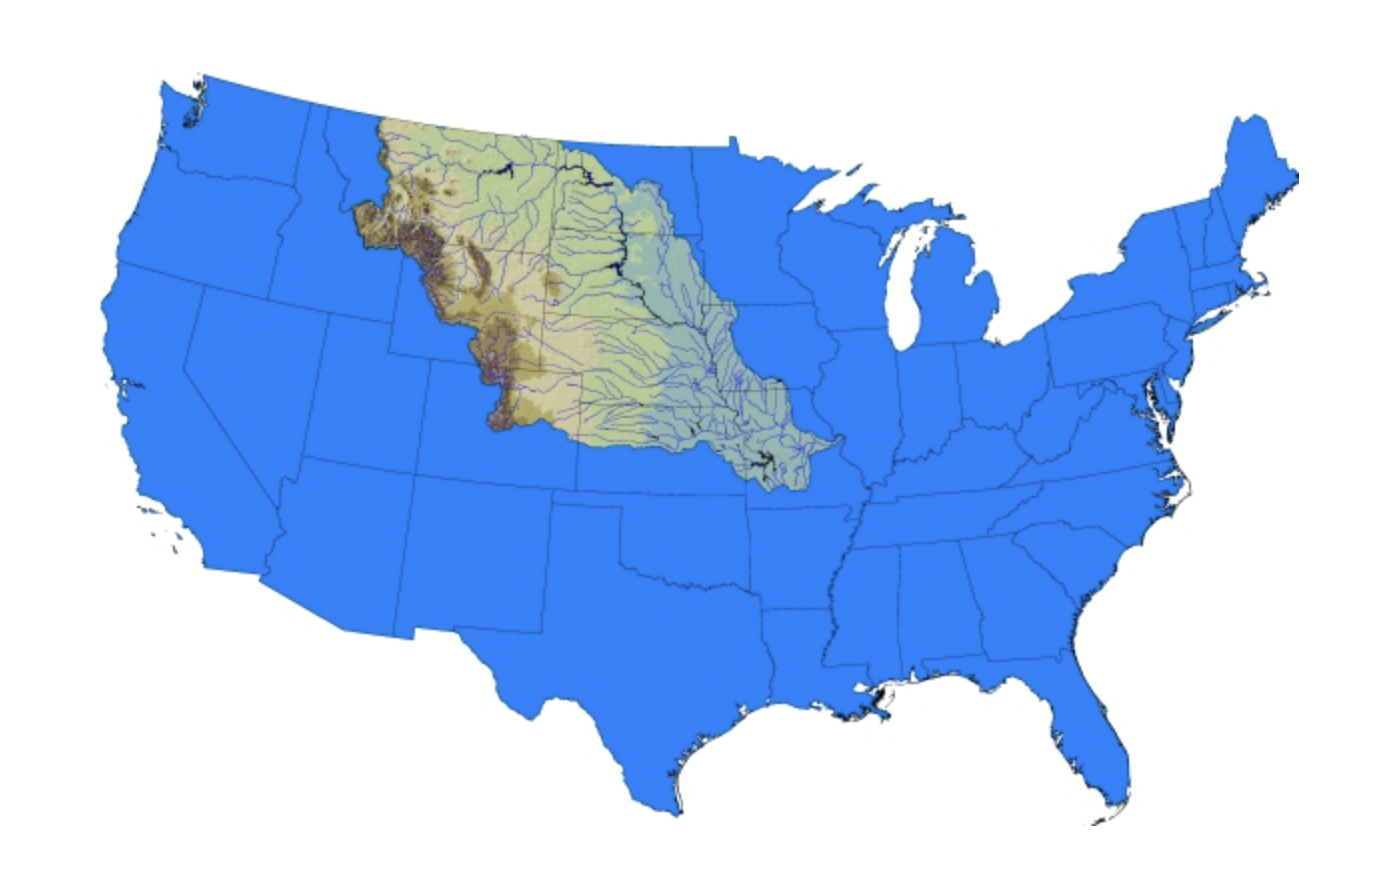
Parts of the Northern Great Plains are among the most arid in the United States. Because they are far from the coasts, the Northern Great Plains’ climate is not modulated by the oceans. Extreme drought or extreme flooding tends to happen every ten years or so. With less than ten percent of regional precipitation reaching the Missouri River, large changes in flooding can be brought about by small changes in precipitation. A good example of the region’s unpredictable weather is the severe flooding of 2011. It was followed by a drought in 2012.
The Northern Great Plains

Changes in peak streamflow timing since 1970 look similar to the peak timing during the 1930s Dust Bowl drought but the difference is that a year-round decline in precipitation caused the Dust Bowl. As the Greater Yellowstone Climate Assessment points out, the recent change in peak streamflow times is caused by spring temperatures rising sooner. Earlier spring warmth causes earlier snow melting.


HELPING YOU MAKE THE BEST INVESTMENT DECISIONS BASED ON THE WEATHER